Ein Link zum Festlegen deines Kennworts wurde gesendet an: Um in Zukunft auf deine Käufe zugreifen zu können, benötigst du ein Kennwort.
Kreativität ohne Ende – unbegrenzte Downloads plus leistungsstarke KI-Bearbeitung.
Neue Filter hinzugefügt
Sortieren nach

493.599 Ergebnisse für twitter in „Videos“

Meintest du: twiddler
A vibrant red bar graph with a sharp upward trending curved arrow against a solid black background representing financial success and economic advancement
00:10
HD
Digital Marketing interface showcasing online business analytics, audience engagement, campaign performance, and global brand communication.
00:12
HD
Stock market growth lines on 3D grid for financial investment trading trends economic rise and business forecasting animation
00:12
HD
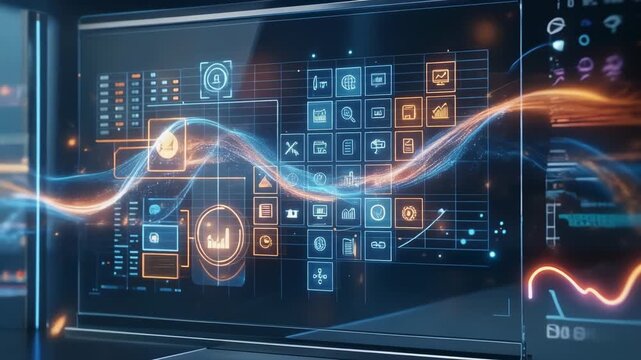
Streams of binary code merging into an analytics panel with trend line, donut share and summary table
00:20
HD
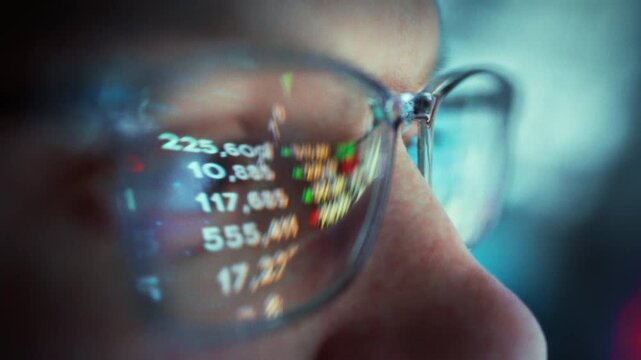
A young trader girl intently tracks real-time stock market fluctuations, her glasses reflecting the changing numbers on the screen, as she analyzes market trends with focus and precision
00:12
HD
Customer Service Manager Reviews Complaint Dashboards Analyzing Case
00:22
HD
A captivating visualization of dynamic financial growth featuring rising graphs against a city skyline backdrop, representing economic trends and market insights. Copula

00:10
HD
Gold price trend forecast with stacked gold bars shining bright for investment wealth and growth
00:08
HD
Abstract digital arrow pointing upwards, representing growth and progress in the future
00:08
HD
Macro CGI Visualization of Antioxidant Molecules Interacting with Cells in a Dynamic Biological Environment
00:08
HD
Floating digital panels and blurred interfaces create a sense of constant information flow, representing the overwhelming stream of data, news, and online communication in modern life.
00:08
HD
Glowing red neon downward graph with arrow indicating decline, loss, and negative trends on a dark, abstract background, perfect for conveying risk, crisis animation.Right-directional arrow loop.4k
00:10
HD
Blue animated business growth bar chart with rising trend line
00:10
HD
AI SEO assistant data, Futuristic digital finance growth chart data analysis technology background neon green glowing line graph stock market business success trend
00:06
HD
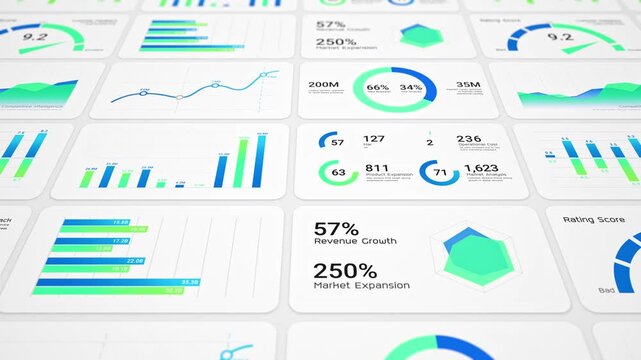
Business intelligence and financial performance analysis report on white background, animated infographic bar chart loop, investment data analytic graph dashboard, enterprise market statistics trend
00:14
HD
Digital network nodes glowing in dark futuristic cyber space with data flow connections
00:31
HD
Design an interactive visualization tool that tracks small business market trends by combining sales data local economic indicators and consumer behavior insights to support growth strategies and stra
00:10
HD
Medium shot of a professional analyzing social media trends on a laptop highlighting emerging market shifts through online data monitoring.
00:06
HD
Trading, tablet and team advice on computer screen in office for market timing, trends or overtime. Trader dashboard, people and tech with graphs at night for price movement, economy news and mentor
00:05
HD
Financial chart background with rising bar graph and candlestick market data showing growth profit and upward trend animation
00:10
HD
Financial market data animation video showing real time trading charts, investment analytics, business growth metrics, economic indicators, and performance trends visualization
00:08
HD
Hand placing a bar on a chart while displaying various types of graphical representations, concepts of data analysis, financial growth, and business strategy
00:17
HD
Business professionals point at data trends on a tablet screen capturing detailed market analysis hands analyzing stock market charts on a tablet, colleagues gathered around during a financial review
00:16
HD
Close up on views counter on social media or video player online as content becomes viral popular and trending more and more views rank up. Buzz and fame. Sharing liking content creation on internet
00:06
HD
Finance growth chart graph stock market upward data analysis business abstract background with rising green line over bar graph showing market trend investment statistic concept digital chart
00:10
HD
AI agent artificial intelligence stock market analysis smart trading strategy, financial investment, business growth portfolio, and futuristic automated economic concept
00:20
HD
High-tech data interface showcasing artificial intelligence concepts with detailed analytics, dynamic visuals, and user interaction, perfect for tech-related projects. Cipher
00:10
HD
Hand guides upward trend line. Fingers steady, confident gesture. Businessman projects growth visually. Ideal for finance or strategy presentations. Focus on clarity and forward momentum
00:05
HD
A woman with a hijab holds a smartphone in one hand and a card in the other hand. She smiles while looking at the phone. The background is a simple color. The footage is filmed in 4k.
00:14
HD
Neon-style bar chart showing descending bars with downward arrow animation
00:10
HD
A dense arrangement of digital screens and social media elements illustrates the constant influx of information, emphasizing content overload, multitasking, and digital consumption habits.
00:13
HD
Glowing neon line market Recovery Concept. Successful growth trend red line graph going Up. Abstract neon line arrow business graph on dark black background.
00:10
HD
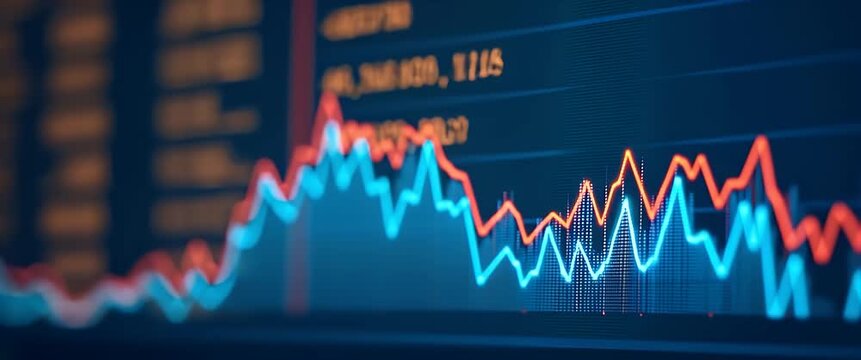
Glowing financial chart with neon lines in digital style on dark background, concept of data analysis and market trends
00:10
HD
AI SEO assistant data, Financial growth stock market business chart green arrow success investment profit digital graph upward trend economy business growth chart financial
00:08
HD
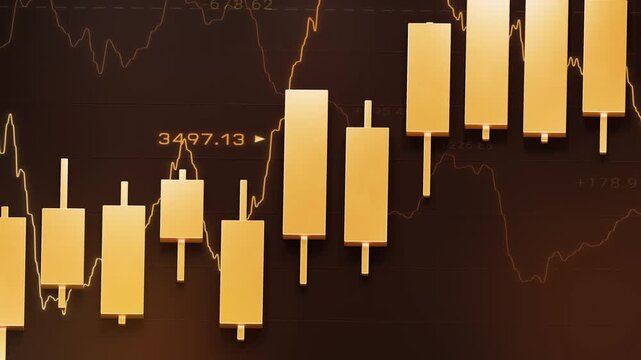
Golden candlestick bar floating with technical line chart, gold trading investment strategy, bullrish commodities market price trend graph, uptrend financial economic growth profit 3d rendering
00:18
HD
Animated bar chart with rising trend arrow showing business growth and financial success
00:05
HD
Stock market chart shows data trends over time with bars indicating price movements in trading activity.
00:10
HD
Motion Fx Smoke Elements Pack
00:23
HD
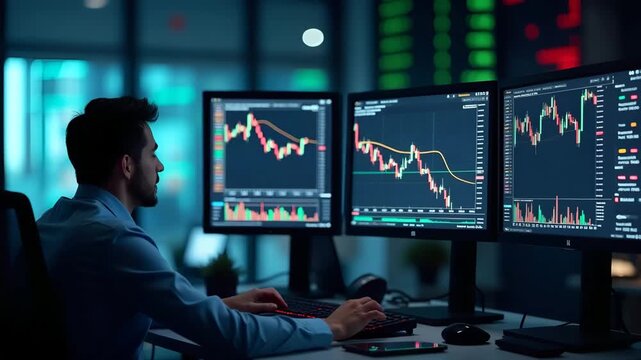
Professional trader analyzing bearish market trend on multiple monitors displaying falling stock indices candlestick patterns and volume indicators in modern trading floor in  Photo Stock  Concept  an
00:10
HD
Bar graph animation with dashed line. Bar graph blue upward trend on grid. Bar graph business statistics graphic on black background for performance tracking.
00:11
HD
Animated Views Counter Increasing for Viral Social Media Content. Transparent background, 4K resolution
00:10
HD
Financial dashboard for tracking investment performance and market trends
00:14
HD
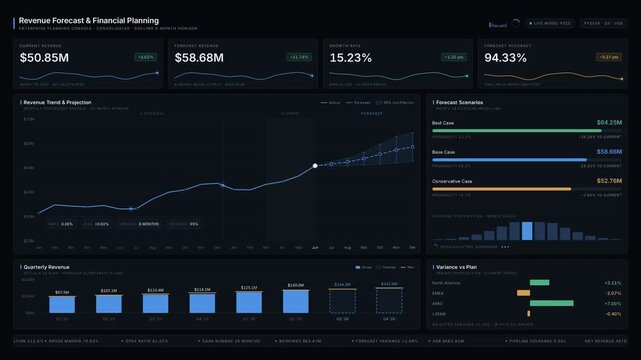
Professional revenue forecasting and financial planning dashboard animation featuring KPI cards, trend charts, and scenario forecasts for corporate presentations in dark mode.
00:15
HD
Skyscrapers with upward-trending financial chart and rising arrow, symbolizing business growth, investment success and real estate asset value. Ideal for property investment, financial market concepts
00:14
HD
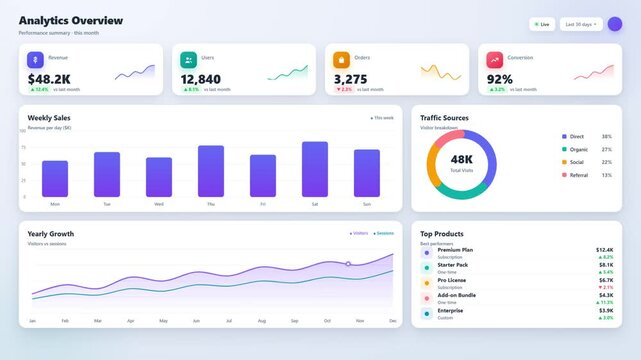
Analytics dashboard interface showing revenue charts user metrics and traffic data visualization
00:10
HD
Financial graph chart, market report, arrow up trend chart stock exchange asset, diagram investment capital gain world money economic growth
00:20
HD
Hands typing on laptop with data charts and security icons overlay showing analysis, statistics, and technology insights in a dark modern workspace Gluon.
00:10
HD
Dynamic financial growth bar chart animation with rising trend line and glowing success arrow for corporate business presentations, stock market analysis, economic forecasting, and data visualization
00:10
HD
Stressed businessman silhouette facing financial market crash with red downward trend charts in this cinematic motion background video clip
00:05
HD
Spending pattern for the last 60 seconds showing a red trend line with spikes
00:11
HD
Layered digital screens with social media feeds and profile interfaces floating in depth, highlighting content consumption, algorithm driven recommendations, and immersive mobile browsing experience.
00:10
HD
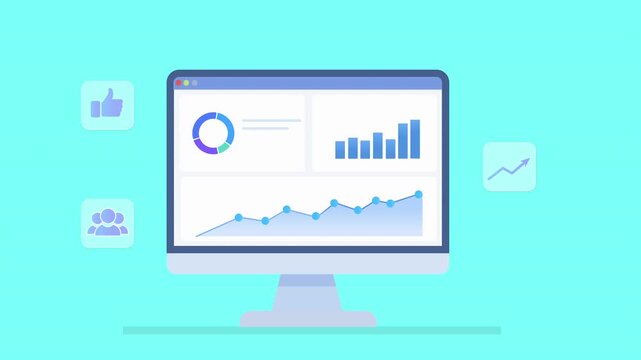
Animated illustration of a social media analytics dashboard with charts and engagement icons on desktop monitor, suitable for marketing and business concepts.
00:10
HD
A stock analyst in glasses sits at his computer in a night-time office, monitoring the stock exchange with real-time data. His lenses reflect fluctuating numbers as he analyzes stocks
00:08
HD
Futuristic digital interface showcasing data analysis and technology trends for modern business solutions
00:05
HD
Hand holds a brownish nail polish bottle with neatly manicured nails against a matching warm backdrop in a cozy setting
00:10
HD
Business intelligence and financial performance analysis report on white background, animated infographic bar chart, investment data analytic graph dashboard, success corporate market statistics trend
00:20
HD
Glowing neon line market Recovery Concept. Successful growth trend red line graph going Up. Abstract neon line arrow business graph on dark background.
00:10
HD
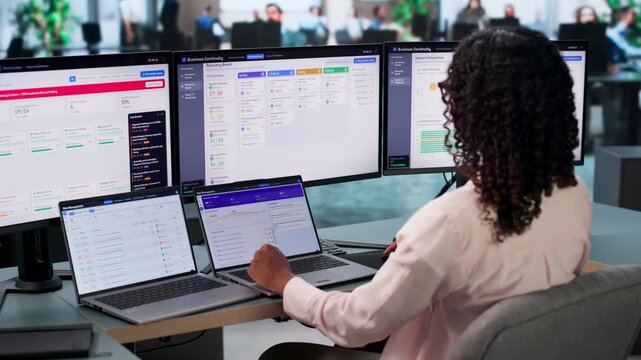
Business Analyst Monitors Real-time Software Dashboard Ensuring Operational
00:21
HD
Glowing neon line market Recovery Concept. Successful growth trend red line graph going Up. Abstract neon line arrow. animation
00:10
HD
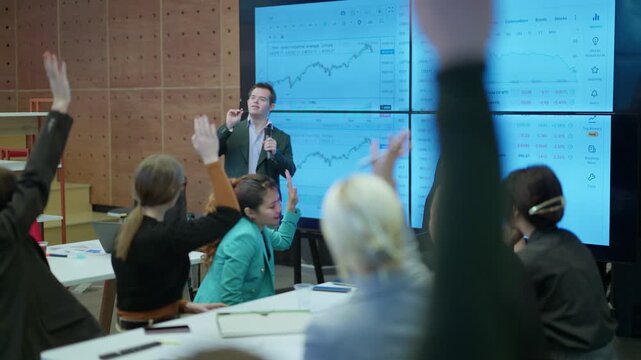
A speaker with Down Syndrome actively presents financial data to an engaged audience of colleagues. Businesspeople raise their hands, participating in the interactive presentation on market trends
00:14
HD
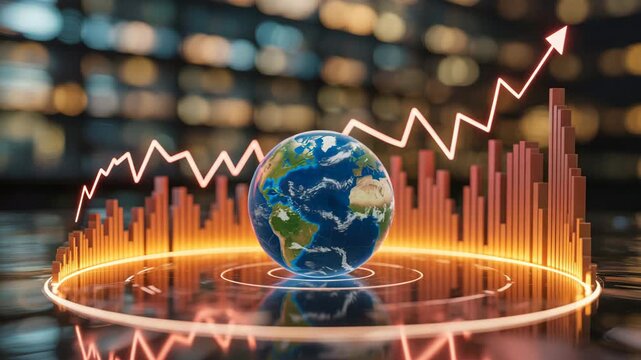
Global financial growth chart with earth and upward trending arrow globe world
00:10
HD
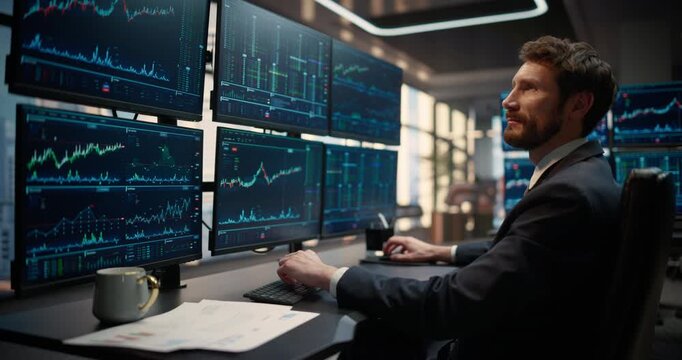
Side Profile Portrait of Stockbroker at Desk Looking at Computer Screens Showing Stock Exchange Data, Equity Charts, Investment Analytics, Asset Management, Financial Graphs to Track Market Trends
00:16
HD
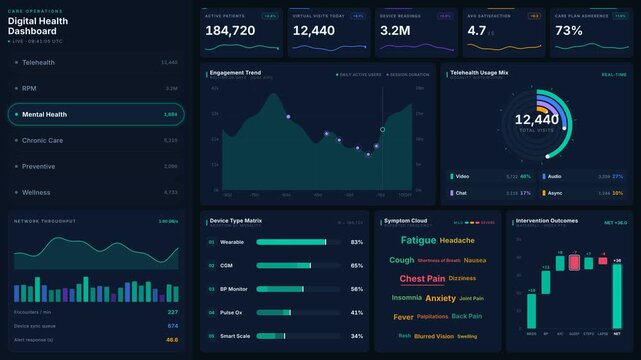
Explore a 4K dark-mode digital health dashboard featuring animated KPIs, engagement trend charts, and telehealth usage breakdowns designed for modern telehealth applications.
00:15
HD
Woman analyst accountant in office reviewing spreadsheet. She checks data on a computer monitor to ensure accuracy and reporting for team leaders. Clear concept of financial data analysis.
00:06
HD
Economic recovery insights showcased in refined photo stock visuals reveal strategic business adaptations robust market performance and data driven growth trends for sustainable progress in  Photo Sto
00:10
HD
Legal Compliance Regulation Icons Hologram Scales Gavel Animation Black Background
00:14
HD
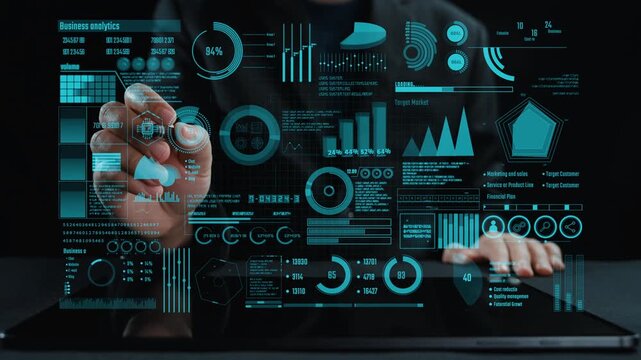
A professional analyzing business data through an interactive digital interface, showcasing various graphs and metrics in a modern workspace setting. Cipher
00:13
HD
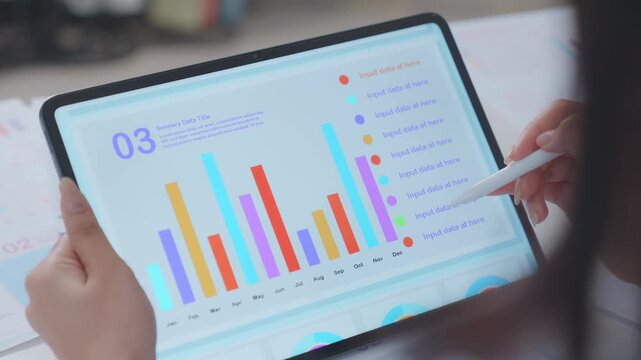
Blur Close up. financial advisor or crypto trader holding digital tablet in hands consulting stock market investor analyzing trade charts dynamic indexes investing trends on tab screen. Business anal
00:11
HD
Choosing Cleaning Materials in the Kitchen: Balancing Towels, Sprays and Modern Cleaning Tech
00:14
HD
Social Media 3 Million Views Counter Animation with Like Button and Viral Engagement UI
00:20
HD
Horizontal retro computer error windows cascade with classic 90s Microsoft blue screen aesthetic and comedic visual chaos. Ideal for tech-themed videos, nostalgic meme content digital storytelling
00:12
HD
Red heart fountain fly up animation on transparent background. Live stream reactions in social media. Follower like support. Love button emoji motion graphic.
00:20
HD
Abstract financial chart with glowing digital candlestick data points moving across dark screen representing stock market volatility investment analysis business growth and economic trends.
00:10
HD
Financial market chart with candlesticks and line graph, Abstract financial chart with candlestick bars and line graphs market analysis growth and data trends animation
00:10
HD
Business growth concept in allusive graph chart showing marketing sales profit increasing to target . Excellent financial status of corporate business rise up.4k animation video graph
00:10
HD
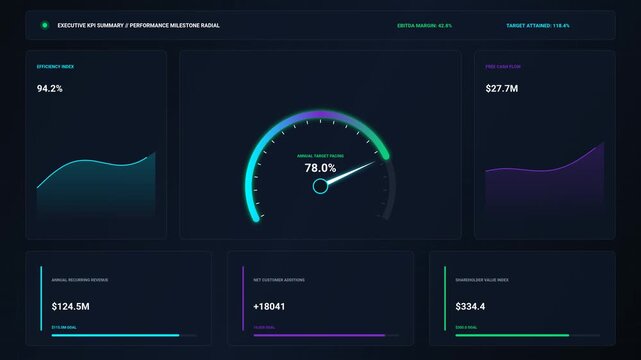
Modern Business Intelligence KPI Dashboard with Radial Performance Gauge
00:10
HD
Arrow up trend chart stock exchange asset, diagram investment capital gain world money economic growth, financial graph chart, market report
00:20
HD
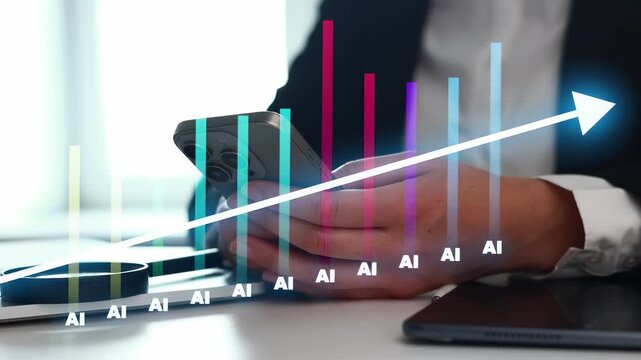
A person is holding a smartphone while analyzing data trends on a desk. Various graphs show increasing values and keywords related to AI. This scene takes place in an office setting.
00:10
HD
Macro side view of trendy iced ube latte with ice cubes, vibrant purple wellness drink. Trendy and aesthetic coffee shop beverage made from purple yam, associated with superfood trends and refreshi
00:08
HD
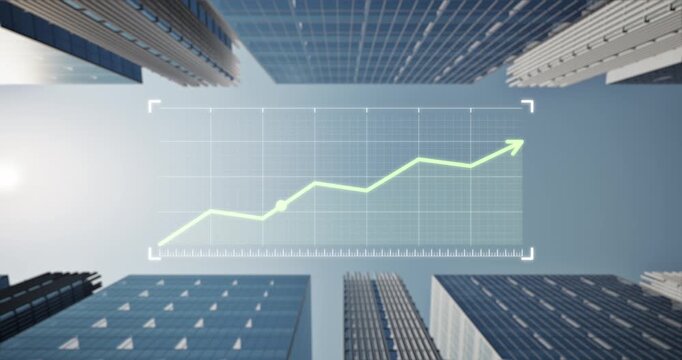
Dynamic rising green graph with upward arrow over backdrop of towering skyscrapers, clear sky. Symbolizes real estate investment growth, increasing property value and strong market performance.
00:12
HD
Financial growth concept with money bag and upward trending bar chart on green screen
00:15
HD
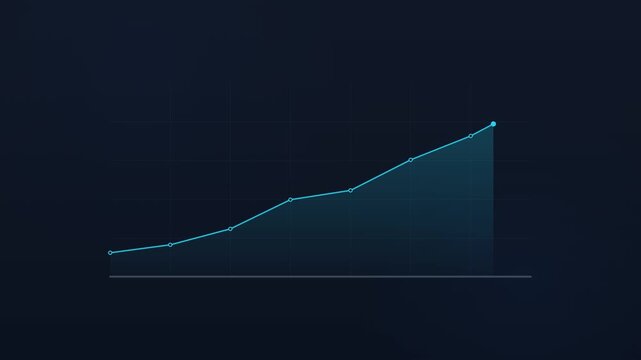
Animated horizontal line chart with glowing area fill showing positive business growth trajectory on dark background
00:08
HD
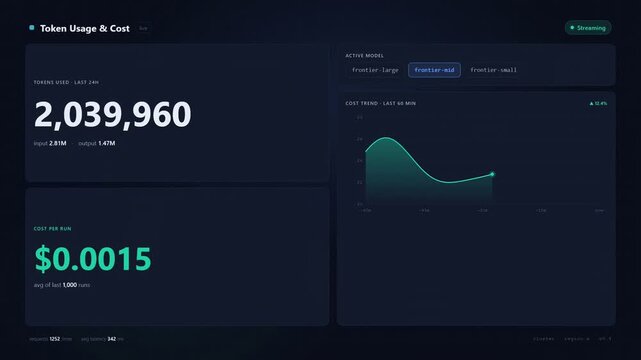
Real-Time AI Token Usage & Cost Dashboard. Monitor LLM API expenses, token consumption, and model performance with animated data visualization.
00:15
HD
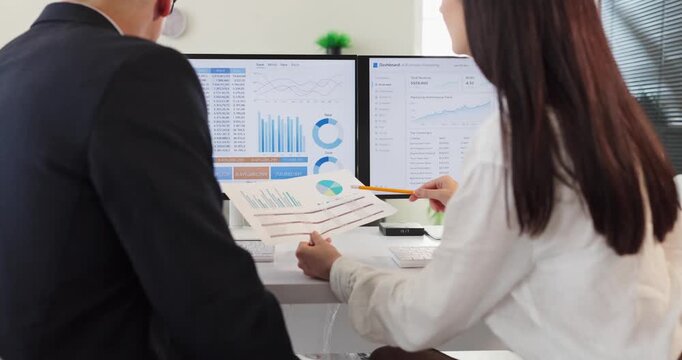
Analysts teamwork discuss finance data and dashboard. Colleagues review charts on computer screens and printouts, aligning analytics with metrics. Concept image of collaborative office analysis.
00:11
HD
​Red downward trend graph with negative money counter showing financial loss and stock market crash
00:08
HD
Businesswoman workspace with Digital Interfaces Showcasing AI Agents , AI Generated and Data Analytics on digital tablet Representing Technology and Innovation in Business Gluon
00:09
HD
Digital Interaction with Social Media Icons and Emoticons Displayed While Typing on a Laptop Keyboard in a Bright Workspace Gluon.
00:10
HD
Dedicated financial analyst reviewing rising market trends and stock fluctuations on multiple glowing digital screens within office animation video footage
00:05
HD
Business growth roi increase with ai integration system development reduce cost improve efficiency successful corporate strategy innovation project management strategic planning corporate progress
00:05
HD
Neon Glowing Upward Growth Graph Chart on Black Background Minimalist Concept
00:08
HD
Animated montage of multiple screens displaying social media feeds, videos, and analytics dashboards, capturing the digital lifestyle and the constant interaction with online content.
00:13
HD
Financial growth chart analysis with upward trend in modern office setting
00:10
HD
Global stock market data visualized with glowing earth and futuristic financial chart motion graphics, representing economic trends and digital analytics, dynamic investment background footage.
00:10
HD
Declining bar chart with downward trend, Blue bar chart with falling line graph decline in business data, finance performance and analytics animation
00:07
HD
Social media and notificaition icons. Social networking service.
00:14
HD
A captivating close-up shot of a woman's full, glossy red lips as she applies a vibrant lip gloss, showcasing beauty and cosmetic application.
00:05
HD
Three women in 1980s fashion, vibrant clothing, bold hairstyles, and oversized sunglasses, embodying the energetic 80s lifestyle, showcasing bright colors and unique apparel.
00:07
HD
Futuristic digital globe surrounded by data screens displaying global information and analytics
00:08
HD
ソーシャルネットワーク
00:20
HD
Industrial business concept with rising financial graph overlaying oil refinery plant at night. Symbolize increasing oil prices, refinery operating costs and growth in global power and energy sector.
00:18
HD