Ein Link zum Festlegen deines Kennworts wurde gesendet an: Um in Zukunft auf deine Käufe zugreifen zu können, benötigst du ein Kennwort.
Kreativität ohne Ende – unbegrenzte Downloads plus leistungsstarke KI-Bearbeitung.
Neue Filter hinzugefügt
Sortieren nach

390.964 Ergebnisse für statistics in „Videos“

Business team analyzing financial data and marketing strategy
00:20
HD
Minimalist Financial Growth Curve Chart on Black Background
00:10
HD
Finance growth chart graph stock market upward data analysis business abstract background with rising green line over bar graph showing market trend investment statistic concept digital chart
00:10
HD
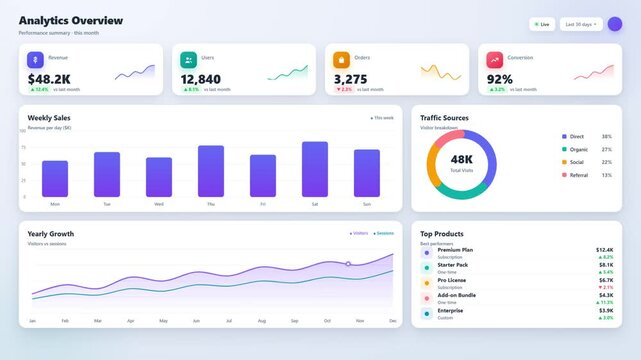
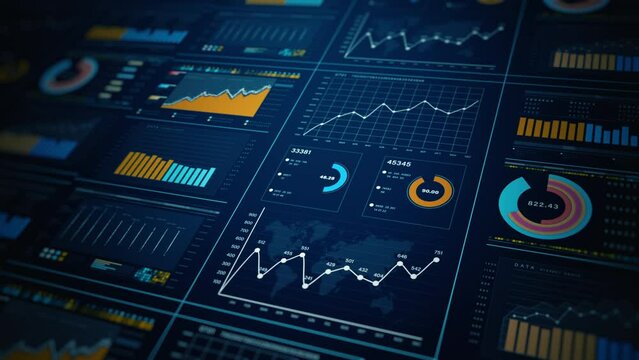
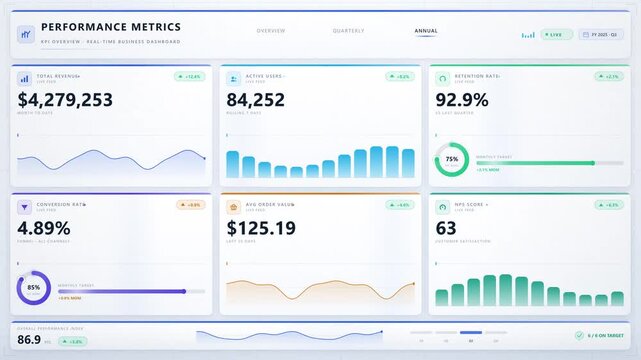
Analytics dashboard interface showing revenue charts user metrics and traffic data visualization
00:10
HD
Top Down View of Businesswomen and Businessmen Meeting Around Office Desk With Laptops and Reports as Linked Visualization of Glowing Icons Statistics, Cybersecurity, SAAS and AI.
00:07
HD
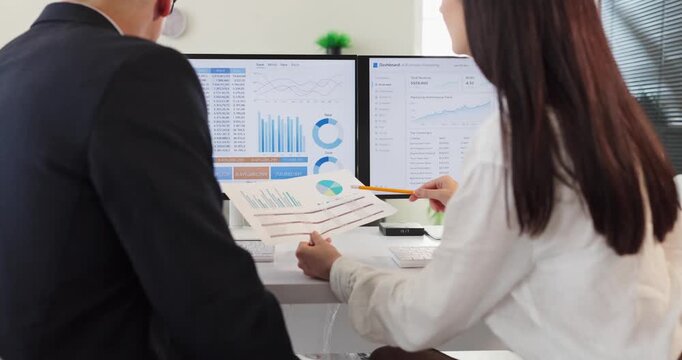
Analysts teamwork discuss finance data and dashboard. Colleagues review charts on computer screens and printouts, aligning analytics with metrics. Concept image of collaborative office analysis.
00:11
HD
Abstract digital project management board with interactive task cards and notifications on a dark purple background
00:10
HD
Glowing dollar sign surrounded by financial charts and graphs
00:08
HD
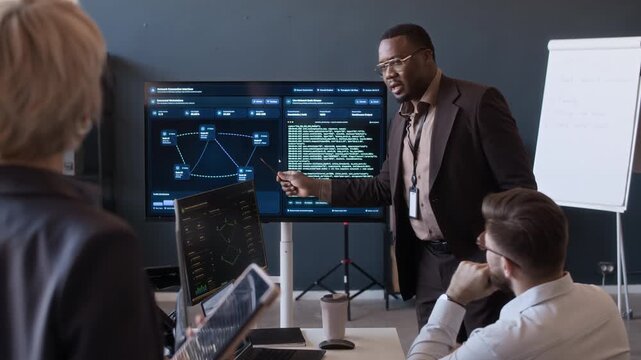
Medium long shot of young Black tech specialist presenting network data on screen to cybersecurity team while meeting in office
00:13
HD
Senior insurance advisor showing financial charts and data on a tablet to a young female client during a professional office consultation.
00:12
HD
Holographic charts financial statistics on table in night office interior
00:06
HD
Advanced data analytics dashboard display. Business and financial investment. HUD infographic of financial. Information reports of business strategy for investment. Technology data analysis.
00:25
HD
Business people, computer screen and statistics graphs with teamwork for financial growth, investment or charts. Women, man and discussion for data analytics or market research, revenue or review
00:12
HD
Stock market candlestick chart hologram on digital world map,global financial index analysis,business economy investment.Global market analysis world map with stock market graph overlay animation
00:15
HD
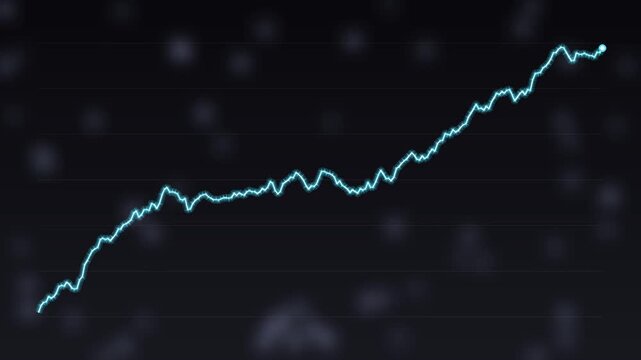
4K glowing cyan line chart drawing rising trend animation on dark background
00:05
HD
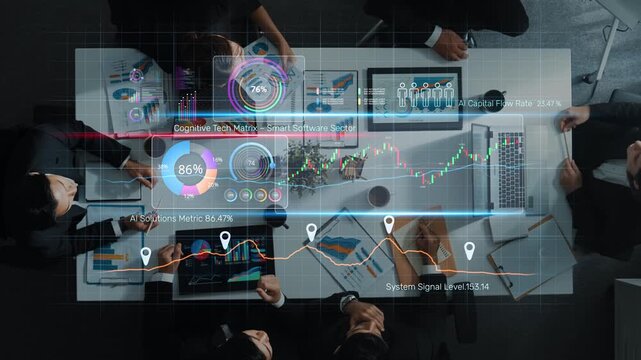
Explore a modern workspace showcasing advanced data analytics and cognitive technology with digital dashboards. Perfect for illustrating business strategy and innovation. Raster
00:20
HD
Communication network and statistics data concept.
00:20
HD
Teamwork, tablet and business people on computer with statistics for planning, collaboration and advice. Corporate, finance company and man and woman with research, graph and financial analysis
00:13
HD
The IT programmer opens the laptop screen with statistics displayed on the display in the form of graphs. A close-up of a laptop display with statistics opens in a dark room. High quality 4k footage
00:05
HD
Social Media 3 Million Views Counter Animation with Like Button and Viral Engagement UI
00:20
HD
Colorful human figures standing on circular infographic charts representing demographic statistics and population data
00:10
HD
200 Percent Growth Counter Animation from 0 to 200 with Up Arrow Indicator in 4K, Business Growth, Success Rate, Analytics and Progress Increase Motion Graphic, 200% Growth on Transparent Background.
00:07
HD
Financial stock market chart showing green rising arrows with digital trading data represented by and numbers on a dark grid screen
00:06
HD
Streams of binary code merging into an analytics panel with trend line, donut share and summary table
00:20
HD
Top Down View Corporate Office With Multiethnic Workers at Computer Stations as Linked Visualization Layer Appears, Glowing Blue AI Icons, Cybersecurity, Connectivity and Workflow Automation.
00:10
HD
Couple budget planning on finance dashboard online. They review savings and monthly expenses on a computer at home using charts analytics for smarter choices. Clear concept of home finance teamwork
00:08
HD
Industrial worker using a tablet beside a monitor energy efficiency charts and factory data in a modern control room.
00:26
HD
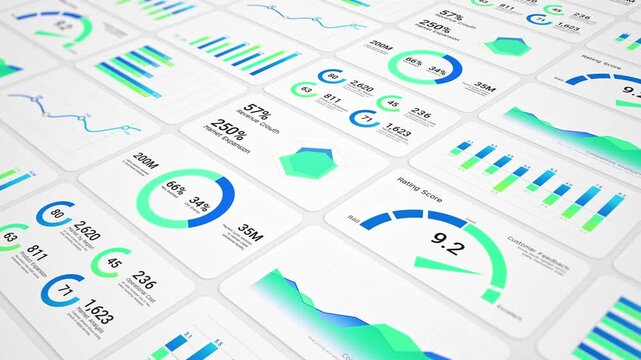
Animated business statistics infographic with blue data, graphs and diagrams on white background with copy space
00:15
HD
Activity Level Gauge Meter with Low Medium High Scale Indicator Animation
00:10
HD
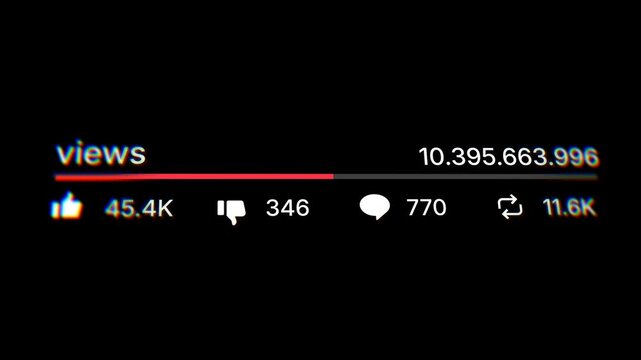
Animated Views Counter Increasing for Viral Social Media Content. Transparent background, 4K resolution
00:10
HD
Animated digital numbers, data or  financial figures in blue. Analyzing, market research, financial report.
00:12
HD
Presentation, TV and meeting with business people in office for strategy, statistics or workshop. Report, project management or teamwork with group of employees in boardroom for research on screen
00:12
HD
Reading, business woman and computer with digital market research analyst for work at company. Job statistics, glasses and tech of a professional at an office desk with admin report and screen graph
00:13
HD
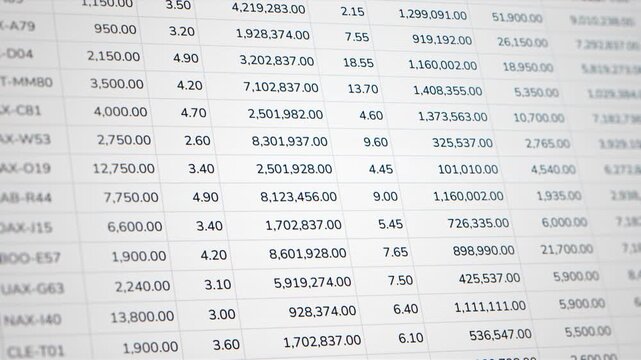
Closeup financial income table and accounting document, business sale revenue data analysis spreadsheet, trading company investment profit statistic report, corporate stock market cost statement sheet
00:10
HD
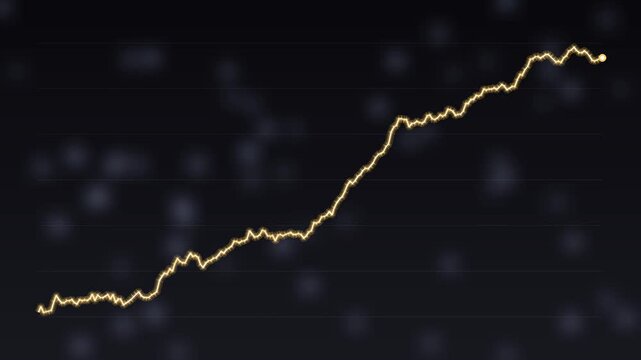
4K glowing gold line chart drawing rising trend animation on dark background
00:05
HD
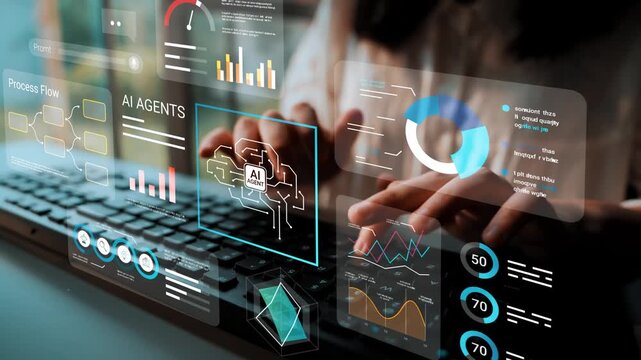
Futuristic Interface with Charts, Graphs, and AI Concepts Displayed on a Glass Screen While Someone Types on a Keyboard in a Modern Workspace Gluon.
00:10
HD
Business optimization technology concept featuring intelligent process improvement, enterprise efficiency management and digital performance enhancement.
00:14
HD
Blue arrow graph rising through digital bar chart during economic growth with dark background
00:05
HD
Blue animated business growth bar chart with rising trend line
00:10
HD
financial statistics graph rising prices in stock market and inflation rate
00:15
HD
Business Stats Market And Infographics On Computer Screen
Animation of a business and market data analysis and reports with infographics layout bar stats charts and diagrams on a computer screen
00:14
HD
crowd behaviors measuring social sampling statistics experiment population research of society
00:10
HD
Group of Asian businesspeople work together discuss plan idea with investment data profit sale statistics in business meeting in office. Financial generation z team brainstorm on e-Commerce project.
00:15
HD
Close-up of female hand with pen writing on paper, using calculator with laptop on desk. Business, finance, accounting and tax planning at home or office.
00:13
HD
Top Down View of Corporate Team Working Around Conference Table With Laptops and Documents as Linked Visualization Layer Appears, Glowing Ai Icons Represent Cloud Storage, Cybersecurity and Analytics.
00:12
HD
Layers upon layers of financial data float through the holographic network creating a complex and interconnected ecosystem.
00:10
HD
Data flow streams converging into a live analytics dashboard with radar chart, bar graphs and system load
00:16
HD
Abstract big data visualization with colorful data streams, binary code, analytics, machine learning, data processing, and digital network technology background.
00:15
HD
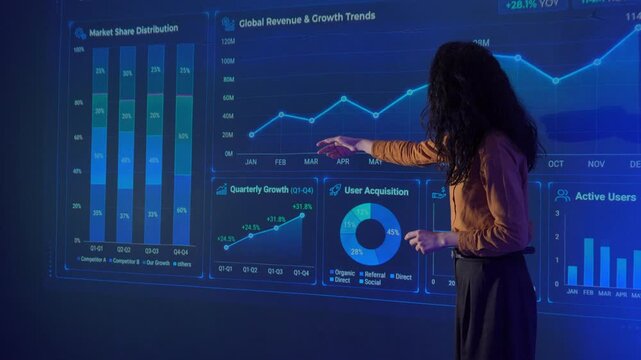
Businesswoman, question or screen for charts presentation or data analysis with hands up of growth graphs. Infographics, financial statistics or female speaker coaching on monitor ideas in meeting
00:09
HD
Business people, teamwork and planning on glass board for data analytics, brainstorming growth and statistics on tablet. Professional manager, mentor or woman with paper, solution or problem solving
00:09
HD
Futuristic cloud computing concept with illuminated data connections and digital network visualization
00:05
HD
Connection cyberspace technology by particle lines stream data. Neon strips rising upwards abstract background 3D video seamless loop
00:18
HD
Business people, computer screen and statistics review with teamwork for financial growth, investment or charts. Women, man and discussion for data analytics or market research, revenue or graphs
00:15
HD
Business intelligence and financial performance analysis report on white background, animated infographic bar chart, investment data analytic graph dashboard, success corporate market statistics trend
00:20
HD
Business people, data analysis with tablet and paperwork, hands with online review in meeting and team with market research. Statistics, analytics dashboard and digital infographic with collaboration
00:10
HD
A stunning depiction of a futuristic digital data interface overlaying Earth, showcasing various graphs and statistics to illustrate global data trends and analytics. Xenic
00:10
HD
Oil Industry Growth Visualization with Graphs and Icons
00:10
HD
Businesswoman analyzing company financial data and growth chart on a computer dashboard screen in the office
00:20
HD
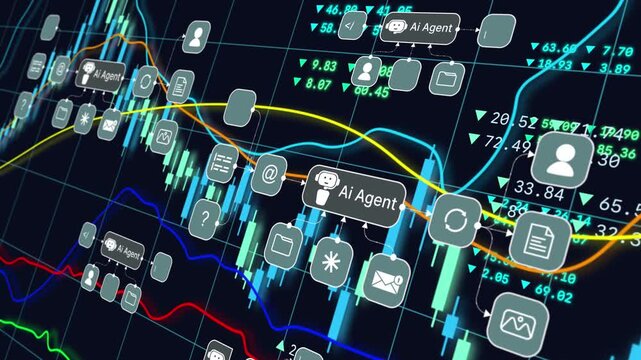
AI agent artificial intelligence stock market analysis smart trading strategy, financial investment, business growth portfolio, and futuristic automated economic concept
00:20
HD
Futuristic digital data flow with analytics interface. Abstract technology scene showing a futuristic digital environment with floating data and analytical elements in blue tones. Seamless loop 4k
00:15
HD
3D render: Abstract digital financial data charts background. Futuristic business analytics, market research, global network concept. Big data report, statistic visualization. Ideal for tech
00:20
HD
Communication network and statistics data concept.
00:20
HD
Accountant circling numbers in table on paper with pink marker closeup 4k movie slow motion
00:14
HD
Set of infographic and data visualization elements for statistic and financial reports. Analytical dashboard with charts and diagrams  on white background. 4K animation.
00:06
HD
Seamless looped abstract visualization of financial data, price fluctuations, investment analysis and trading activity. Financial market interface with changing charts. Forex trading concept
00:10
HD
Online survey questionnaire with digital feedback form, customer evaluation and business assessment concept. Filling form, research analytics, technology interface and data review.
00:12
HD
Financial chart on technology abstract background represent business growth and success concept. Investment graph analysis diagram trend infographic forex market economy statistic profit accounting.
00:07
HD
Close up of Digital Data Analysis Interface Display, Digital analytical display with graphs, data, and a world map blue background.
00:25
HD
Business growth rising arrow animation. Financial Growth business chart concept. green business growth arrow icon animation on black background.
00:06
HD
Businesswoman analyzing financial reports and accounting data, using a calculator and digital tablet for strategic planning and economic success in the modern office
00:11
HD
Hand placing a bar on a chart while displaying various types of graphical representations, concepts of data analysis, financial growth, and business strategy
00:17
HD
Stock Market monitor screen while open market for trading sell and buy stock online. Business economic and finance concept.
00:22
HD
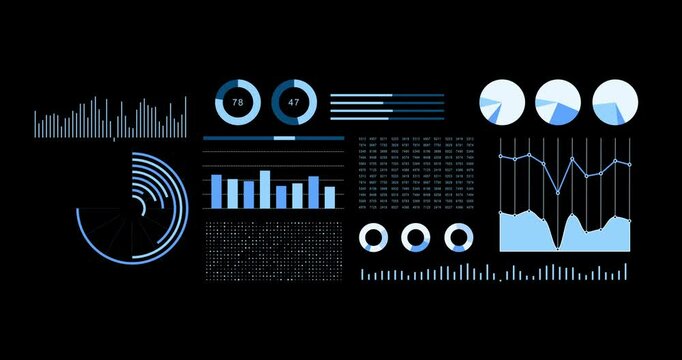
Animated business statistics infographic with blue data, graphs and diagrams on black background with copy space
00:15
HD
Business intelligence and financial performance analysis report on white background, animated infographic bar chart loop, investment data analytic graph dashboard, enterprise market statistics trend
00:14
HD
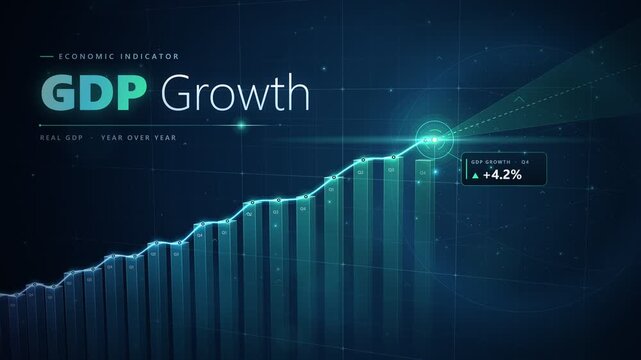
GDP growth economic indicator chart with rising bar graphs and HUD radar
00:15
HD
Top down aerial view of professional businessman analyze stock market chart with tablet with investment graph placed at table while investor group pointing at tablet. Creative business. Directorate.
00:16
HD
Smart city skyline of Chicago showing futuristic financial data, stock market infographics, business analytics, big data visualization over urban landscape
00:06
HD
Business colleagues collaborating on data analysis, reviewing financial charts and documents for strategic planning in the office
00:17
HD
A futuristic animation of a financial data chart showing market analysis and stock exchange statistics, ideal for fintech, investment, or corporate growth presentations.
00:10
HD
Business team meeting at office desk analyzing charts and financial reports, hands using calculator and tablet for planning and strategy.
00:13
HD
Top Down View of Businesswomen and Businessmen Meeting Around Office Desk With Laptops and Reports as Linked Visualization of Glowing Icons Statistics, Cybersecurity, SAAS and AI.
00:07
HD
AI agent artificial intelligence stock market analysis smart trading strategy, financial investment, business growth portfolio, and futuristic automated economic concept
00:20
HD
Dynamic business dashboard UI interface design vector illustration showing financial analytics charts and modern motion render graphics
00:10
HD
Declining bar chart with downward trend, Blue bar chart with falling line graph decline in business data, finance performance and analytics animation
00:07
HD
0 to 1000 Digital Counter Animation on Black Background | Number Counting Motion Graphics, zero to thousand countdown
00:10
HD
Businesswomen analyzing global market trends and revenue data during a corporate presentation, teamwork, data analytics, financial strategy, and technology-driven decision making in a modern office.
00:17
HD
Customer support technology with digital interface displaying analytics, statistics and communication icons. Businessman touching interactive screen for data management and network solutions in office
00:09
HD
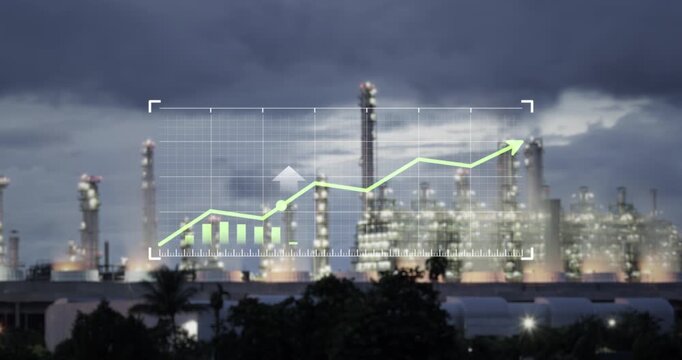
Financial chart overlays power plant and oil refinery, symbolizing global energy economic growth. Represent rising market prices, increased production and demand for petroleum and power generation.
00:18
HD
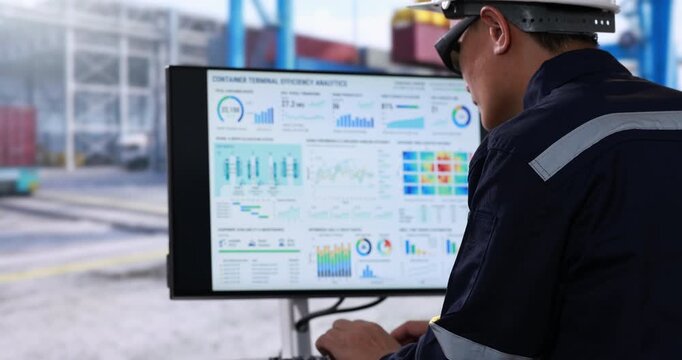
Industrial worker in hard hat and safety glasses reviews data dashboard on a computer monitor at a shipping container terminal.
00:19
HD
Social media notification bubbles rising with heart comment and follower icons on green screen chroma key background overlay
00:14
HD
Abstract big data visualization with colorful data streams, binary code, analytics, machine learning, data processing, and digital network technology background.
00:08
HD
Doctor, hands and screen of tablet in hospital for clinical data, health metrics and vital signs or patient demographics. Closeup, person and online for medical analysis and statistics for review.
00:05
HD
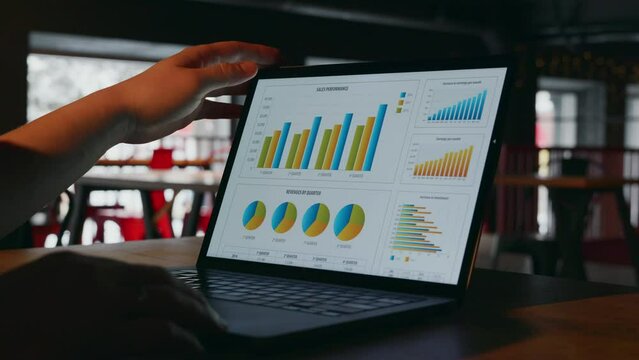
Digital tablet screen with graphs, charts, financial data, developments and data records. Panning shot.
00:12
HD
Smart city and communication network concept. 5G. LPWA (Low Power Wide Area). Wireless communication.
00:18
HD
Business intelligence and financial performance analysis report on white background, animated infographic bar chart loop, investment data analytic graph dashboard, enterprise market statistics trend
00:18
HD
Top down aerial view of professional businessman handed out financial statistic to analyst data investment graph. Group of diverse investors brainstorming and planning marketing strategy. Directorate.
00:16
HD
Statistics Data Analysis Business Chart Information on Computer desktop and Mobile phone isometric design animated concept 4K video
00:40
HD
Business colleagues review data on a tablet, discussing performance metrics, market trends, and strategic insights for informed decision making
00:19
HD
Trading team planning project in office. Pensive stock brokers analysing market
00:15
HD
Bar graph animation with dashed line. Bar graph blue upward trend on grid. Bar graph business statistics graphic on black background for performance tracking.
00:11
HD