Ein Link zum Festlegen deines Kennworts wurde gesendet an: Um in Zukunft auf deine Käufe zugreifen zu können, benötigst du ein Kennwort.
Kreativität ohne Ende – unbegrenzte Downloads plus leistungsstarke KI-Bearbeitung.
Neue Filter hinzugefügt
Sortieren nach

34.309 Ergebnisse für org chart in „Videos“

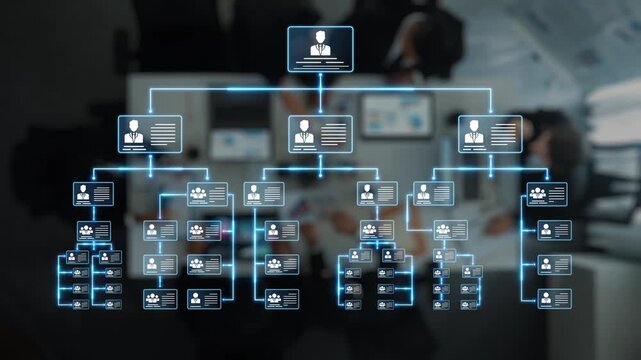
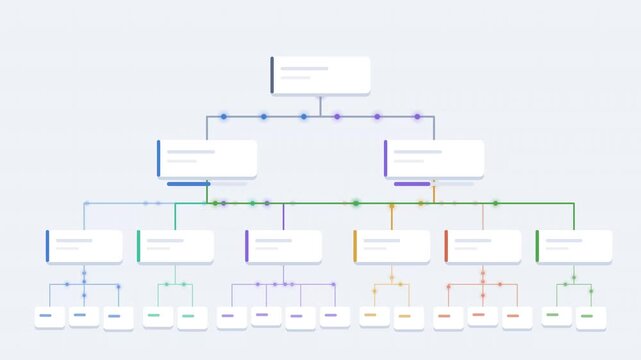
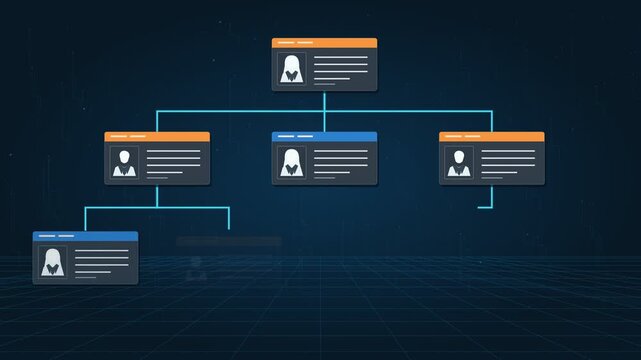
Corporate org chart and team structure show hierarchy, team, and structure for clear organization, management, and operational planning Marrow
00:10
HD
Futuristic project management dashboard display with glowing digital data charts and interactive financial analytics interface on a dark high tech background loop
00:15
HD
Business professional creating organization structure chart with team hierarchy and workflow planning, representing human resource management, corporate structure and leadership strategy for infograph
00:10
HD
Agentic ai multi agent collaboration workflow diagram with data input process analysis and auto optimize concept for future technology modern office
00:08
HD
Scheme hierarchy management of corporate. Digital technology of business process and workflow automation with flowchart and processing management.
00:13
HD
Blue AI chart generation from data table perspective view assembling
00:30
HD
Corporate Organization Chart With Growing HR Team
00:10
HD
Flat design corporate team alignment with profiles forming organizational chart
00:05
HD
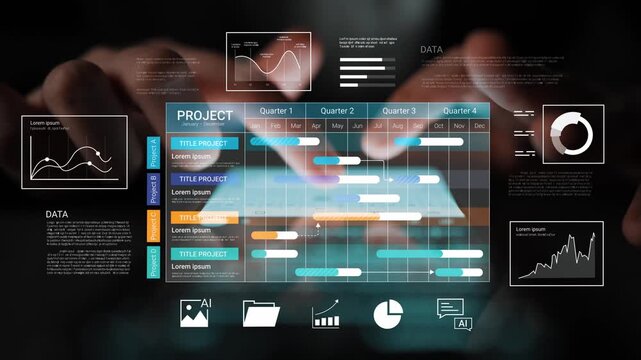
Digital project management interface featuring animated Gantt charts and task scheduling timelines.
00:11
HD
Planning and organization of time, calendar and dates. A finger moves across a standing calendar, showing planning and organization above printed charts beside a calculator. on a desk.
00:15
HD
Animated Horizontal Tree Diagram with Circular Branching Nodes
00:15
HD
Restructuring org chart where two of three teams merge into one as glowing people icons regroup
00:15
HD
White nurse at desk organizing patient forms, masked clinician flips through chart pages, stethoscope draped around neck, soft clinical lighting, closeup on hands and documents showing careful intake
00:13
HD
Abstract digital project management board with interactive task cards and notifications on a dark purple background
00:10
HD
Growing corporate organization chart animation with group of people icons. 4K Video
00:20
HD
corporate structure hierarchy business organization chart animation
00:29
HD
Organizational chart animation showing corporate hierarchy or business structure on black background 4k video animation
00:10
HD
woman analyst uses a computer AI artificial intelligence and dashboard for data business analysis and Data Management System with KPI and metrics connected to the database for technology finance,
00:10
HD
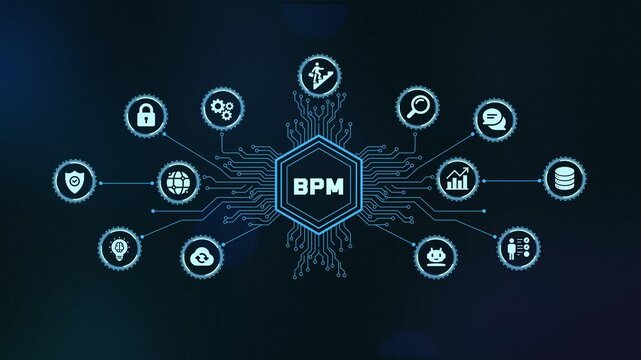
BPM business process management automation technology concept HUD interface with digital system icons
00:15
HD
Pink hierarchical tree network centered view
00:15
HD
An illustration representing a digital organizational chart set in a modern office, showcasing team structure and collaboration among business professionals for strategic planning. Raster
00:20
HD
Travel upward across technology background, progress, ambition, profit performance. finance corporate briefings, market analysis, career development, innovation, trading business presentations.
00:20
HD
business, women, collaboration, analysis, investment, finance, planning, strategy, marketing, meeting, professional, teamwork, corporate, office, accounting, brainstorming, data, report, chart, graph,
00:14
HD
Woman reviewing financial charts and reports at a desk with laptop, calculator and clipboard in a modern office.
00:20
HD
Overhead arc shot of office team analyzing financial graphs and documents during collaborative corporate meeting
00:12
HD
Organizational chart showing hierarchy and team structure with leadership levels
00:06
HD
Organizational hierarchy chart animation: business structure, team management, and strategic planning process
00:10
HD
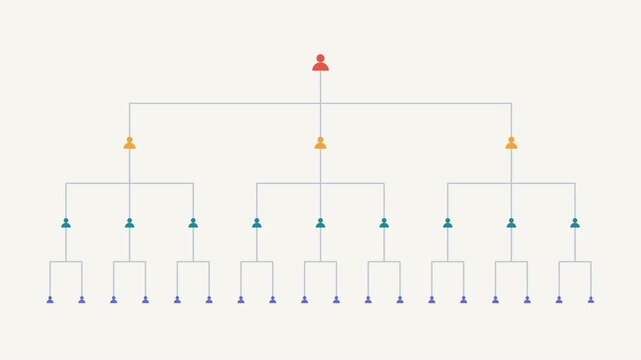
Corporate classic hierarchy org chart. Flat Design, Light Mode
00:10
HD
Organisation chart reorganising teams moving between directors animation loop flat vector animation loop
00:20
HD
Clean animated video of an AI robot hovering above a laptop with a rising data chart and bank building icon, representing banking systems, financial analytics, institutional data, and business automat
00:10
HD
Animated 4 step infographic process timeline design. 4K Video

00:10
HD
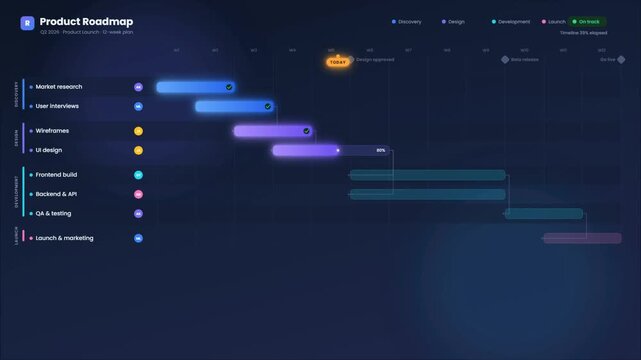
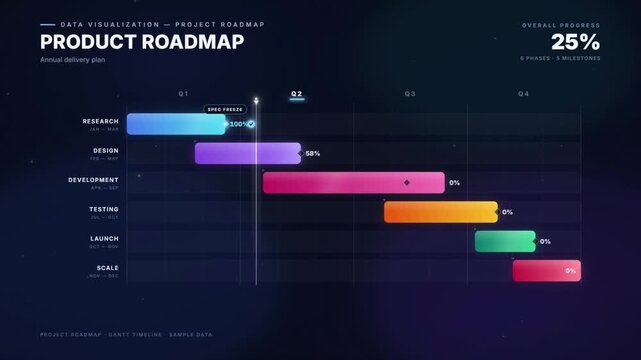
Product roadmap timeline with gantt chart bar and project phase schedule on a dashboard
00:12
HD
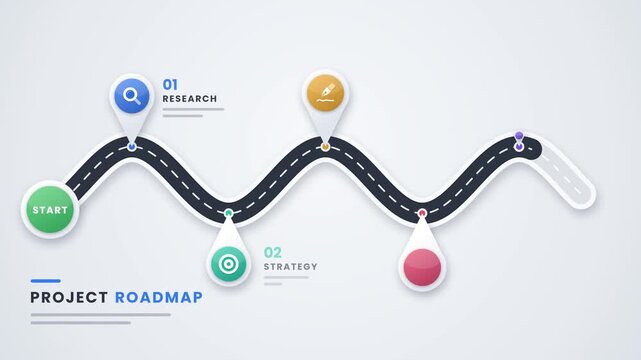
Five milestone roadmap infographic concept for project planning and showing business growth stages in a company timeline presentation animation
00:10
HD
Businesswoman in office reviewing printed reports at desk with charts on wall, coffee cup and calculator nearby, focused and calm during evening work.
00:14
HD
Corporate hierarchy organizational chart animation placing new employee profile into business company structure
00:10
HD
corporate hierarchy organization chart team structure animation
00:29
HD
Reports, tablet and charts across an office table as colleagues review graphs, point at figures and organize paperwork beside a digital annual report display for collaborative business analysis.
00:12
HD
woman analyst uses a computer AI artificial intelligence and dashboard for data business analysis and Data Management System with KPI and metrics connected to the database for technology finance,
00:10
HD
Professional man in a suit managing a complex project workflow by touching a futuristic virtual user interface with a glowing flowchart, demonstrating advanced business automation technology
00:09
HD
Human Resources Dashboard with Employee Analytics and Workforce Management Animation.
00:15
HD
Corporate org chart and team structure show hierarchy, team, and structure for clear organization, management, and operational planning Marrow
00:10
HD
4K motion graphic of Organization chart structure with transparent alpha channel transparency. 2D cartoon animation of Workplace hierarchy, company tree, isolated on white background.

00:08
HD
Group of confident business people point to graphs and charts to analyze market data, balance sheet, account, net profit to plan new sales strategies to increase production capacity.
00:17
HD
Business team reviews financial charts and reports at a desk, using a calculator, pen and tablet during a planning meeting.
00:14
HD
Neon Pyramid Hierarchy Diagram Animation on Black Background, Business Strategy Levels, Organizational Structure, 4K Motion Graphics
00:10
HD
futuristic interactive screen with digital data infographic project management dashboard display charts and interactive financial analytics interface
00:20
HD
Workflow process optimization interface displaying business methodology layout and corporate data analytics.
00:14
HD
Corporate circular hub org chart. Flat Design, Light Mode
00:10
HD
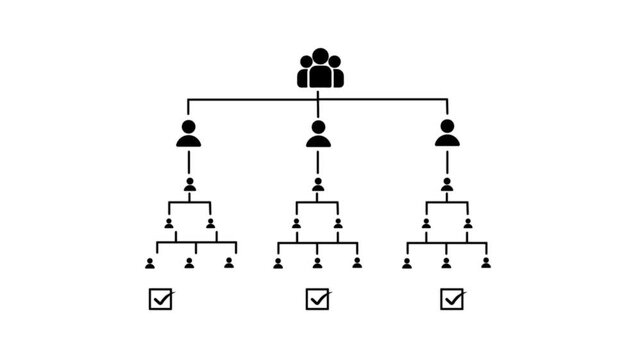
Decision tree flowchart animation with check and cross marks for business strategy and problem solving
00:10
HD
Two women review financial charts and documents at a wooden desk with a calculator, laptop and pens in a bright office.
00:14
HD
Org Chart Hierarchy Tree Diagram Growing From Root With Nodes Lighting In Sequence, Seamless Loop in bright emerald tones
00:10
HD
Team organization chart expanding downward through four levels of connected group icons
00:15
HD
Centered top-down beauty frame of corporate structure flowchart
00:06
HD
Leader digital interface with business icons and world map leadership strategy
00:11
HD
Abstract Gantt chart project management dashboard showing task schedules, progress bars and monthly timelines on digital background, illustrating workflow planning and project tracking.
00:12
HD
Organization chart structure drawing animated icon loop
00:06
HD
Close-up of a businessman in a blue suit using a calculator beside financial reports and charts on a desk.
00:18
HD
Business hands creating project financial charts and data mind map with colorful sticky notes
00:15
HD
Span of Control Organization Chart With One Manager and Eight Direct Reports for HR and Org Design Teams
00:10
HD
Cost management concept with businessman holding performance gauge, showing financial planning, data analysis, and strategy to reduce expenses and improve company efficiency, 4k video clip
00:12
HD
Explore a dynamic interface showcasing business analytics, data visualization tools, and interactive charts for effective decision making and strategic planning. Cipher
00:10
HD
Corporate Organization Chart and Business Management Network Animation Featuring Connected Department Icons and Central Gear Symbol for Professional Collaboration Concept
00:10
HD
Group of confident business people point to graphs and charts to analyze market data, balance sheet, account, net profit to plan new sales strategies to increase production capacity.
00:11
HD
Close view of business professionals reviewing printed financial charts and reports at a white desk, using pens and a calculator during a meeting.
00:02
HD
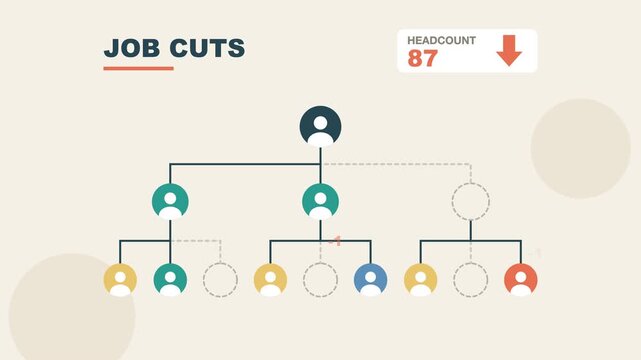
Company org chart loses positions as headcount drops flat vector
00:10
HD
Animated enterprise org chart showing hierarchical company structure, executive leadership and department expansion
00:12
HD
Corporate documentation process template with file reporting icons, data organization, security, and administrative compliance.
00:13
HD
Human resources demographic pyramid and team synergy infographics animation. Warm geometric vector shapes representing workforce management, talent acquisition, and corporate culture metrics.
00:10
HD
Organization and documentation, administration and analysis of a report. Hands turn pages of a thick report, showing organization and analysis beside a mouse and keyboard at a desk.
00:13
HD
Corporate dept columns org chart. Flat Design, Light Mode
00:10
HD
3d rendering of a loop motion graphic social media concept isolated animation
00:20
HD
Five step process infographic with animated connecting lines and options presentation template
00:05
HD
Corporate organization chart with employee hierarchy on dark background. 4K Video
00:10
HD
Abstract digital hierarchical network structure showing data flow and organization with blue glowing nodes on a dark futuristic background
00:10
HD
Scheme hierarchy management of corporate.	Organizational chart company hierarchy,roles,team structure,showing connections between managers, employees,and departments for clear communication workflow.
00:10
HD
Advanced data analytics dashboard display. Business and financial investment. HUD infographic of financial. Information reports of business strategy for investment. Technology data analysis.
00:25
HD
Future LCD Panel
00:18
HD
Corporate Agenda Running Order Schedule Motion Graphics Template
00:15
HD
Budget planning concept, company budget allocation for business or project management. Corporate finance and annual strategic plan.
00:15
HD
Business professional reviews financial charts and data to develop insights and strategies during a work session in an office
00:10
HD
Interactive Data Visualization Dashboard with Project Management Metrics and Analytics for Business Review and Planning in Modern Office Environment Gluon.
00:10
HD
Futuristic blue circular hud interface with recruitment text in center, surrounded by business and technology icons on dark background, digital dashboard concept for hiring and hr.
00:11
HD
Group of confident business people point to graphs and charts to analyze market data, balance sheet, account, net profit to plan new sales strategies to increase production capacity.
00:11
HD
Close view of business professionals reviewing printed financial charts and reports at a white desk, using pens and a calculator during a meeting.
00:04
HD
Faceless senior executives early morning boardroom meeting, silhouettes soft sunrise light glass windows, blurred city skyline close-ups of hands pointing financial charts tablets, reflective glass
00:05
HD
Business professional presenting a business strategy roadmap on a computer screen while reviewing charts and performance reports for company growth.
00:18
HD
Consolidation Process Diagram Representing Unified Business Systems Structure, Resource Integration, Workflow Efficiency, and Centralized Operational Management Strategy.
00:12
HD
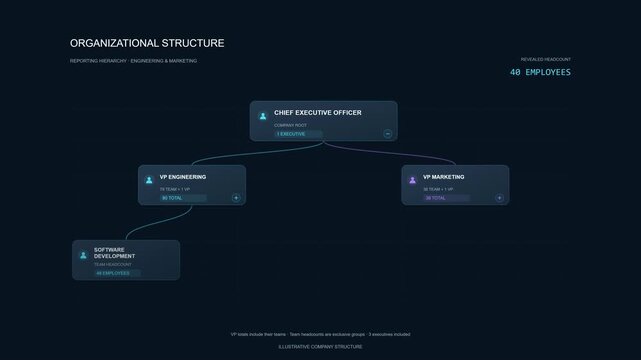
Digital organizational chart with glowing connections and icons
00:08
HD
A glowing neon diagram on a dark background illustrating a network of interconnected people and nodes.
00:08
HD
Flow chart, industrial process. Chart with elements, connected lines, and geometric shapes. Strategy, map, plan, chart, node tree, connecction in process. 3D animation
00:16
HD
Organizational Chart Sketches Zoom Out (Plain + Colors)
00:30
HD
Animated Gantt chart project roadmap timeline visualizing development phases and progress tracking
00:12
HD
PHP Programming Language Concept with Icons and Digital Network Background coding web development
00:10
HD
Cropped shot of hands of unrecognizable woman drawing on detailed chart and colorful stickers with black marker on white desk in creative office space
00:08
HD
Hierarchy, Concept Illustration,  Man writing on transparent screen
00:10
HD
Project Manager Analyzing Gantt Chart
00:25
HD
Dynamic Work Organizational Chart enthusiastically discussing sales charts on presentation board. Can be used to represent organizational corruption bankruptcy..
00:10
HD
Professional using laptop with holographic task management checklist and analytics dashboard. Digital workflow interface displays completed tasks and performance charts for business productivity
00:09
HD
Female analysts use computers, artificial intelligence (AI), AI dashboards, document folder structuring, data scanning, digital document storage software, cloud computing, document management,
00:10
HD
In dimly lit trading floor at night, focused trader wearing glasses watches his PC monitor, tracking real-time exchange rates price swings. Numbers flash across his lenses as he concentrates finance
00:11
HD