Ein Link zum Festlegen deines Kennworts wurde gesendet an: Um in Zukunft auf deine Käufe zugreifen zu können, benötigst du ein Kennwort.
Kreativität ohne Ende – unbegrenzte Downloads plus leistungsstarke KI-Bearbeitung.
Neue Filter hinzugefügt
Sortieren nach

19.768 Ergebnisse für increase and decrease in „Videos“

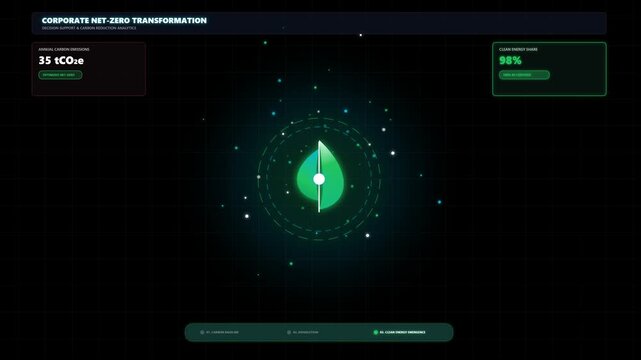
Corporate Net Zero Transformation: Footprint Reduction Animation, CO2 Emission Data Visualization
00:06
HD
?Adjusting the thermostat: a hand setting room temperature from 72°f to 68°f
00:06
HD
triangular progression representing data growth and decline over a graph, visualized to highlight change across a timeline or value axis with alpha channel
00:07
HD
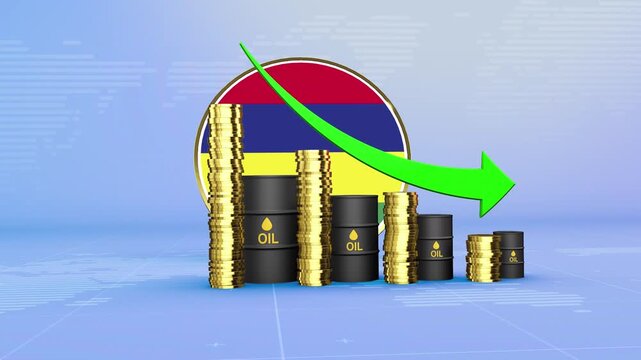
Mauritius Oil Prices Decline with Oil Barrels, Gold Coins and Downward Green Arrow, 3D Economic and Financial Market Concept
00:11
HD
Business growth concept in graph chart showing marketing sales profit increasing to future target . growing business concept. animation
00:10
HD
Pricing adjustment process involves calculating costs, managing finances, and setting competitive prices to optimize business performance using financial data and strategic analysis
00:17
HD
Modern electronic screen displaying successful slump metrics with decreasing charts for investment trading and risk presentations
00:15
HD
Libido Level Gauge Increasing and Decreasing Indicating Desire and Hormonal Response Animation
00:19
HD
Neon Celsius thermometer displayed temperature 44 degree. Digital Temperature Meter Display 44°C. That's indicates weather temperature 44 degree increase or decline.4k video.
00:10
HD
AI supports net zero goals via virtual assistant insights, AI-based green strategies, and artificial intelligence for climate-aware business planning. Kernel
00:12
HD
glowing neon line business graph growth arrow to down arrow. Financial business Loss down graph chart with red neon line, glowing red neon downward graph with arrow indicating decline, 4k video
00:10
HD
White geometric arrow shapes pointing up and down on black background
00:16
HD
Turkey Oil Price Falling with Oil Barrels Downward Green Arrow and 3D Financial Data Visualization Graphs for Economy and Business Concept
00:11
HD
Carbon Footprint Reduction and Tree Growth Cycle Motion Graphics
00:13
HD
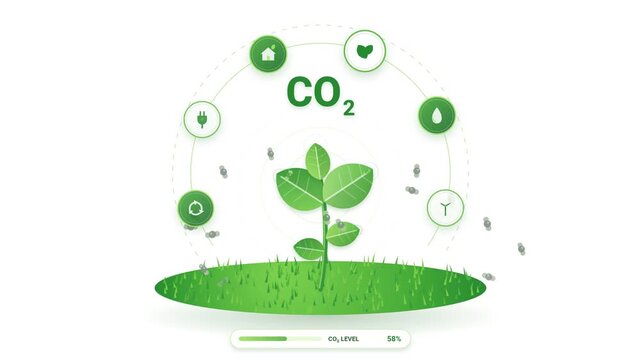
Green energy and carbon neutral concept, plant growing with eco icons and CO2 text, environmental sustainability concept
00:10
HD
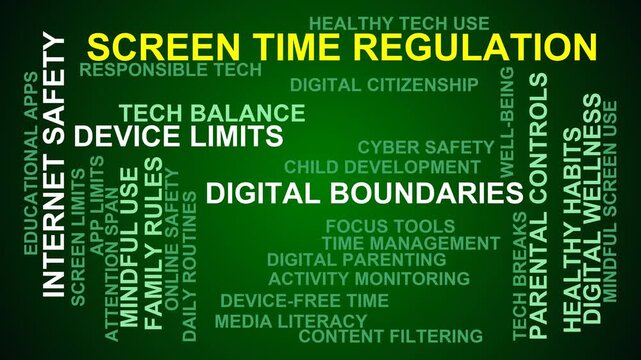
Screen Time Regulation Word Cloud
00:11
HD
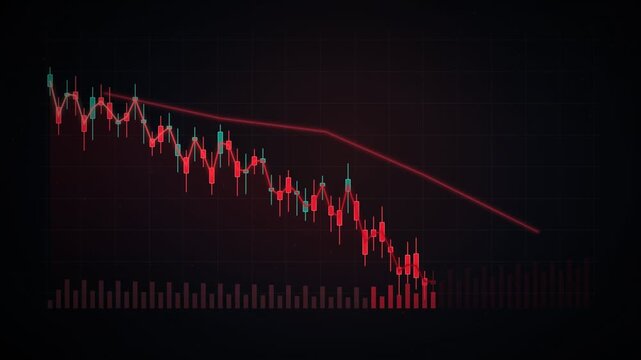
Stock market candles with falling prices of securities. Loss of assets in equities, showing a decreasing trend, poor performance, and financial losses due to economic crisis.
00:17
HD
Glowing neon line graph downwards against black background animation. Stock market losses and descending trading graph and downward arrows recession
00:10
HD
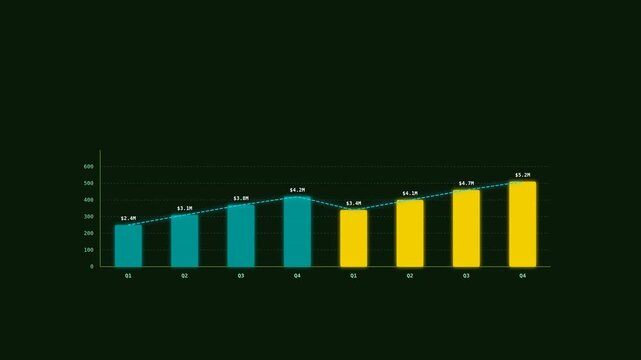
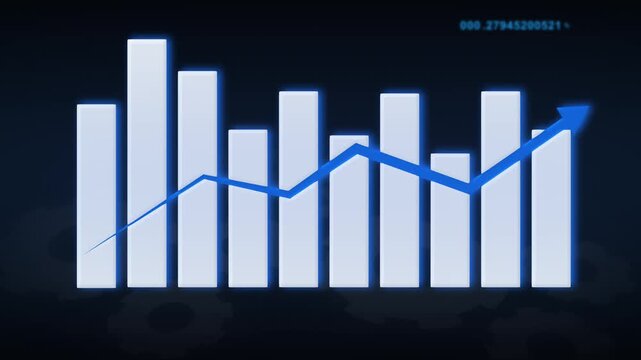
Motion of Bar Graphs Showing Data Trends in a Dynamic Video.

00:10
HD
coin money dollar cash value rise with arrows pointing up represent financial profit economic growth outline
00:05
HD
Corporate Success Animation Rising Arrow on Business Graph
00:10
HD
Down curve arrow animation, Falling prices concept arrow animation.Motion graphic 4k animation video.
00:06
HD
Chart Time Graph Icon Animation with Glowing Lines on Black Background
00:08
HD
Malaysia Oil Prices Decline with Oil Barrels, Gold Coins and Downward Green Arrow, 3D Economic and Financial Market Concept
00:11
HD
Stick figure pushing a large percentage symbol on a textured background finance
00:05
HD
Percentage allotments concept financial income distribution, tax planning, economy growth, and budget allocation with documents, money stacks, and a calculator
00:17
HD
Glowing Corporate Performance Growth Animation with Modern Business Statistics
00:09
HD
Dynamic minimalist icon illustrating a sharp downward trend, symbolizing financial decline, market instability, and decreasing performance metrics against a vibrant background
00:05
HD
Cryptocurrency trading. Bitcoin stock graphic. Bitcoin mining and Finance banking management concept, oil and Money trading, Digital trade platform. Profit and loss graph. Online trading
00:15
HD
A group of professionals engages in a dynamic discussion about environmental sustainability, focusing on the implementation of ESG objectives and strategies. Raster
00:20
HD
3D green Declining Bar Chart with Up Arrow for Representing Falling Sales, in 4K loop animation on White Background
00:09
HD
Bar chart animation shows a downward falling trend arrow on dark. Financial revenue loss reflects on this bar chart. Negative economic performance marks the chart.
00:12
HD
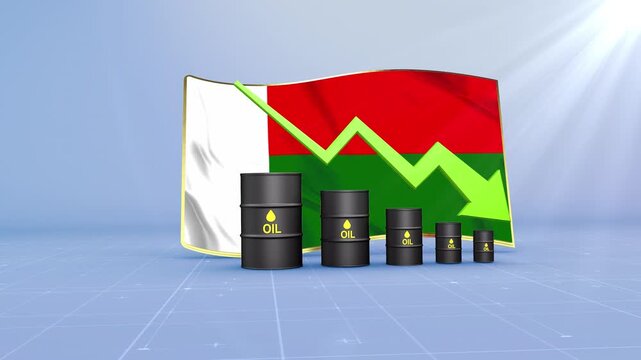
Madagascar Oil Price Falling with Oil Barrels Downward Green Arrow and 3D Financial Data Visualization Graphs for Economy and Business Concept
00:11
HD
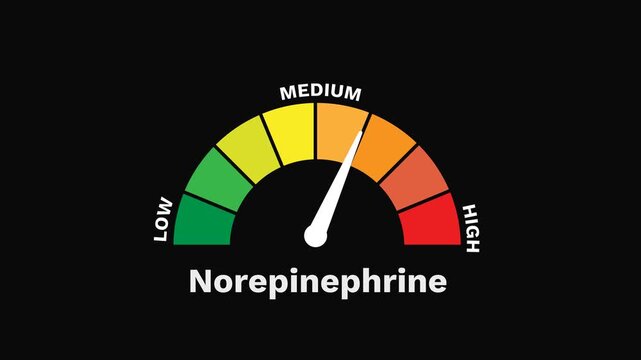
Norepinephrine Level Gauge Increasing and Decreasing, Alertness and Stress Response 2D Motion Graphic
00:19
HD
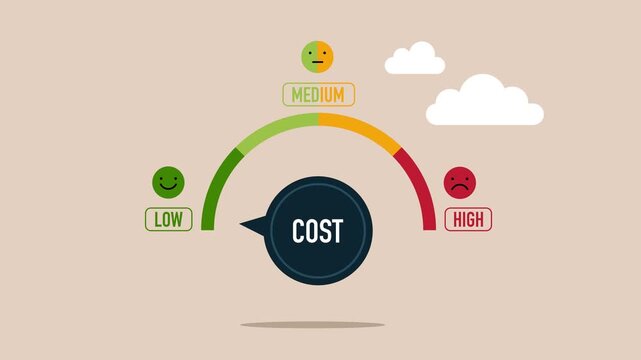
Turning cost dial to a low. Cost cutting and efficiency concept. Business 2d animation video
00:07
HD
animation of a bar chart showing a downward trend over months
00:15
HD
Businessman presenting bar graph on whiteboard business presentation
00:12
HD
Dynamic teal arrow soaring down with a smooth curve, representing forward momentum, achievement, and positive financial trends. A neon down business graph icon graphic concept. animation
00:06
HD
As focal length decreases, autumn leaves and round seed clusters hang against dark green foliage.
00:15
HD
Financial market chart shows price movements with multiple trend lines and data points during trading hours.
00:10
HD
Business growth concept in graph chart showing marketing sales profit increasing to future target . growing business concept. Clean Hi-tech style technology chart
00:10
HD
Download free with trialBusiness efficiency concept on black background. how much a company or organization can produce as it relates to time, cost and quality.
00:15
HD
business graph chart and success ndicating profit profit and loss business plan
00:10
HD
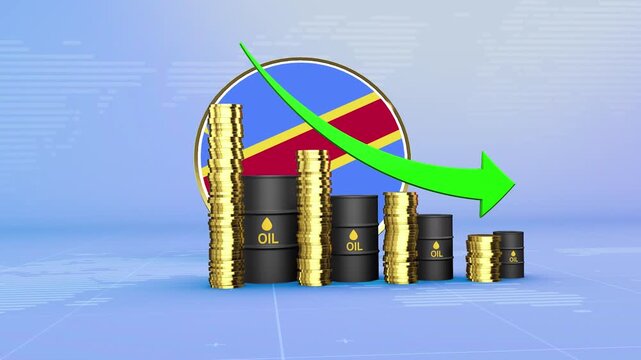
Democratic Republic of the Congo Oil Prices Decline with Oil Barrels, Gold Coins and Downward Green Arrow, 3D Economic and Financial Market Concept
00:11
HD
White fluffy mycelium threads fill a mold around a small object, creating soft packaging that later breaks down into dark soil
00:15
HD
Per unit pricing agreements abstract concept outlines managing costs. Calculating expenses. Negotiating terms. Monitoring inventory. Tracking delivery
00:17
HD
Professional Business Growth Chart Animation with KPI Analytics
00:09
HD
Colorful Bar Graph Animation Representing Financial Data Trends.
00:07
HD
Zoom in and out animation the paperclip symbol. Large black symbol in the center and four small symbols around. Seamless looped 4k animation on white background
00:12
HD
A businessman interacts with a smartphone while colorful neon arrows represent quality and cost factors, illustrating investment and economic strategies in a professional context. Qubit
00:11
HD
Price drop animation from 1299 to 849 with 35 percent sale discount
00:10
HD
Dynamic output level meter gauge animation with glowing blue indicator light moving across color-coded sections from low and normal to performance on a clean isolated black background
00:10
HD
Afghanistan Crude Oil Price Drop with Oil Barrels Downward Green Arrow and 3D Financial Data Visualization Graphs for Economy and Business Concept
00:11
HD
Business Graph Crash Down with Red Arrow, Falling Market Motion Graphic.  down business arrow
00:10
HD
Animated green revolution progress bar illustrating carbon dioxide co2 emission reduction targets and climate change mitigation goals from the year 2026 to the future milestone of 2050 sustainability
00:10
HD
Blue down and pink up neon arrows glowing on a black background
00:08
HD
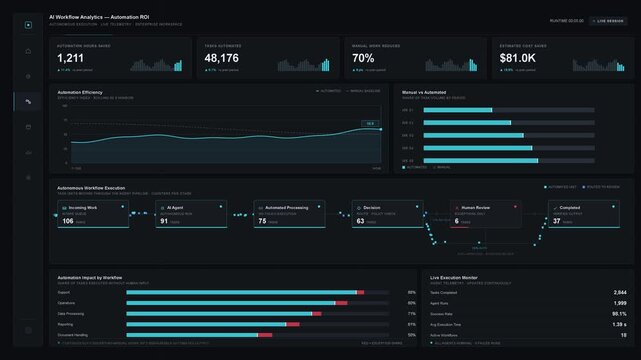
A dark-mode business dashboard illustrating the measurable impact of AI workflows with automation metrics and efficiency charts for business professionals.
00:15
HD
Red bar chart showing a downward trend with a glowing arrow on a dark background
00:12
HD
Red Declining Bar Chart and Downward Arrow on Grid Background
00:10
HD
Line graph showing monthly data spikes. Business line graph for corporate performance analysis. Digital line graph animation for financial reporting.
00:08
HD
Small red percent symbol button centered on warm gradient
00:05
HD
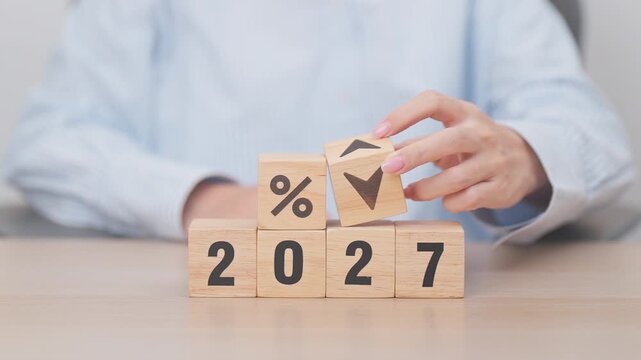
2027 New year with change to UP and Down arrow. Interest rate, GDP, stocks market, financial, deflation and Inflation, mortgage, debt, Loan and Economic Recession
00:09
HD
Businessman analyzing profit and quality management concepts long term cost planning, product quality, budgeting, financial forecasting, and company revenue and expense projections.4k video
00:10
HD
Dominican Republic Oil Prices Decline with Oil Barrels, Gold Coins and Downward Green Arrow, 3D Economic and Financial Market Concept
00:11
HD
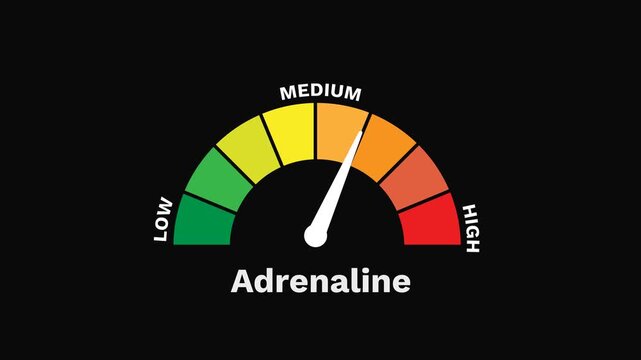
Adrenaline Level Gauge Increasing and Decreasing Indicating Excitement, Tension, Anxiety, and Emotional Response 2D Motion Graphic
00:19
HD
Product pricing operations reflecting competitive price strategy, discount calculations, sale promotion, and online e commerce management on a white background
00:17
HD
Corporate Revenue Growth Dashboard Animation with Positive Trend Visualization
00:13
HD
Calculator App Icon with Changing Numbers on Green Screen
00:07
HD
Plummet Business Growth Infographics With Arrow 2d Animation with Alpha Matte
00:16
HD
Projection of Carbon Neutral Goals with Business Strategy and Environmental Impact Charting Sustainable Growth in Corporate Meetings Sigmoid
00:20
HD
Minimalist white circles expanding and contracting on a black background with subtle zoom effect
00:11
HD
Minimalist downward trend arrow line motion abstract visual stock symbol financial decline data analytics
00:10
HD
Taiwan Oil Price Falling with Oil Barrels Downward Green Arrow and 3D Financial Data Visualization Graphs for Economy and Business Concept
00:11
HD
Business Bar Chart Showing Financial Loss with Downward Red Arrow on Green Screen Chroma Key Background
00:12
HD
Business optimization concept. increasing efficiency, and speed while reducing costs
00:08
HD
Animated progress bar with percentage counter pink on black background, animation loading
00:10
HD
simple green random shape graph rising up down value sliced shape background blue background screen animation stock video footage
00:20
HD
Animated Green Up and Down Arrows Direction Icons on Black Background
00:10
HD
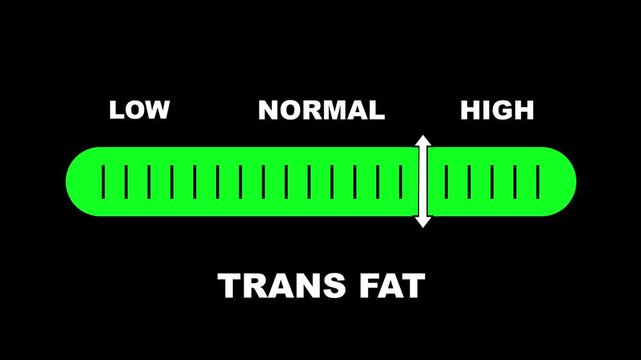
Trans fat level indicator scale. Low normal & high meter infographic animation on black background. Showing high trans fat level color gauge indicator for nutrition and heart health monitoring.
00:10
HD
Digital trend line chart tracks positive corporate growth paths. Technical trend line chart monitors stock market trading performance. Business data analytics with a trend line chart.
00:08
HD
Balance amount decreasing from 10000 to 0 dollars on black background.Decreasing Amount Animation.
00:10
HD
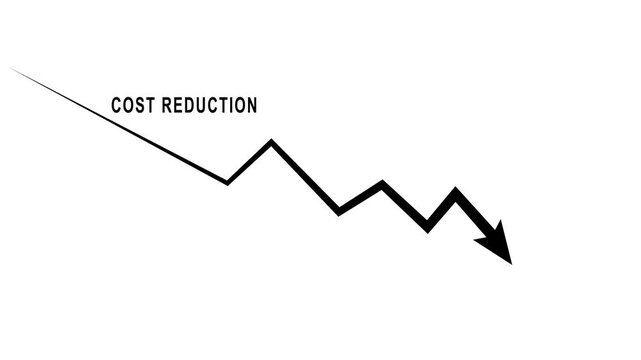
Cost reduction business finance concept. Businessman cost reduction icon with down arrow for budget management and cost management.4k video animation.
00:10
HD
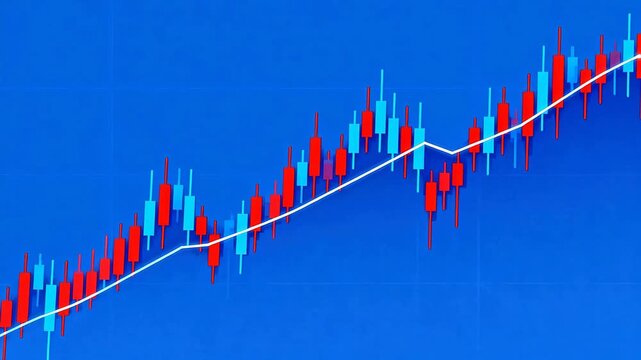
Stock market chart with trend line
00:05
HD
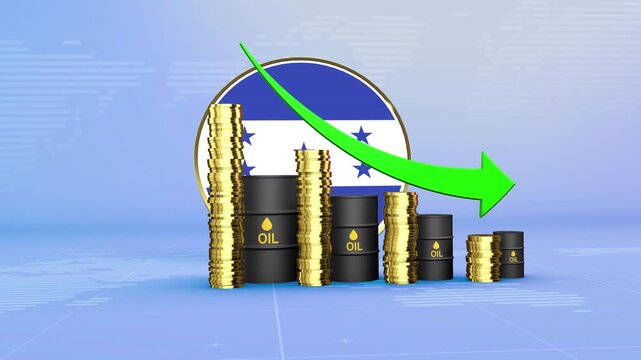
Honduras Oil Prices Decline with Oil Barrels, Gold Coins and Downward Green Arrow, 3D Economic and Financial Market Concept
00:11
HD
Cost reduction and cost saving through digital transformation, business cost and 2027 optimization, operational cost reduction, financial saving, and resource efficiency 4k video animation.
00:06
HD
Global community working to decrease poverty, fostering economic growth, and providing opportunities for people to improve their living standards
00:17
HD
Dynamic 3d Minimalist Volume Slider User Interface Animation
00:10
HD
Analysis of Real-Time Stock Market Data: Fluctuating Prices and Performance Metrics Displayed on a Digital Trading Platform
00:20
HD
business team discussion reusable product in office,start up eco-friendly business,environmental protection,sustainable business model,ESG strategy,sustainability,team meeting,ESG Report concept
00:14
HD
A man wearing a virtual reality headset engages with visual metrics representing cost and quality in a vibrant, neon-lit digital space, showcasing technology impact. Raster
00:15
HD
cholesterol level indicator scale. Low normal high meter infographic animation on black background. Showing high pressure level color gauge indicator.4k quality animation video
00:10
HD
Finger pressing green eco mode button at auto panel. Safety concept
00:07
HD
Rwanda Oil Price Falling with Oil Barrels Downward Green Arrow and 3D Financial Data Visualization Graphs for Economy and Business Concept
00:11
HD
Bright white 3D number 2004 text animation floating against a deep black void offering a vibrant and modern visual for the year with a sense of digital energy.
00:10
HD
Three-word text animation featuring Experience It Live with sequential word reveal, spacing reduction effect, and zoom transition in 3840x2160 format.
00:12
HD
Montenegro economic bar chart graph showing decreasing downturn with national Flag 3D animation on black background.
00:16
HD
Dynamic animated graph showing rising and falling stock market trends over time, financial data visualization, business growth charted, economic analysis
00:08
HD
Lean thinking concept. Cost reduction concept. Business process improvement. Maximising productivity and quality, reducing time and cost. Cost cutting, lean process for surviving the recession.
00:10
HD
Neon blue color GDP Growth Animation with Rising Arrow Graph   4k video
00:10
HD
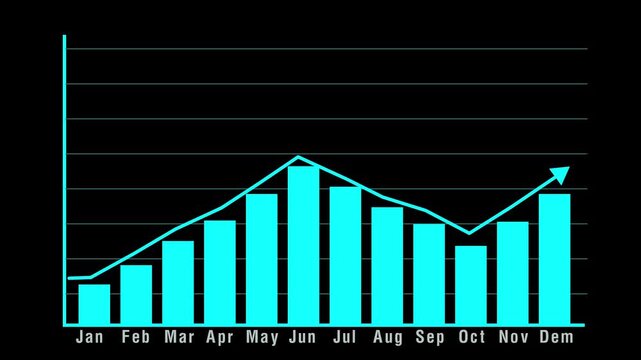
Cyan bar chart animation displays fluctuating market trend lines. Trading volatility analytics track on this cyan bar chart. Corporate economic investment revenue drives the bar chart.
00:10
HD