Ein Link zum Festlegen deines Kennworts wurde gesendet an: Um in Zukunft auf deine Käufe zugreifen zu können, benötigst du ein Kennwort.
Kreativität ohne Ende – unbegrenzte Downloads plus leistungsstarke KI-Bearbeitung.
Neue Filter hinzugefügt
Sortieren nach

19.768 Ergebnisse für increase and decrease in „Videos“

Neon Celsius thermometer displayed temperature 35 degree. Digital Temperature Meter Display 35°C. That's indicates weather temperature 35 degree increase or decline.4k video.
00:10
HD
Gold coin stacks as growth charts on dark background
00:10
HD
Animated White Signal Bars on Green Background - A dynamic graphic displays white signal strength bars on a vibrant green background.
00:08
HD
Animated interface icons with growth decline idea and alert symbols on white background
00:08
HD
Cost reduction business finance concept. Businessman cost reduction icon with down arrow for budget management and 4k Animation video on Black Background
00:10
HD
US dollar coin inflation rise and fall value financial animation.
00:06
HD
Bar Chart, Profit Down, financial decline trend line chart, Economic crisis, recession, inflation, decrease graph. Bar chart Profit down. Concept of economic crisis, recession, inflation.
00:10
HD
Hand-drawn financial line graph declining downward on white background, for business presentations arrow
00:10
HD
Cost reduction and cost saving through digital transformation, business cost and 2026 optimization, operational cost reduction, financial saving, and resource efficiency 4k video animation.
00:06
HD
Professional Business Growth Chart Animation with KPI Analytics
00:09
HD
A group of professionals collaborates in a meeting to discuss climate change solutions with visual data on CO2 impact and eco-friendly strategies for a sustainable future. Raster
00:20
HD
Three large digital numbers counting down on dark background with dark reflective surface close
00:05
HD
Abstract financial chart with falling bars downward market trend and low performance with grid and world map details animation
00:10
HD
Abstract glowing neon swipe arrow. 4k animation. Down to up neon line arrow direction animation. Neon line raising business arrow on black background.on black backgraund .HD video animation.
00:10
HD
Animated 3D Bar Chart Showing Decreasing Values for Data Analysis and Business Presentations.
00:05
HD
Clean Carbon Reduction Tracker Dashboard with Descending Emissions Steps and Green Energy Growth
00:05
HD
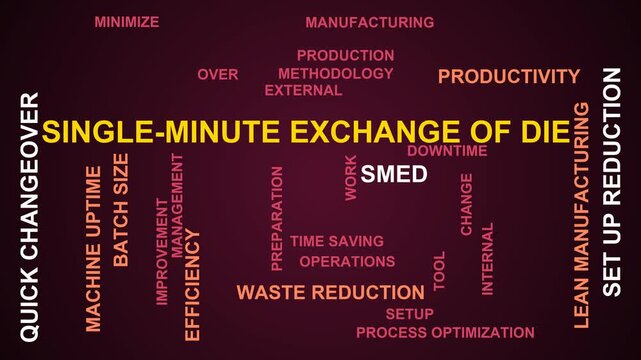
Single Minute Exchange Of Die Word Cloud
00:11
HD
Eco-friendly Green Footprint Vector Logo Design for Ecological Trail and Nature Conservation
00:08
HD
Financial Decline Graph with Percentage Symbol and Falling Data Blocks
00:10
HD
Performance objectives concept icon highlighting a range of business goals, from agile development and process optimization to achieving quality benchmarks and evaluating outcomes
00:17
HD
Line graphs animation displays fluctuating financial market data on dark. Corporate business revenue performance metrics update on line graphs. Investment drives graphs.
00:06
HD
Responsibility level indicator scale. Low normal & high meter infographic animation on black background. Showing high responsibility level color gauge indicator for accountability and performance.
00:10
HD
Red Downward Trend Graph on Green Screen Background
00:15
HD
Increase counting numbers 0 to 50k digital clock or timer display with decimal point.4k motion graphics video animation
00:10
HD
Futuristic dollar countdown timer animation, glowing dollar symbol integrated with a circular countdown display, numbers decreasing smoothly from 0 to 200
00:10
HD
Interest rate increase arrow animation.Financial, business, and statistical analysis.
00:10
HD
Blue Circular Progress Bars Growing With Percentage Indicators In Clean White Background
00:10
HD
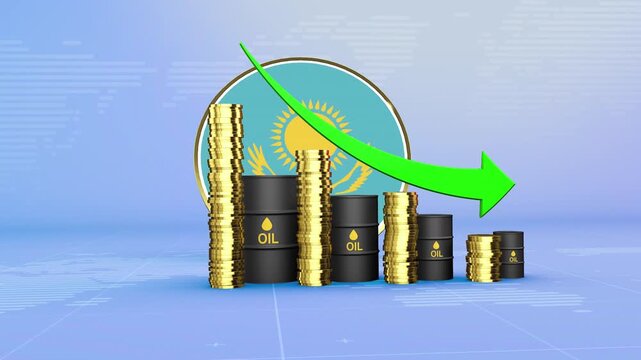
Kazakhstan Oil Prices Decline with Oil Barrels, Gold Coins and Downward Green Arrow, 3D Economic and Financial Market Concept
00:11
HD
Twenty percent animation with green neon arrows. Twenty percent digital data visualization. Twenty percent financial growth graphic on black background.
00:07
HD
Revenue and Profit Growth Animation for Corporate Business Reports
00:08
HD
Person Wearing Virtual Reality Headset Smiling with Digital Graph and AI Elements on Screen in Blue and Pink Background for Technology and Innovation Themes Sigmoid
00:15
HD
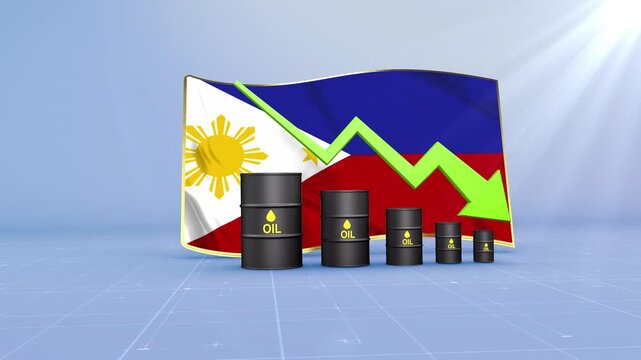
Philippines Oil Price Falling with Oil Barrels Downward Green Arrow and 3D Financial Data Visualization Graphs for Economy and Business Concept
00:11
HD
Abstract financial chart with falling bars downward market trend and low performance with grid and world map details animation
00:10
HD
Digital Slide Deck Presentation Animation Showing Revenue Growth User Increase and Cost Reduction Metrics
00:10
HD
focus level indicator scale. Low normal & high meter infographic animation. Showing high focus level color gauge indicator. on a white background 4k animation video
00:10
HD
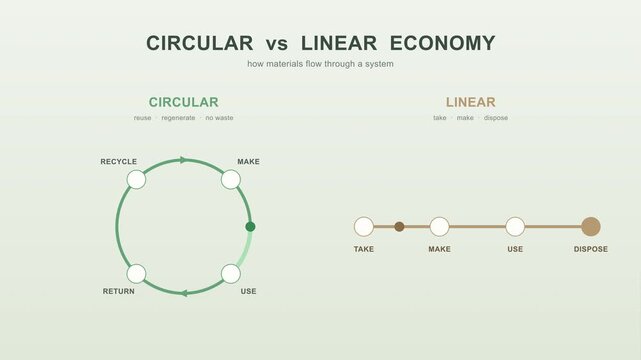
Circular vs linear economy diagram showing resource cycles, sustainability, and waste reduction concepts
00:08
HD
Discount percent signs moving on abstract background with dynamic curved lines
00:08
HD
Financial market downturn concept with declining stock chart, red downward arrow and digital data display representing investment loss, recession, economic crisis and trading risk
00:16
HD
Turquoise up and down arrows animation moves with glowing neon lines. Directional user navigation telemetry routes the arrows animation. Dynamic interface selection moves these up and down arrows.
00:08
HD
Lean production process diagram depicting manufacturing industry automation, smart factory managing product delivery, with efficiency and waste reduction
00:17
HD
Business growth concept in graph chart showing marketing sales profit increasing to future target on white background. business graph success animation 4k video
00:10
HD
Digital Light Intensity Slider HUD Monitor Interface
00:10
HD
Triglycerides level indicator scale. Low normal & high meter infographic animation on black background. Showing high triglycerides level color gauge indicator for blood health and cardiovascular.
00:10
HD
Lean thinking concept. Cost reduction concept. Business process improvement. Maximising productivity and quality, reducing time and cost. Cost cutting, lean process for surviving the recession.
00:10
HD
Commercial infographic animated 3D pyramid consisting of 6 blocks
00:07
HD
Blue fintech customer acquisition cost KPI dashboard card with currency value, decrease percentage and trend graph. Animated motion graphics component for marketing reports, startup analytics,
00:10
HD
Framed Volume Slider Animation from Zero to Maximum with Mute Control for Digital Audio Interfaces
00:08
HD
Malawi Oil Prices Decline with Oil Barrels, Gold Coins and Downward Green Arrow, 3D Economic and Financial Market Concept
00:11
HD
White line chart with moving trends on black background grid. Financial success graph for corporate business performance analysis. Animated bar graph report.
00:13
HD
Financial Growth Trend Animation with Positive Revenue Indicators
00:09
HD
A businessman engages with virtual reality technology to explore innovative strategies for reducing carbon dioxide emissions and promoting environmental sustainability. Raster
00:15
HD
business graph chart and success arrow indicating profit profit and loss business plan motion graphics.
00:10
HD
Bright white 3D number 2038 text animation floating against a deep black void offering a vibrant and modern visual for the year with a sense of digital energy.
00:10
HD
recovery rate level indicator scale. Low normal high meter infographic animation on black background. Showing high pressure level color gauge indicator.4k quality animation video
00:10
HD
graph chart up down business statistics
00:06
HD
Neon line Down business graph loss project. 4k Business graph. loss graph direction. damage business graph. down business graph icon. business or finance concept icon animation.
00:10
HD
3D Rendered Red Percent Symbol Isolated on a Clean Light Gray Background for Black Friday and Sales Promotions
00:05
HD
Financial market downturn concept with declining stock chart, red downward arrow and digital data display representing investment loss, recession, economic crisis and trading risk
00:16
HD
Dense green ground vegetation creating natural soil protection demonstrates moisture conservation, temperature reduction, and ecological support for healthy land environments.
00:12
HD
Illustration depicting an expenses reduction strategy, showing financial charts, budgeting for assets, and planning cost saving initiatives for business operations
00:17
HD
Israel Oil Price Falling with Oil Barrels Downward Green Arrow and 3D Financial Data Visualization Graphs for Economy and Business Concept
00:11
HD
Neon blue bar graph animation. Animated data technology business finance abstract background looping motion graphics modern digital presentation visuals financial growth success progress statistics.
00:12
HD
A simple line graph showing a downward trend with purple dots indicating data points on a black background, representing data analysis and decline.
00:08
HD
Lean thinking concept. Cost reduction concept. Business process improvement. Maximising productivity and quality, reducing time and cost. Cost cutting, lean process for surviving the recession.
00:10
HD
China economic bar chart graph showing decreasing downturn with national Flag 3D animation on black background.
00:16
HD
Neon Celsius thermometer displayed temperature 37 degree. Digital Temperature Meter Display 37°C. That's indicates weather temperature 37 degree increase or decline.4k video.
00:10
HD
Business growth concept animation, Business line arrow .Chart arrow still goes Down animation. Graph decreasing. Business animation. Economy concept. arrow down
00:10
HD
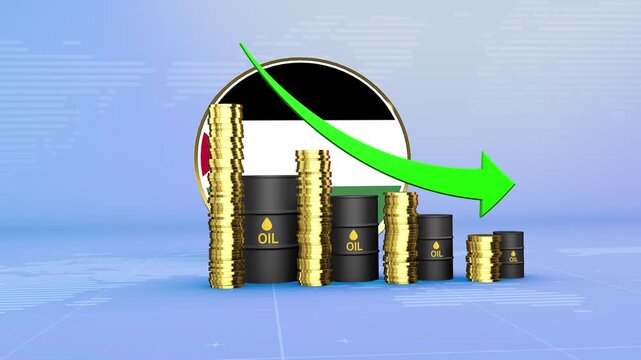
Palestine Oil Prices Decline with Oil Barrels, Gold Coins and Downward Green Arrow, 3D Economic and Financial Market Concept
00:11
HD
Stock market and exchange sector data, trading information, prices up and down.  Currency exchange rates ticker, volatile markets, making money, trading screen, growth, investment, risk, business.
00:10
HD
Revenue and Profit Growth Animation for Corporate Business Reports
00:08
HD
Mobile Network Signal Strength Animation
00:05
HD
Abstract organic shapes growing in size against a blue background with cinematic motion
00:05
HD
Threat Level Indicator Gauge Animation with Low, Normal and High Risk Scale for Safety and Security Monitoring
00:06
HD
Digital Business Stock Market Data and Growth Financial Trading Chart  Animation looping Seamless Motion Background. Business stock data concept
00:19
HD
Curved arrow pointing down and to the right with a flowing shape animation
00:06
HD
Hand Holding Air Conditioner Remote Control Rapidly Adjusting Temperature, Press and Hold and Tapping Buttons to Increase and Decrease AC Settings
00:33
HD
A diverse group of hands coming together to hold a graphic symbolizing cost reduction, featuring a downward trend and financial data in a global context. Raster
00:15
HD
Financial market downturn concept with declining stock chart, red downward arrow and digital data display representing investment loss, recession, economic crisis and trading risk
00:16
HD
4k .Cost reduction concept. Cost wording on decrease money with down arrow. Cost Management, Economy recession, low budget, Effective business,
00:10
HD
Financial operations with currency exchange and banking fees, optimizing capital for cost reduction and efficient money payments within global economic transactions
00:17
HD
Red Bar Chart Declining Trend Data Analysis Business Growth.
00:10
HD
2027 New year with percentage change to UP and Down arrow with coin stack. Interest rate, GDP, stocks market, financial, deflation and Inflation, mortgage, debt, Loan and Economic Recession
00:09
HD
Red Bar Graph with Downward Trend and White Arrow Showing a Rise chart
00:07
HD
Abstract decrease icon on green background. Reduce cost concept with dollar and down arrow animation.
00:10
HD
business graph icon. Business Loss Graph Symbol Minimal Design. Declining Bar Chart Icon with Downward Arrow
00:06
HD
Neon Celsius thermometer displayed temperature 32 degree. Digital Temperature Meter Display 32°C. That's indicates weather temperature 32 degree increase or decline.4k video.
00:10
HD
Animated neon blue financial downtrend line graph showing market decline and economic recession concept with glowing digital chart isolated on a deep black background, for presentations
00:10
HD
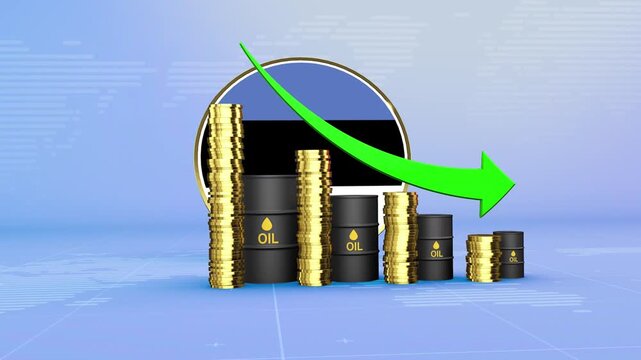
Estonia Oil Prices Decline with Oil Barrels, Gold Coins and Downward Green Arrow, 3D Economic and Financial Market Concept
00:11
HD
LGBTQ economic bar chart graph showing decreasing downturn with national Flag 3D animation on black background.
00:16
HD
Financial Growth Trend Animation with Positive Revenue Indicators
00:09
HD
Glowing neon line House under protection icon with up arrow isolated on black background. a glowing light drawing a neon outline of houses decreasing in size. House, home building. 4K
00:10
HD
Business crisis line chart animation with downward arrow loop on black background...
00:13
HD
Moldova Oil Price Falling with Oil Barrels Downward Green Arrow and 3D Financial Data Visualization Graphs for Economy and Business Concept
00:11
HD
Neon glowing medical thermometer icon animation. That's indicates weather temperature 34 degree increase or decline. Thermometer equipment showing hot or cold weather.
00:10
HD
Blue Neon Dollar Sign with Downward Arrows in Circle
00:10
HD
Zoom in and out animation the down arrow symbol. Large black symbol in the center and four small symbols around. Seamless looped 4k animation on white background
00:12
HD
AI supports net zero goals via virtual assistant insights, AI-based green strategies, and artificial intelligence for climate-aware business planning. Kernel
00:12
HD
Financial market downturn concept with declining stock chart, red downward arrow and digital data display representing investment loss, recession, economic crisis and trading risk
00:16
HD
Illuminating sustainability: An energy-efficient bulb amidst recycled materials
00:08
HD
Animated market analysis: Rising and falling crypto trade values depicted through dynamic blue and orange graph lines, showcasing profit gains and expense decreases.
00:16
HD