Ein Link zum Festlegen deines Kennworts wurde gesendet an: Um in Zukunft auf deine Käufe zugreifen zu können, benötigst du ein Kennwort.
Kreativität ohne Ende – unbegrenzte Downloads plus leistungsstarke KI-Bearbeitung.
Neue Filter hinzugefügt
Sortieren nach

801 Ergebnisse für comparative in „Videos“

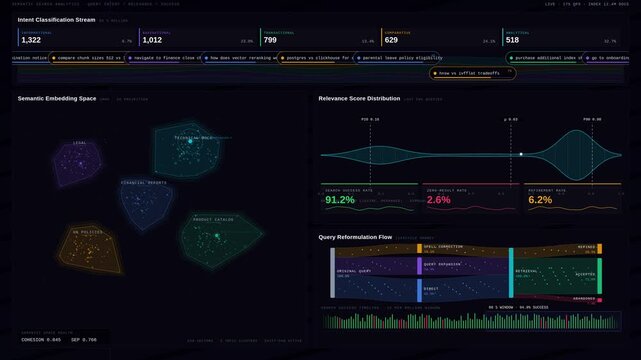
Cinematic 4K dark-mode semantic search analytics dashboard featuring real-time query intent classification, dynamic embedding space visualization, and relevance score distribution charts.
00:15
HD
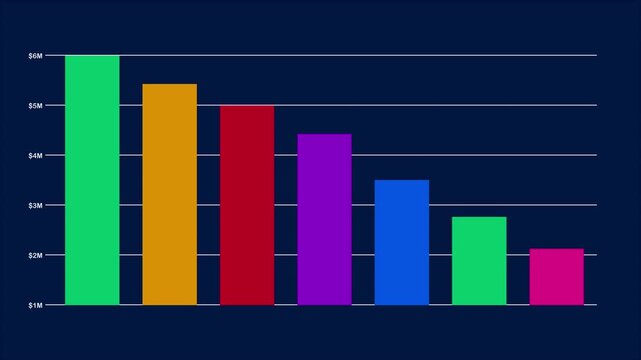
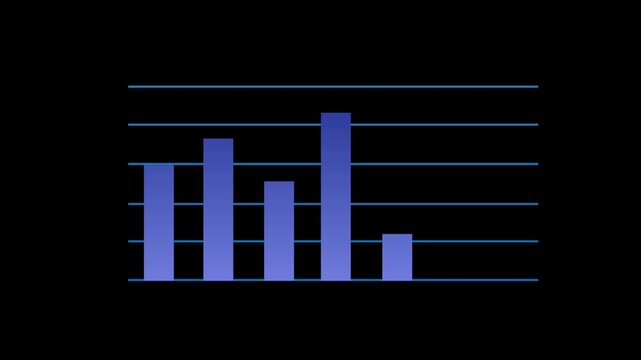
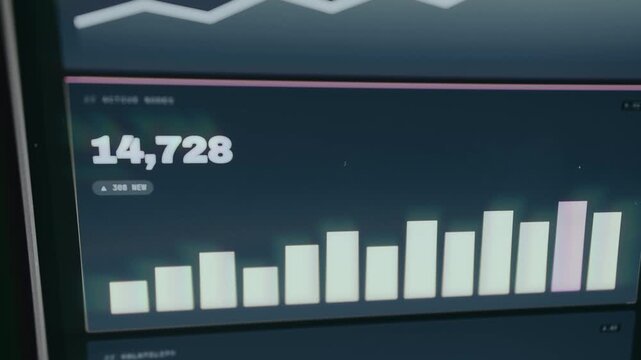
A horizontal bar chart on a dark background, effectively visualizing comparative data across different categories or periods, ideal for showcasing 'Key Metrics' or performance.
00:06
HD
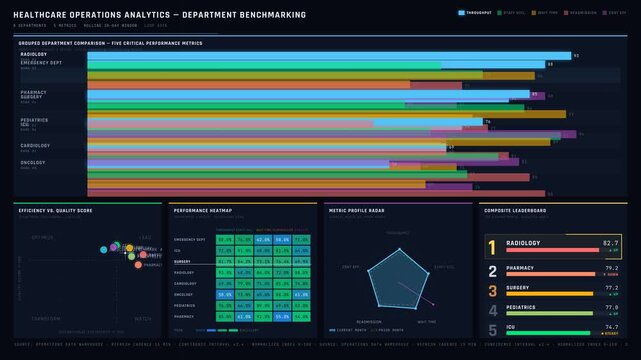
A sophisticated dark-mode healthcare operations analytics dashboard visualizes comparative performance metrics across hospital departments with clear data visualization and animations.
00:15
HD
Free Trade Word Cloud
00:11
HD
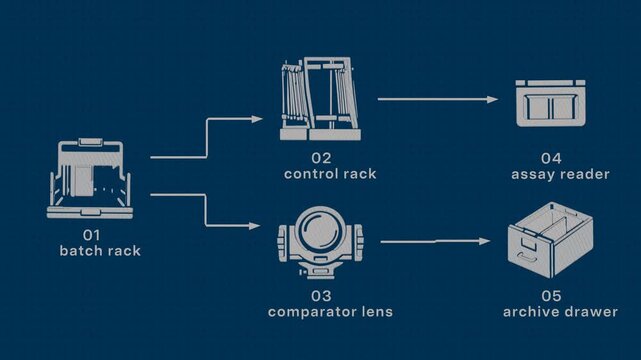
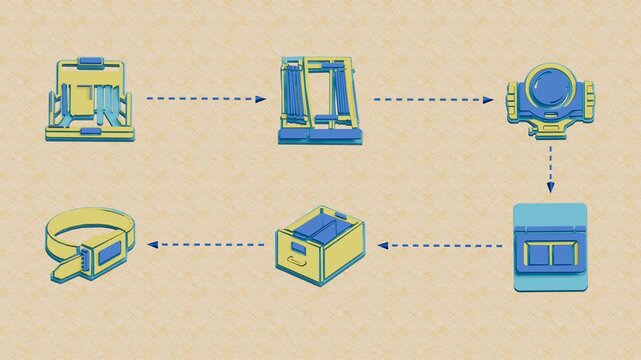
Batch and control racks undergo comparative assay readings before archival retention as a paired set, following a sequence that reverses direction in the second row. Flat 3D style drawn over in pen
00:08
HD
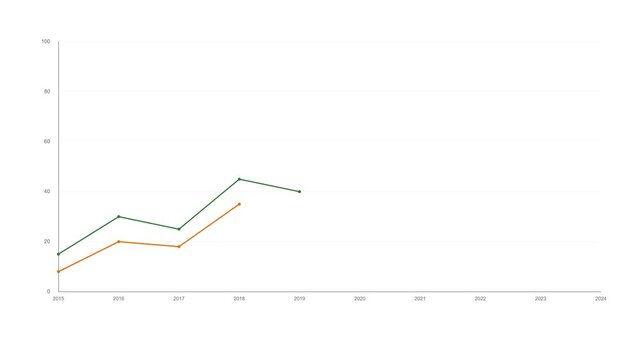
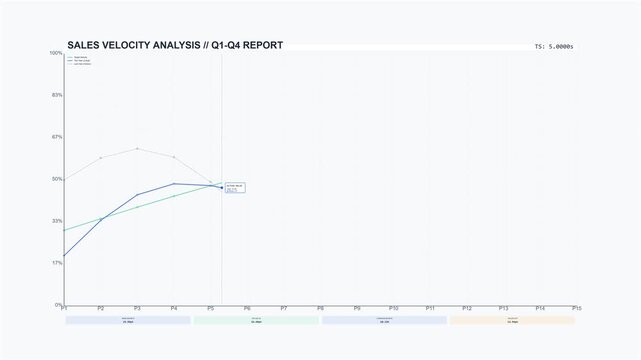
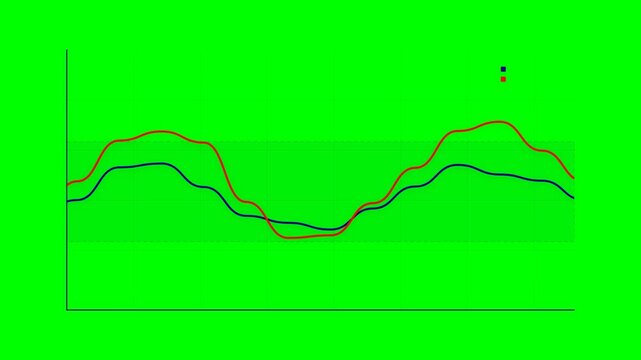
Comparative dual-line chart showing yearly financial value trends, business analytics style
00:15
HD
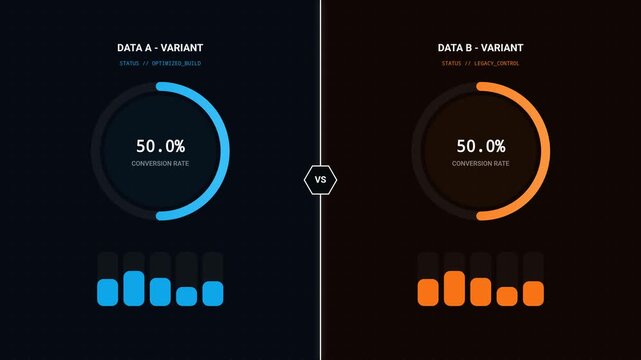
Split Screen A B Testing Infographic Animation with Circular Progress Rings and Inverse Comparative Bar Charts
00:10
HD
Split testing concept animation showcasing digital marketing analytics, website optimization metrics, and comparative data results on computer screen
00:11
HD
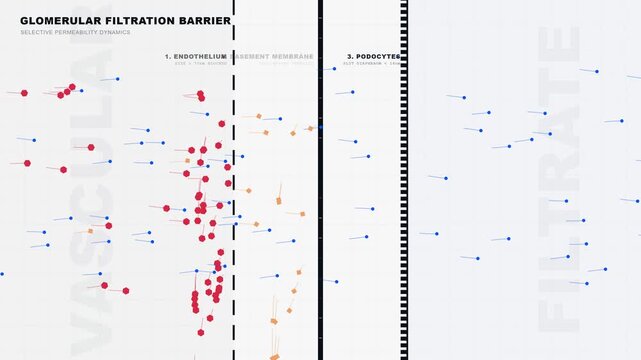
Glomerular Filtration Barrier Selectivity Showing Comparative Molecular Movement for Medical Education
00:10
HD
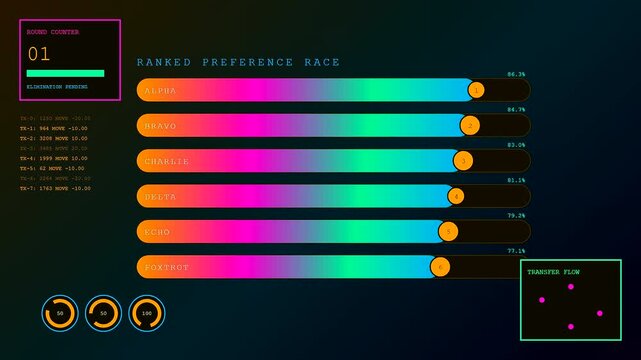
An interactive poll visual interface displays changing comparative bar graphs with numeric data metrics and glowing neon accents on a dark digital display grid screen
00:06
HD
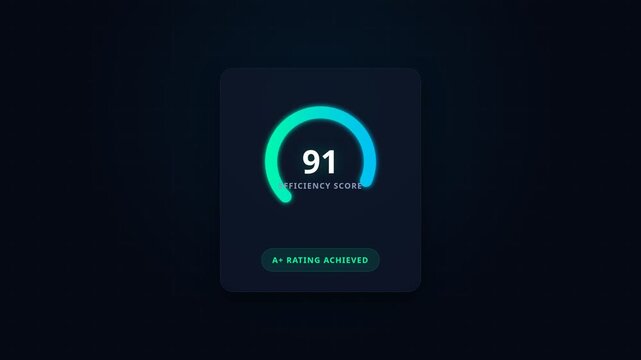
Digital energy efficiency score dashboard with high performance rating comparative building data, for sustainability analysis, smart infrastructure monitoring, eco-friendly technology
00:20
HD
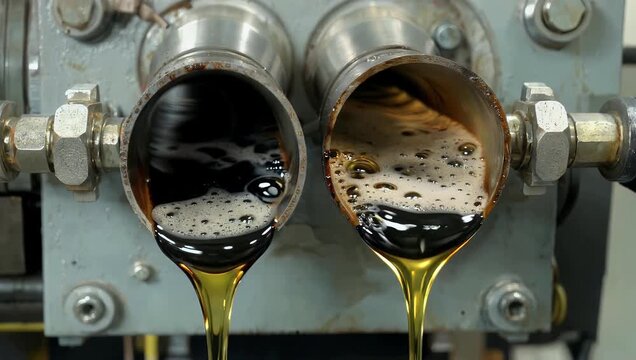
Educational 4K industrial laboratory video showcasing a stark side-by-side comparative analysis between fresh amber-colored engine oil and a dark degraded sample of heavily oxidized machinery fluid
00:10
HD
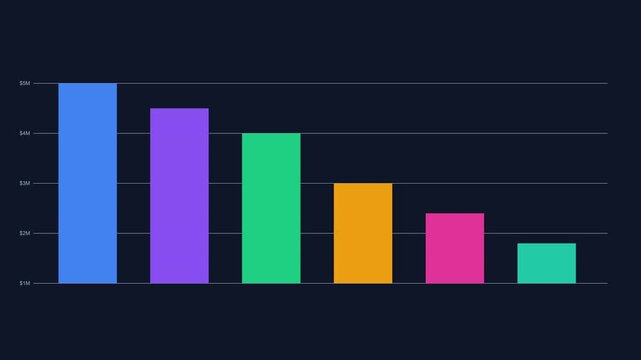
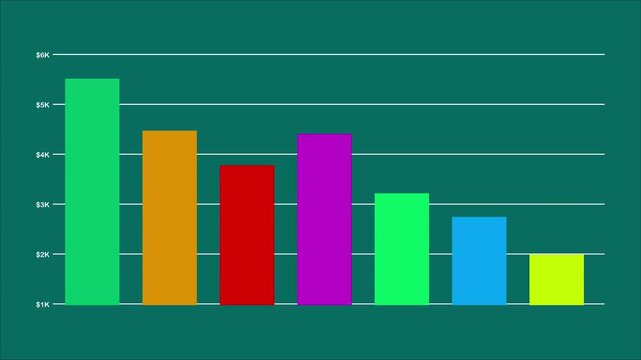
4K Animated Financial Bar Chart Growth with Colorful Columns on Dark Background
00:05
HD
comparative 4K close-up side view showcases high-quality expensive green tea leaves in a traditional wooden bowl positioned next to a white bag containing lower-quality cheap tea clearly
00:10
HD
Hemocyanin solution, a blue copper-containing respiratory protein fluid that reversibly binds oxygen, studied in invertebrate physiology, biochemistry, molecular biology, and comparative hematology
00:11
HD
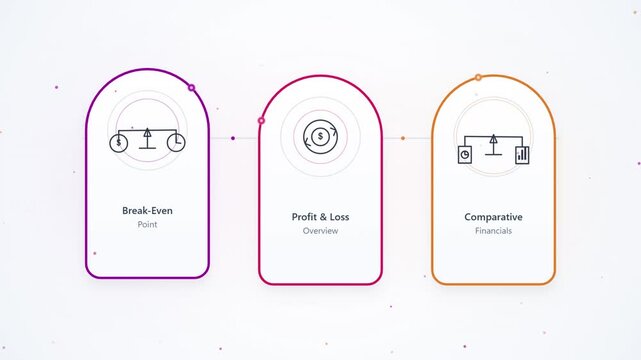
Business financial analysis charts showing break even profit loss and comparative data.
00:10
HD
Futuristic glowing radar chart displaying complex data visualization with multiple axes and comparative polygons on a dark digital background.
00:06
HD
Animated orange accented financial dashboard user interface showing top navigation header bar, comparative line graphs, and analytics summary panel.
00:07
HD
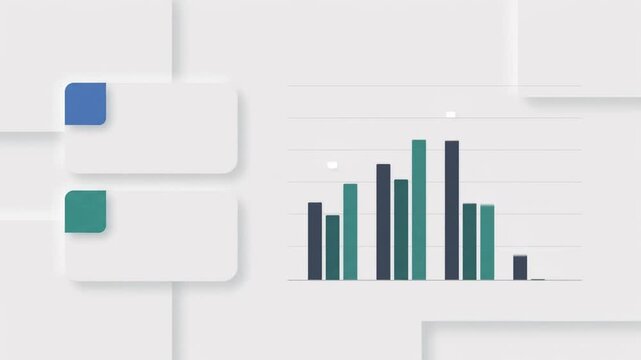
Bar chart illustrating comparative performance metrics through structured rectangular columns against a clean neutral background.
00:10
HD
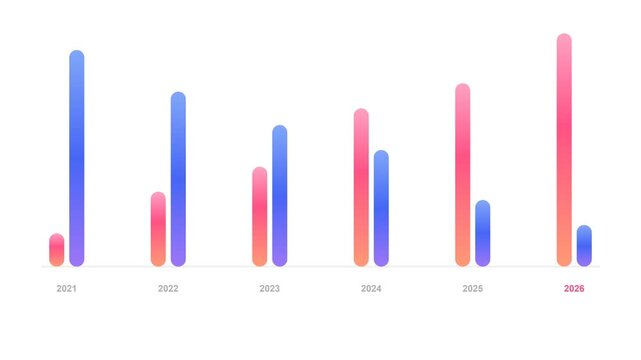
Abstract bar chart representing annual financial growth and comparative data analysis trends.
00:10
HD
A 3D bar chart featuring eight blue rectangular columns of varying heights against a white , with a single line graph segment connecting the first two.
00:10
HD
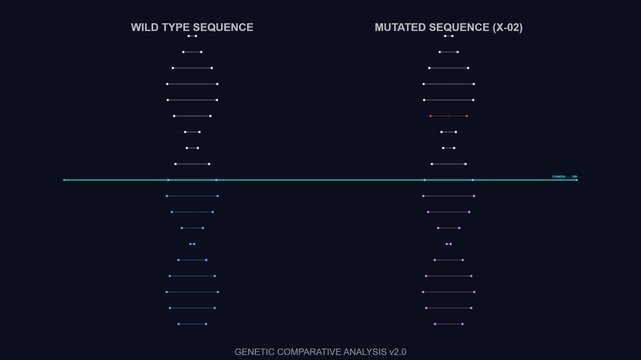
Genetic comparative analysis hud showing dna mutation scanning
00:10
HD
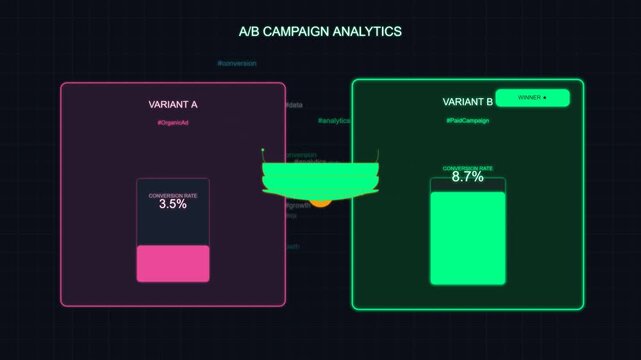
Ab testing digital campaign analytics dashboard showing variant comparison with conversion rates digital interface displaying ab with comparative performance metrics for two variants including rate
00:10
HD
Colorful Growth Bar Graph on Dark Background
00:05
HD
Comparative Advantage Highlighted Scrolling Title Animation
00:10
HD
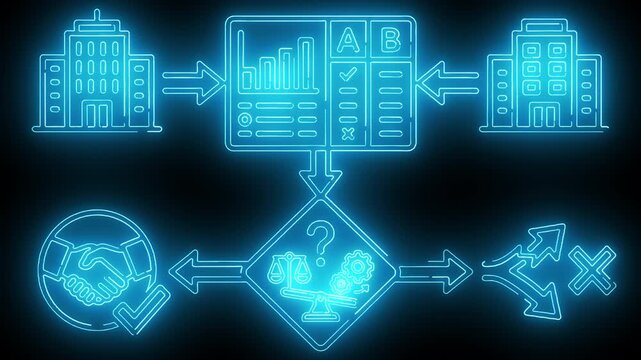
Neon Blue Business Decision Making Comparative Analysis and Partnership Choice Motion Graphic
00:10
HD
Economic History Word Cloud
00:11
HD
Split testing software animation demonstrating user interface optimization with comparative data charts and web page variations in motion
00:11
HD
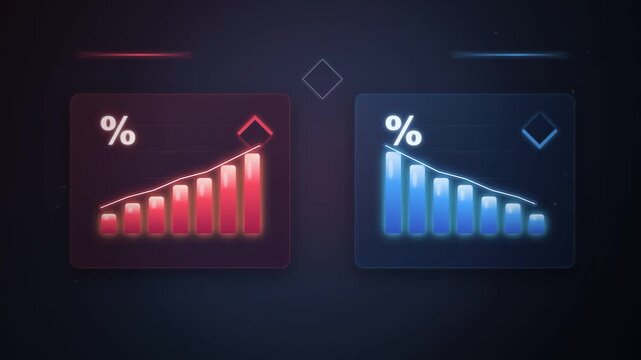
A comparative visualization of increasing and decreasing bar charts representing percentages, against a dark, futuristic background. The increasing chart is red, and the decreasing chart is blue
00:10
HD
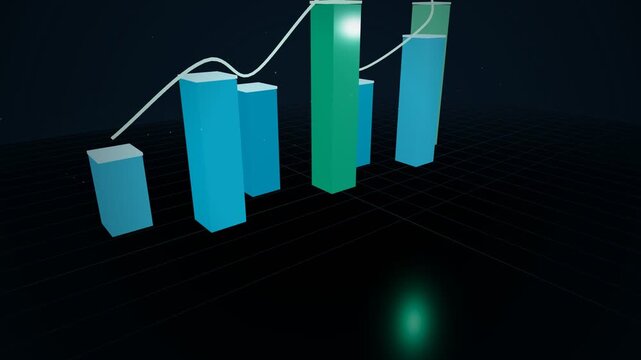
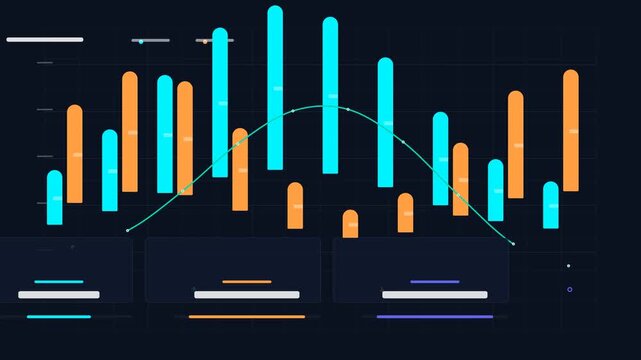
Glossy blue and green comparative bar chart columns with a curved trend line overlay
00:10
HD
Batch and control racks undergo comparative assay readings before archival retention as a paired set, following a sequence that reverses direction in the second row. Flat 3D style with smooth matte
00:08
HD
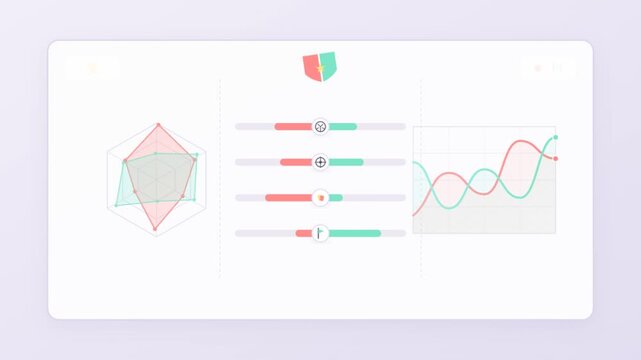
Animated data visualization dashboard showing comparative performance metrics through radar and line charts.
00:10
HD
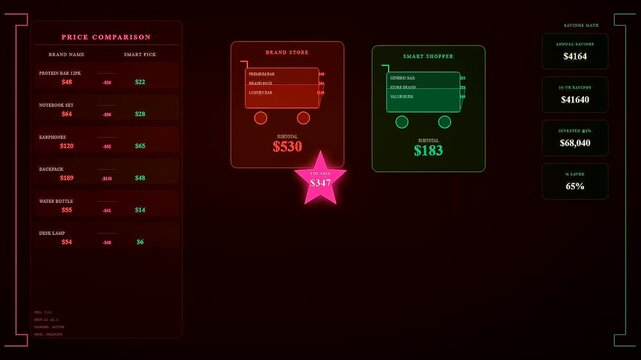
Digital displays showcasing youth financial education in a neon interface showing comparative shopping metrics as expenses decrease through informed consumer choices in this dynamic data presentation
00:06
HD
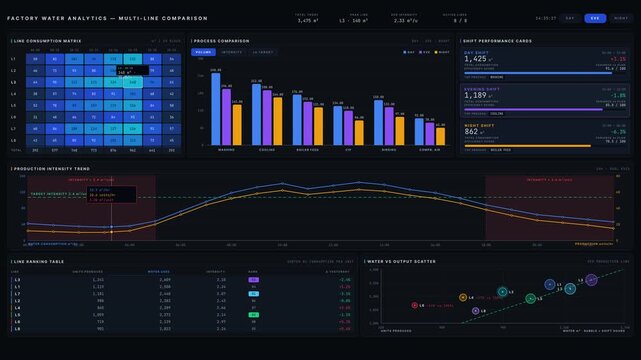
Experience a dark-mode factory water analytics dashboard showcasing comparative usage across processes, lines, and shifts with interactive visualizations and key performance metrics.
00:15
HD
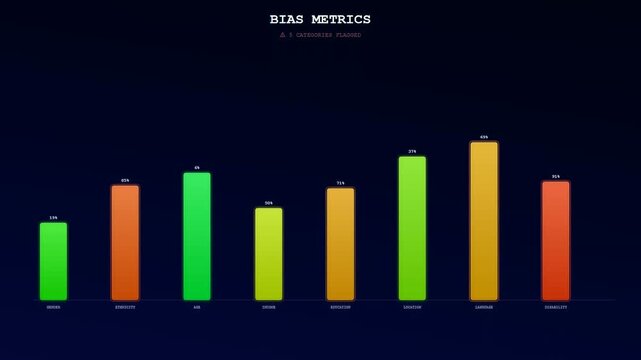
A digital screen displays AI Bias Auditing metrics that incrementally evolve through three progressive animation stages to reveal growing statistical data and colorful comparative bar chart analysis
00:06
HD
A horizontal bar chart on a dark background, effectively visualizing comparative data across different categories or periods, ideal for showcasing 'Key Metrics' or performance.
00:05
HD
Dynamic plot showing exponential data growth over time in technical presentation
00:10
HD
Bar chart animation displays comparative data columns on clean space. Market performance data routes on chart. Financial evaluation consoles use bar chart online.
00:06
HD
Comparative bar graph visualization for business market analysis
00:06
HD
Pack of animated charts and infographic elements
00:05
HD
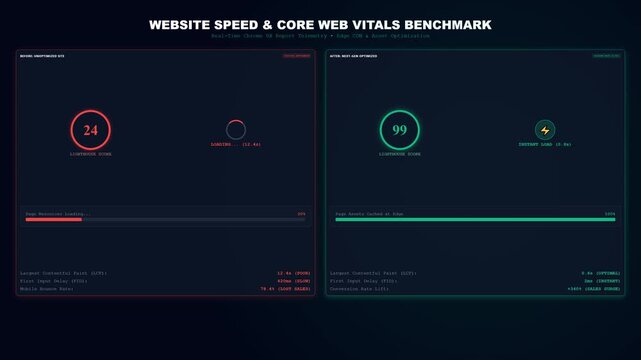
Comprehensive digital dashboard illustrating comparative website performance metrics and core web vitals benchmark for online presence optimization
00:08
HD
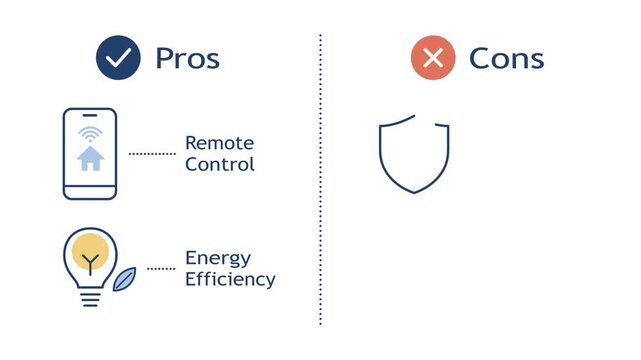
Comparative analysis of smart home technology advantages and disadvantages showing remote control and energy efficiency
00:08
HD
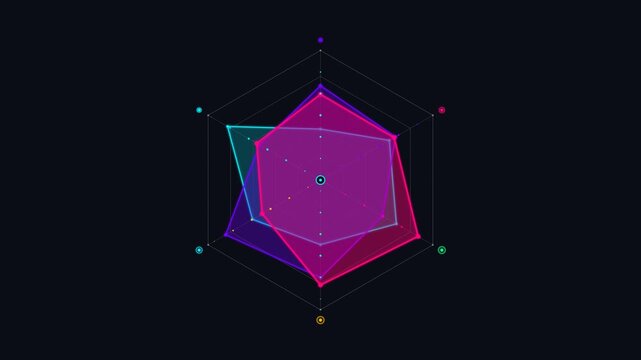
Abstract radar chart with overlapping data plots and circular node connections or spider graph displaying multiple sets with interconnected points, signifying comparative analysis
00:06
HD
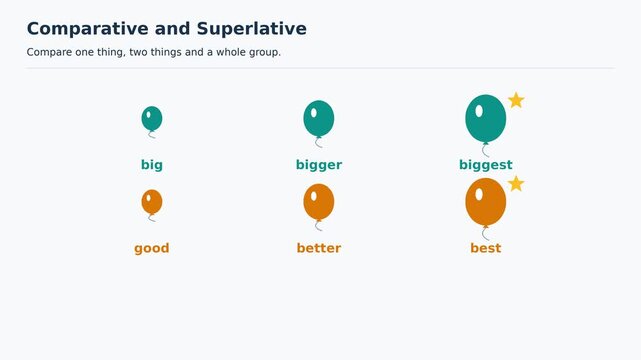
Comparative and Superlative Adjectives, Big, Bigger, Biggest and Good, Better, Best, Educational English Grammar Animation, Easy to Learn English for Kids, Classroom Explainer Video
00:10
HD
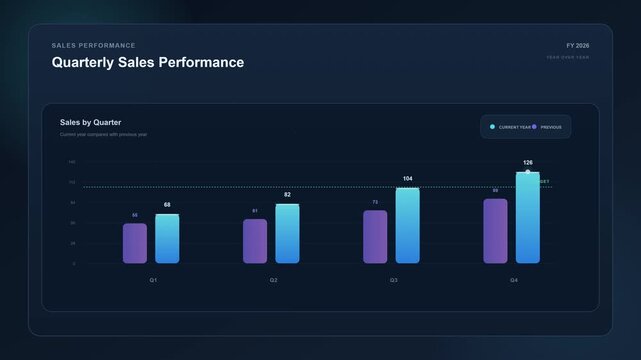
Animated Dashboard Displaying Quarterly Sales Performance Metrics with a Comparative Bar Chart and Target Achievement for Business Analysis
00:10
HD
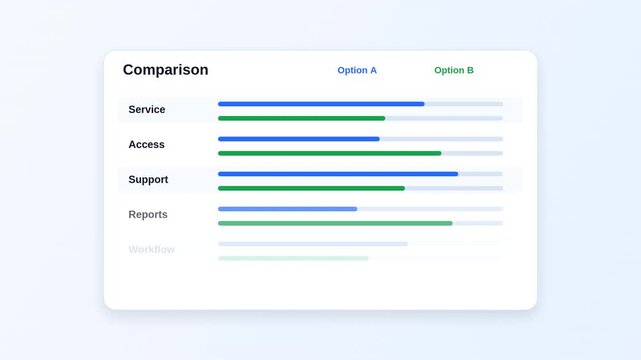
Dual progress bar layouts display comparative system data metrics cleanly. Performance balancing becomes obvious using these side-by-side loaders. The dual progress bar responds.
00:08
HD
Simile Word Cloud
00:11
HD
Biological sample organoid repositories managing genetic data for scientific research, featuring dna helices, a computer interface, and a comparative analysis system for biological information
00:17
HD
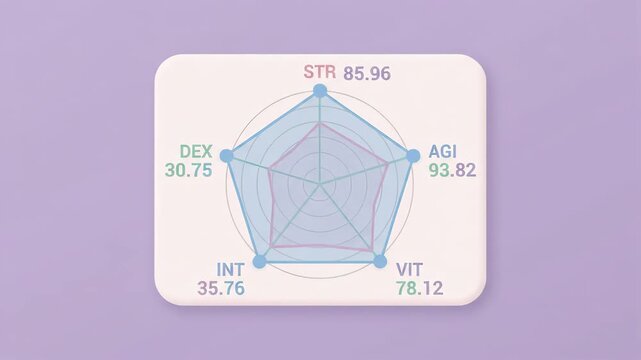
digital radar chart displaying comparative quantitative data values on floating white rectangular card set against soft purple solid background
00:06
HD
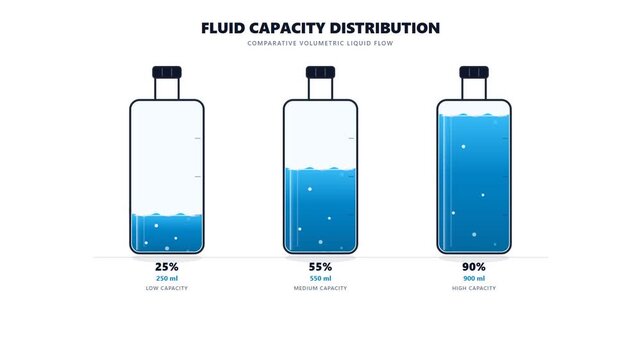
Comparative Fluid Capacity Distribution and Volumetric Liquid Level Chart
00:10
HD
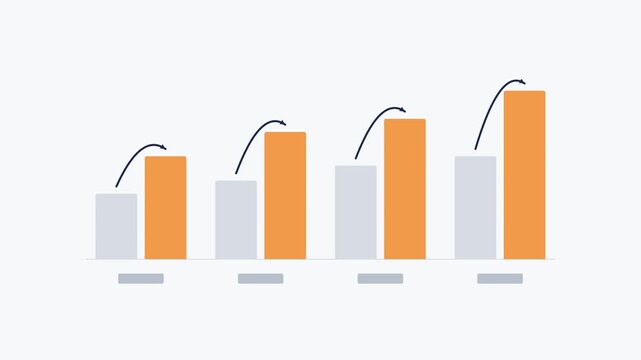
Animated comparative bar chart with grey and orange columns featuring rising curved arrow indicators on a white background. Concept of year-on-year business growth and performance comparison.
00:11
HD
Motion Data Analysis Video Showing Comparative Bar Charts for Various Metrics.
00:10
HD
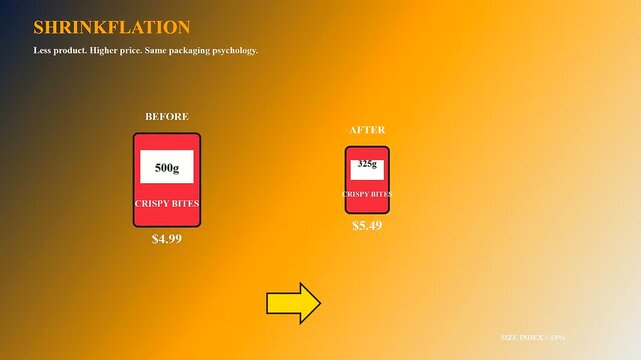
A digital visual study showing grocery price rises across three distinct comparative stages which illustrate the changing package weights and monetary costs of consumer food products
00:06
HD
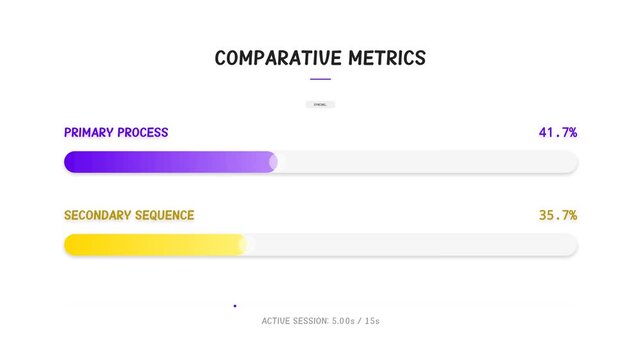
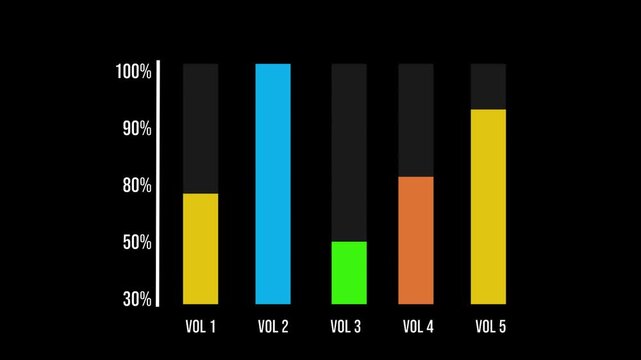
Comparative metrics progress bars showing increasing percentages
00:15
HD
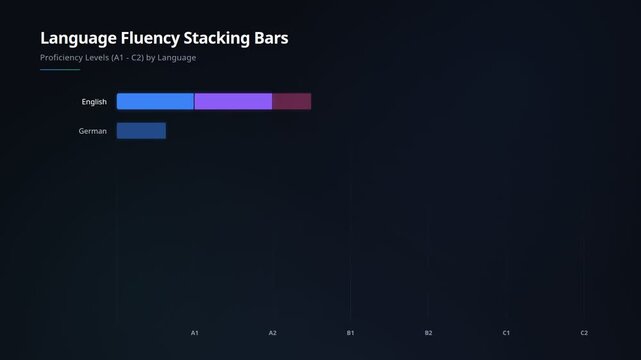
Animated language fluency stacking bars for proficiency levels a1 to c2 across various global languages, for comparative educational progress, data visualization, skill acquisition metrics
00:20
HD
A series of vertical bar charts on a dark background, effectively presenting a comparative 'Performance Overview' across various periods or distinct categories.
00:19
HD
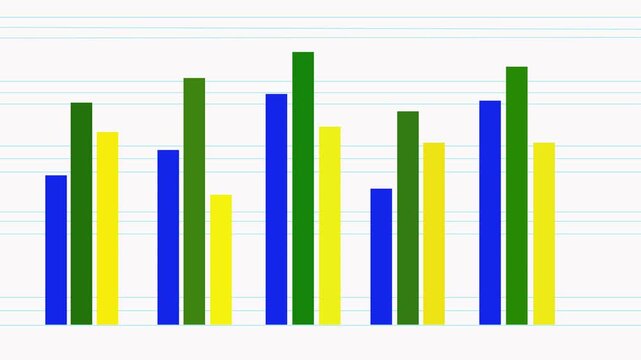
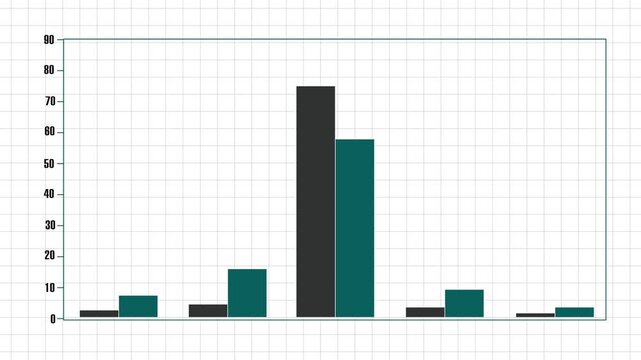
Colorful bar chart on white background with light grid lines, showing multiple grouped vertical bars in blue, green and yellow representing comparative data trends.
00:10
HD
Bar chart animation displays dual comparative columns across a matrix grid. Business revenue data routes on chart. Financial evaluation consoles use bar chart online.
00:06
HD
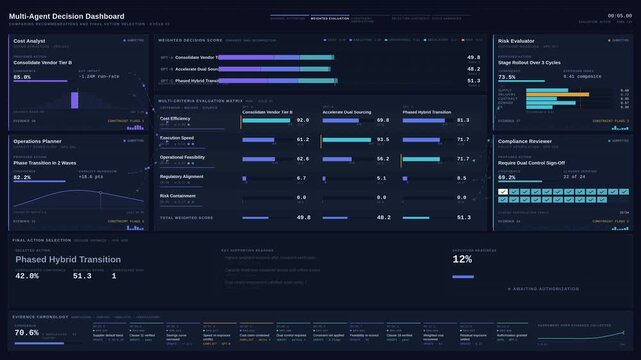
Premium 4K multi-agent decision dashboard visualizing autonomous specialist recommendations, weighted evaluation matrices, and final action selection with animated data flows.
00:15
HD
System benchmarking comparison dashboard evaluating standard industrial metrics and comparative target efficiency.
00:14
HD
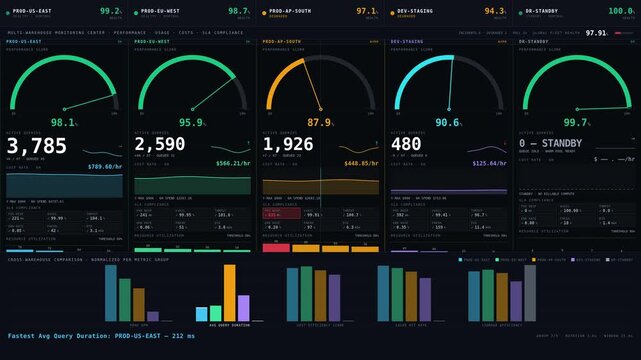
A comprehensive 4K animation showcasing a multi-warehouse monitoring center with real-time performance, usage costs, and SLA compliance metrics for enterprise analysis.
00:15
HD
Animated Cyan and blue neon bracket graphic on black background for sports tournament or competition visualization. 4K black background visuals
00:10
HD
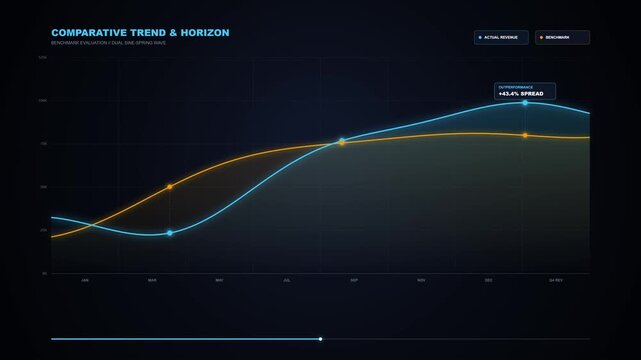
Comparative Trend and Benchmark Horizon Financial Analytics Chart
00:10
HD
Financial Performance Chart Illustrating Revenue Fluctuations, Market Trends, Investment Analysis, Profitability, Economic Movement and Comparative Financial Results
00:10
HD
Comparative Multi Line Graph Showing Financial Growth Trends
00:10
HD
Abstract 4K Motion Graphics of Corporate BENCHMARK Hub and Comparative Analytics Nodes
00:10
HD
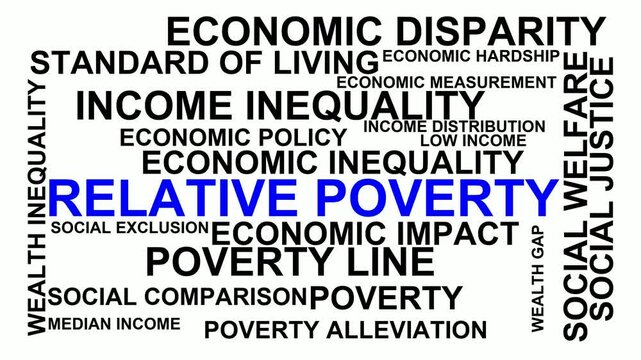
Relative Poverty Word Cloud
00:11
HD
Animated bar chart infographic showing dynamic data growth and comparative statistics data visualization
00:10
HD
Collection of animated charts and infographics elements
00:05
HD
Comparative Financial Burn-Rate Chart with Navy Blue and Safety Red Trendlines
00:05
HD
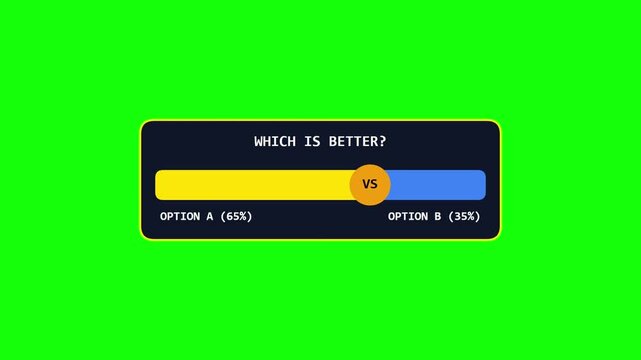
Interactive poll interface displaying comparative voting percentages against solid vibrant green screen background overlay with bars showing comparative
00:10
HD
Comparative benchmark visualization contrasts model alpha and model beta speed tests, performance metrics, and analytics, ideal for technology presentations and reports.

00:10
HD
Person delivering information and offering detailed guidance, showing data analysis and comparative evaluation with document icons, the process of giving advice
00:17
HD
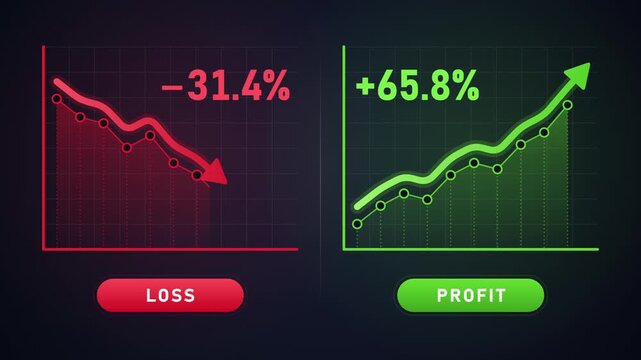
Comparative financial charts showing a red downward loss trend and a green upward profit trend
00:26
HD
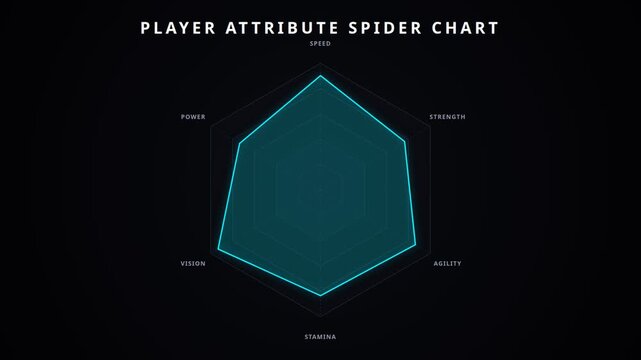
Player attribute spider chart with comparative performance metrics between two athletes, for data visualization, sports analytics, skill assessment, tactical planning, competitive evaluation
00:20
HD
A horizontal bar chart on a dark background, effectively visualizing comparative data across different categories or periods, ideal for showcasing 'Key Metrics' or performance.
00:19
HD
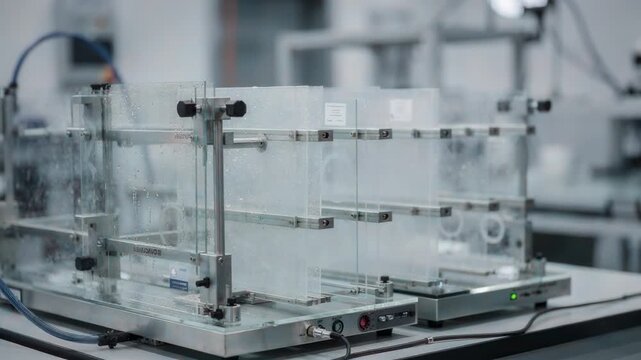
Close medium shot of comparative barrier tests in progress featuring multiple sample sets measured for oxygen and moisture barrier properties under controlled conditions.
00:05
HD
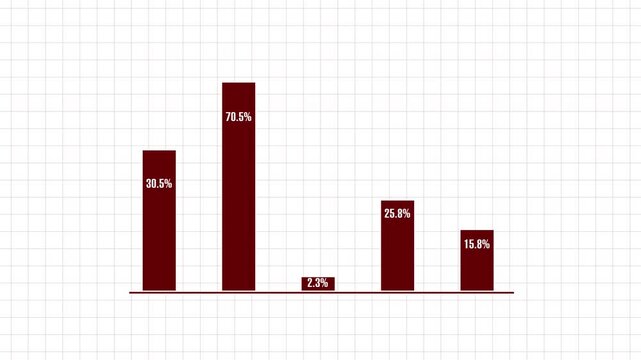
Bar chart animation displays comparative percentage data points on grid. Market performance data updates on chart. Financial analytics consoles use bar chart online.
00:13
HD
Hands adjust drying leaves inside open botanical press. Demonstrates plant morphology reference building, comparative specimen preparation, and educational resource creation for observational study.
00:14
HD
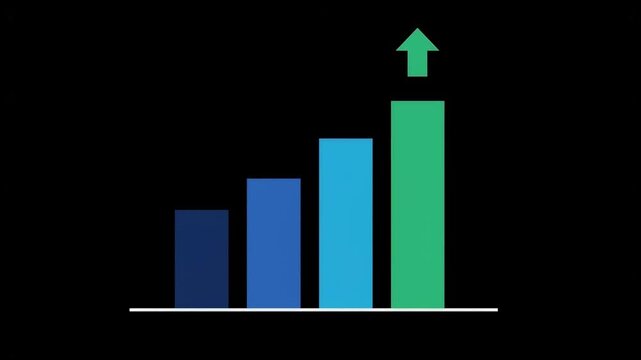
Colorful growth bar graph on green background
00:05
HD
Modern bar chart animation showing growth comparison on dark
00:06
HD
Animated red neon bracket graphic on black background competition visualization. 4K black background visuals
00:12
HD
Department manager points out noticeable errors in report. Corporate report filled with elaborate graphs percentage figures and comparative tables
00:15
HD
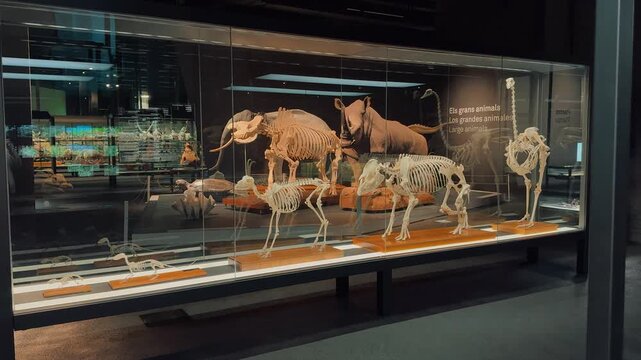
A collection of animal skeletons and taxidermy models is displayed inside a modern glass showcase at a natural history science museum, illustrating comparative anatomy, wildlife biological evolution
00:07
HD
Chart displaying a bar graph showing comparative data
00:10
HD
Comparative chart displaying data metrics with animated progress bars for business analytics performance video footage
00:10
HD
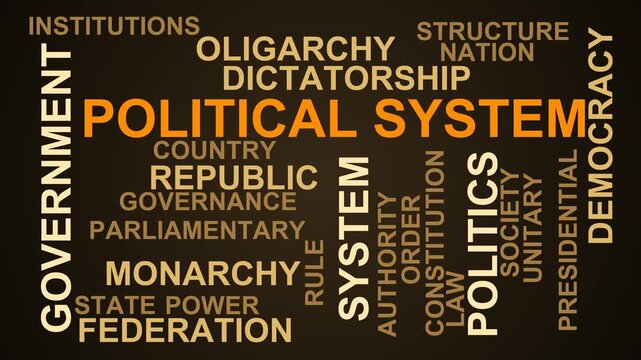
Political System Word Cloud
00:11
HD
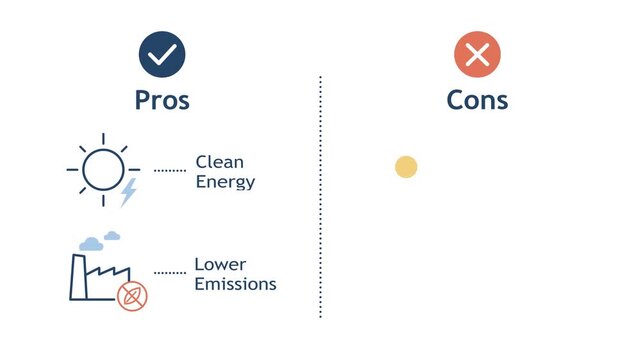
Comparative Infographic of Clean Energy Benefits and Environmental Impact for Sustainable Power
00:08
HD
Animated element for business infographics - horizontal bar chart
00:05
HD
Layered area chart compares global performance trends
00:12
HD
Hair Restoration Transformation: A comparative image reveals a man's journey to hair restoration, showcasing the transformation of his scalp through treatment or procedure.
00:05
HD
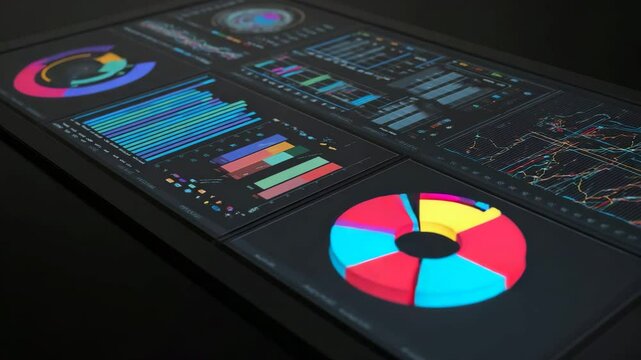
Perspective view of a modern data interface featuring vibrant circular diagrams, comparative bar charts, and line graphs on a dark touchscreen background
00:10
HD
A comparative study of the nuclear envelope in different cell types highlighting its variation in thickness and complexity.
00:08
HD
Marketing department analyze performance metrics of marketing campaigns represented in charts and graphs, make ROI or comparative data analysis, reveal trends and market dynamics in modern boardroom
00:06
HD
Dynamic Sales Performance Chart Animation with Rising Graph and Engaging Color Transitions
00:10
HD
A series of vertical bar charts on a dark background, effectively presenting a comparative 'Performance Overview' across various periods or distinct categories.
00:05
HD
Two anatomical skulls are positioned side by side against a neutral background, offering a comparative view of their structure.
00:05
HD
Aerial drone cinematic video of recently renovated snow center of Anilio Perched on the top of Pindus, with the comparative advantage of easy and direct access via the Egnatia Motorway, covered in sno
00:12
HD
Mid-Year Performance Analysis of Photo Stock: Key Metrics & Comparative Data to Optimize Operational Processes and Enhance Strategic Outcomes
00:05
HD
A comparative D model of a healthy vs. cancerous hip bone, showing a stark contrast between the two sides. The cancerous side is deformed, brittle, and covered in abnormal growths
00:10
HD