Ein Link zum Festlegen deines Kennworts wurde gesendet an: Um in Zukunft auf deine Käufe zugreifen zu können, benötigst du ein Kennwort.
Kreativität ohne Ende – unbegrenzte Downloads plus leistungsstarke KI-Bearbeitung.
Neue Filter hinzugefügt
Sortieren nach

13.155 Ergebnisse für charttechnik in „Videos“

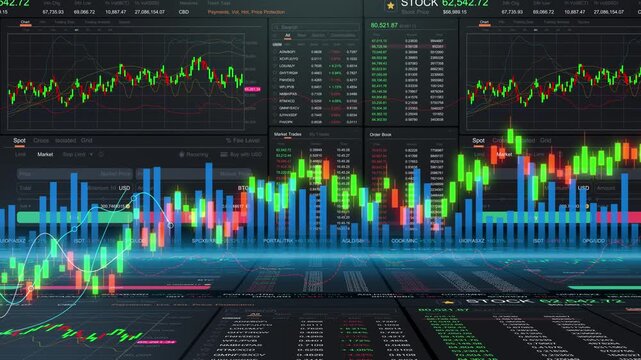
Animated stock trading platform interface with candlestick chart order book and buy sell controls
00:12
HD
Red Bear Market Candlestick Chart Animation with Falling Red Arrows
00:20
HD
Abstract digital candlestick chart with global financial data background, perfect for trading, forex, crypto, and investment presentations. Financial Investment Background. 3d Rendering.
00:20
HD
The acronym IPO Initial Public Offering is spelled out using three wooden letter blocks placed on top of a background featuring financial candlestick charts and graphs. 3D render animation
00:07
HD
Financial stock market dashboard with candlestick charts. Digital trading data interface. Global economy and crypto exchange background.
00:20
HD
Stock Market Candlestick Chart with Glowing Trend Line Loop 4K
00:12
HD
Candlestick chart moving on a forex trading screen. Stock market indexes, investment data and crypto trading
00:15
HD
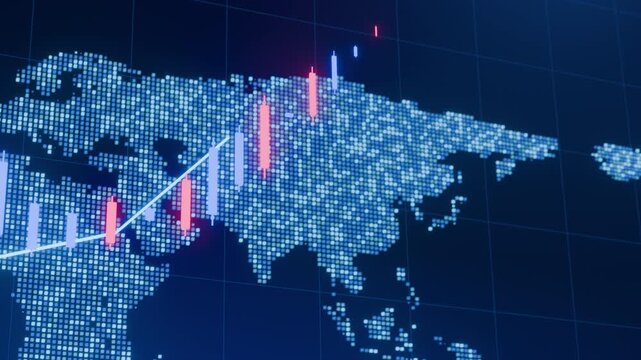
Stock market candlestick chart hologram on digital world map,global financial index analysis,business economy investment.Global market analysis world map with stock market graph overlay animation
00:15
HD
Candlestick chart scrolling live price bars stock market trading data animation seamless loop transparent background
00:12
HD
Digital stock market candlestick chart with glowing neon lines showing financial data analysis on a overlay background for business and investment
00:07
HD
Futuristic Financial Trading Chart and Glowing Candlestick Graph Loop
00:15
HD
Investment profit chart, candlestick graph with rising arrows over pile of silver coins in dark light
00:14
HD
Minimalist financial candlestick chart pattern isolated on a black background
00:10
HD
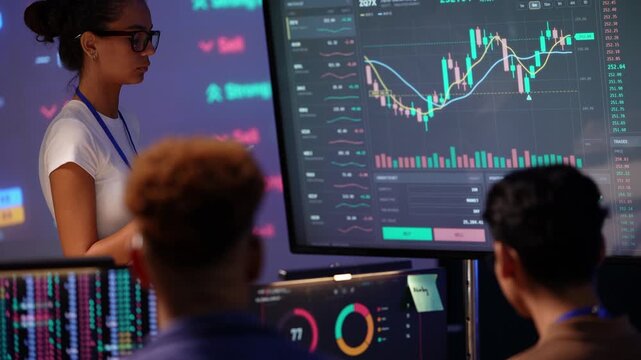
Latina woman in a white tee writes on a tablet at a big candlestick chart, then turns to point at the trend line while an Asian trader leans in to talk with a teammate
00:22
HD
Particle algorithm investment analysis and financial stock, digital candlestick chart movement trend, cyber trading price value open low high close
00:20
HD
Futuristic global financial data visualization, world map and digital globe with candlestick chart, stock trading analytics, forex market dashboard, fintech infographic, big data interface
00:20
HD
A dynamic close-up timelapse of candlestick charts rising and falling on a trading screen, reflecting market volatility and momentum. trading bots, algorithmic trading, AI assistant agents
00:10
HD
Abstract Digital Financial Candlestick Chart with Glowing Blue and Pink Bars on Dark Background
00:20
HD
Animated Financial Candlestick Chart with Volume Bars
00:15
HD
Candlestick chart visualizing financial market trends, investment patterns, price fluctuations, and trading strategy in capital and digital asset markets Marrow
00:10
HD
Candlestick chart animation with rising trend, sharp red crash and green breakout recovery on dark grid
00:15
HD
Global financial trading dashboard featuring candlestick charts, volume bars, and world map visualization representing international market trends and financial analytics. Investment background
00:20
HD
3d metallic candlestick chart icon representing financial market trading growth and stock analysis 3D Icon
00:05
HD
Dynamic stock market chart with candlestick patterns and real-time financial data on a digital screen ideal for illustrating investment trading and economic analysis
00:08
HD
Digital Stock Market Dashboard with Glowing Candlestick Charts and Financial Analytics. Global Trading Data Visualization for Investment, Fintech, Economy, and Business Technology.
00:14
HD
Stylized financial chart with candlesticks animation, bar graphs and line plot on black background
00:12
HD
Forex candlestick chart moving on an exchange background. Investment index and trading
00:15
HD
Stock Market Chart, Beautiful 3d Animation of Japanese Candlestick Graph in Time Lapse. Seamless Looping Ultra HD 4K 3840x2160
00:30
HD
Digital stock market dashboard with glowing candlestick charts, financial analytics, and global trading data visualization for investment, fintech, economy, and business technology, 3D animation.
00:25
HD
Graph stock market candlestick chart with average line financial investment analysis. in blue tones color and clean design.
00:14
HD
Trader Analyzing Stock Market Candlestick Chart On Smartphone Screen In Front Of Laptop Display
00:10
HD
Financial growth chart over coins, rising candlestick graph and arrows on silver dollar money in dark studio
00:14
HD
Mobile Smart Phone Trading Stocks and Shares on Investment App
00:20
HD
Latina woman holding a tablet explains a candlestick chart on the big screen as a Black programmer at his desk stops typing, clasps his hands and listens with an Asian coworker
00:03
HD
Perspective panoramic stock market dashboard with candlestick chart, financial growth analysis and global investment strategy on business interface
00:20
HD
Futuristic global financial data visualization, world map and digital globe with candlestick chart, stock trading analytics, forex market dashboard, fintech infographic, big data interface
00:20
HD
Glowing financial candlestick chart
00:22
HD
Dynamic financial candlestick chart showing stock market price fluctuations and data analysis for investment, trading, and business concepts on a digital display with a shallow depth of field
00:09
HD
Stock market candlestick chart hologram on digital world map,global financial index analysis,business economy investment.Global market analysis world map with stock market graph overlay animation
00:24
HD
Candlestick chart visualizing financial market trends, investment patterns, price fluctuations, and trading strategy in capital and digital asset markets Marrow
00:10
HD
Candlestick chart rises through resistance in a bullish market breakout
00:12
HD
Cryptocurrency trading chart on a bright white screen, with candlesticks, volume bars, and a coin watchlist, at an angle with depth of field
00:27
HD
Stock market trading dashboard with financial charts and analytics
00:20
HD
Abstract Financial Growth Animation with Golden Upward Arrow and Digital Stock Market Trading Charts
00:20
HD
Candlestick stock chart with glowing moving average rising in an uptrend on a dark grid, seamless 4K loop
00:15
HD
Advanced Financial Analytics Dashboard Displaying Stock Market Trading Data Visualization
00:12
HD
Forex candlestick chart rising over a dark background. Investment data and trading figures
00:13
HD
Trader Analyzing Market Chart on Smartphone
00:29
HD
Financial candlestick chart and upward trend line glowing on digital screen
00:15
HD
White Japanese candlestick chart on dark blue gradient field. Financial white Japanese candlestick chart for stock trading analysis. Corporate white candlestick chart.
00:10
HD
Asian Female With Her Tablet at Financial Trading Control Room, Work Continuously With Her Tablet
00:15
HD
Global financial market, candlestick chart and world map over pile of silver coins, international trading
00:14
HD
Candlestick charts in neon green and red track across a dark digital dashboard in a seamless loop. Forex analytics, crypto trading, global markets, or inflation trends
00:21
HD
Looped financial market candlestick chart with changing trends. Seamless loop visualizes financial data, price fluctuations, investment analysis and trading activity on abstract blue background
00:10
HD
Light green candle chart stock market, graph diagram and statistic information business financial investment wealth display index
00:20
HD
Rotating 3D trading desk with laptop and financial charts
00:20
HD
Candlestick chart analysis with moving averages during volatile market conditions
00:06
HD
Dynamic Financial Graph with Neon Candlestick Chart Elements
00:05
HD
Financial candlestick chart animation with moving average line for stock market analysis and trading data visualization on 4k black background
00:10
HD
Stock market analysis with candlestick chart and price movement trend line, highlighting global financial trends, stock trading, and investment strategy insights Marrow
00:10
HD
Digital financial candlestick chart stock market data analysis graphic template
00:15
HD
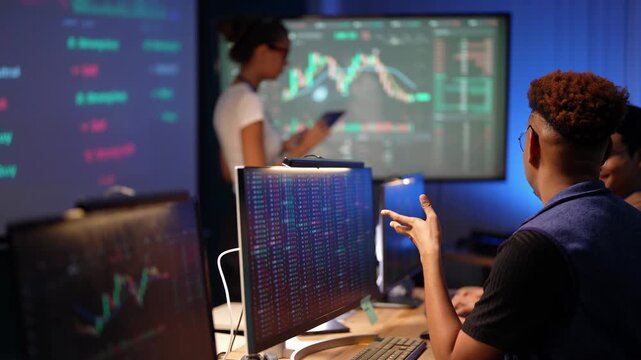
Latina analyst with a tablet reviews stock candlestick charts on a wall screen as a Black developer in a blue vest types and an Asian colleague reaches over to point at his monitor
00:12
HD
Stock market candlestick chart surging upward with massive green growth and profit
00:12
HD
Abstract Digital Financial Chart with Glowing Candlestick Data Points on Dark Futuristic Background
00:20
HD
Abstract financial market wave chart animation with neon data visualization and candlestick graphs financial chart
00:16
HD
Advanced Financial Analytics Dashboard Displaying Stock Market Trading Data Visualization
00:12
HD
Rising quotes on a stock exchange screen with a green bullish trend. Forex candlestick chart and growth
00:10
HD
Multiple computer monitors display complex financial data. Glowing screens showcase vibrant red and green candlestick charts, perfectly illustrating live market trends
00:11
HD
A financial stock chart displaying the ups and downs of market trends with a candlestick graph and moving average line against a dark background. This graphic represents financial data and analytics.
00:10
HD
Woman financial analyst working at stock trading terminal with candlestick charts in office
00:19
HD
Female Executive Stands by Window Inside Modern Office Using Smartphone. Visualisation of Application Showing Augmented Stock Market Candlestick Graphs, Trading Performance Metrics, Fintech Analytics
00:15
HD
Rising candlestick chart showing a bull market uptrend, with green and red candles, moving averages, grid lines, and volume bars, on a dark stock trading screen
00:24
HD
Forex expert in office looking over candlestick charts on screen to assess stock market volatility. African american woman in hedge fund company reading investment reports, camera A
00:20
HD
Diversified Investment Strategy – Pie Chart and Candlestick Graphs Representing Portfolio Management with Stocks, Bonds, and Commodities
00:08
HD
Digital candlestick chart movement trend, cyber trading price value open low high close, dark particle algorithm investment analysis and financial stock
00:20
HD
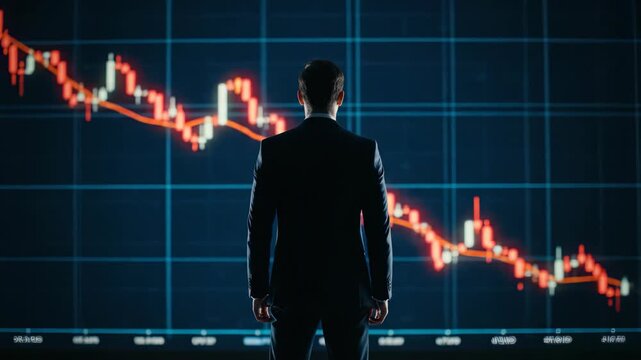
A finance executive watches a dramatic red decline stock market candlestick graph on a large screen, concept for economic recession, financial crisis analysis and investment strategy
00:08
HD
Financial trading chart display showing stock market candlestick graph with red and green indicators on dark monitor screen.
00:10
HD
Mysterious moonlit forest scene with slow motion of glowing candles lined along reflective path. Mist and shadows creating surreal and magical ambiance. Witchcraft, rituals, Halloween
00:06
HD
Digital financial trading application showing interactive stock market candlestick charts on a mobile phone
00:10
HD
Stock market analysis with candlestick chart and price movement trend line, highlighting global financial trends, stock trading, and investment strategy insights Marrow
00:10
HD
Animated candlestick chart, trading graph, trend of business, stock market investment, digital currency
00:10
HD
Black presenter in a blue vest points his stylus at a candlestick chart on the screen and then explains to the audience, a Latina colleague beside him, an Asian man watching from behind
00:10
HD
Stock market trader monitoring candlestick chart on computer screen for financial investment and trading
00:05
HD
Abstract Digital Financial Market Flow with Green and Red Candlestick Charts on Dark Background
00:30
HD
Colorful financial candlestick chart with blue, orange, and red bars showing market trends, data analysis, dynamic trading activity, investment insights, and trend lines for comprehensive market
00:10
HD
Dynamic neon trading chart and candlestick graph finance data analytics dashboard for market and economy investment glowing line wave financial graph interface, digital visualization pulse and risk
00:05
HD
Rising candlestick chart on exchange screen. Crypto and stock price growth, bullish market and investment profit
00:11
HD
Bull and bear symbols of stock market on a smartphone with stock market data application
00:10
HD
Financial Stock Market Candlestick Chart and Data Animation
00:15
HD
stock market graph animation - candlestick chart background
00:30
HD
Animated financial candlestick chart with rising cyan trend line, green and red candles, and upward growth trajectory on dark blue grid background
00:13
HD
Close-up of a cryptocurrency trading screen with price fluctuations, order book, and green and red candlestick charts. Crypto and stock market graphs
00:12
HD
Worried finance advisor seeing the forex trends downward and losing money, concerned about failure and bankruptcy late at night. Frustrated sad person being displeased and stressed. Camera B.
00:13
HD
Animated Green and Red Candlestick Chart Rising on Black Background
00:30
HD
Financial business investment concept, line and candle chart stock trading display show data analysis indicator index, digital forecast movement in the future
00:19
HD
A 10-second seamless loop of a 3x3 matrix of synced miniature crypto charts showcasing radial propagation, synchronized data pulse, and fine-tuned financial dashboard aesthetics.
00:10
HD
A dynamic close-up timelapse of candlestick charts rising and falling on a trading screen, reflecting market volatility and momentum
00:29
HD
Gold bullion 999.9 with stock market candlestick chart background, precious metal investment video.
00:10
HD
A cryptocurrency trader intently monitors a live candlestick chart on the trading screen, observing fluctuating market prices reflected in vibrant green and red bars
00:12
HD
A finance professional analyzes stock market trends using a computer. The image displays a vibrant candlestick graph indicating growth and investment strategies. Copula
00:10
HD