

AI Artificial Intelligence Presentation Template for Robotics Cybersecurity, Tech Startup Pitch Deck
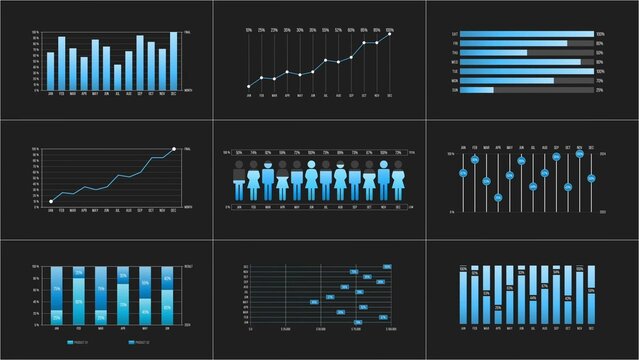
Elegant Infographic Charts
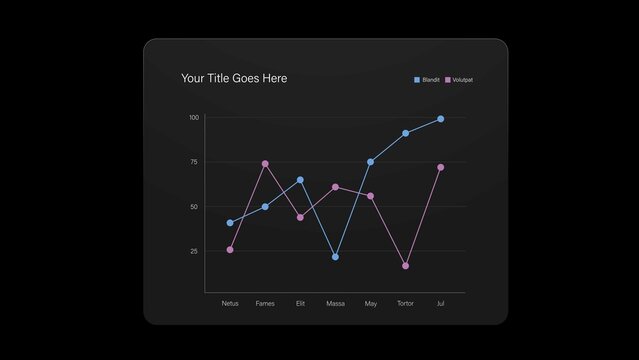
Line Chart Infographic Video Template

Clean And Modern Business Analytics Dashboard UI
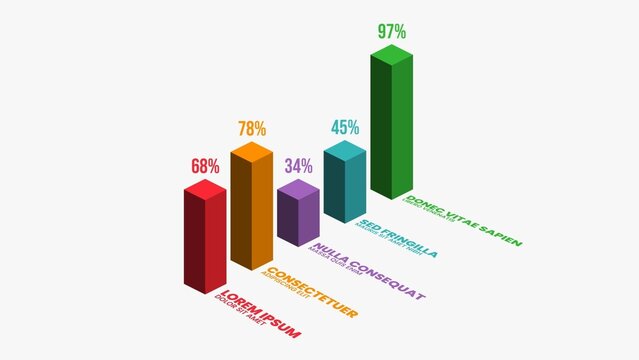
Comprehensive Modern Data Graphics Suite
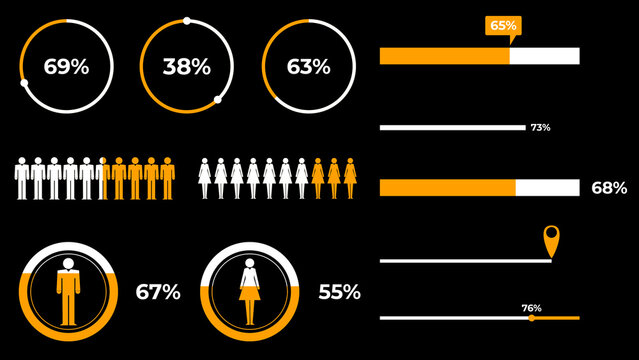
Infographics Elements.
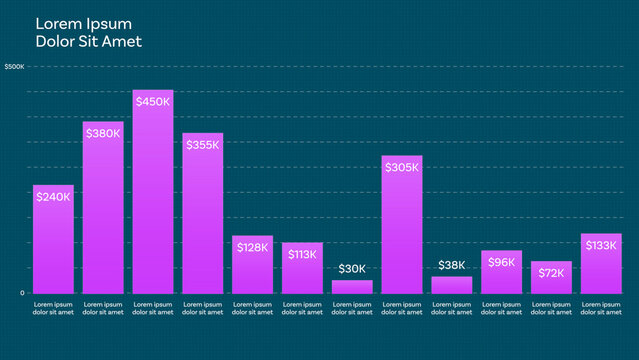
Responsive Vertical Bar Chart for Design and Data Visualization Design and Slide Presentation and with 12 Animated Data Points + Custom Text + Color with Dual Bar Graph Mode and Dynamic Auto-width Bar

Waterfall Chart Infographic Template with Minimal Design
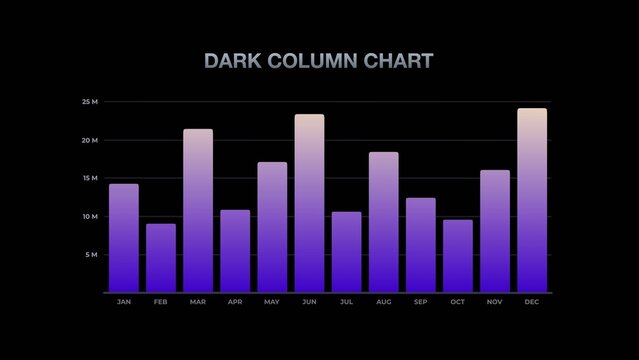
Modern Gradient Dark Column Chart
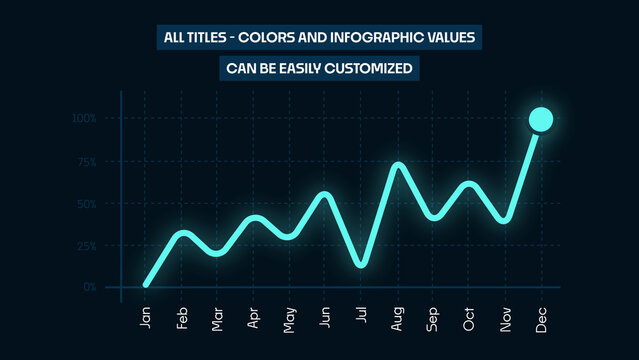
Animated Line Chart Infographics | Business Data Visualization and Analytics Graph

Modern Business Infographic Elements Set
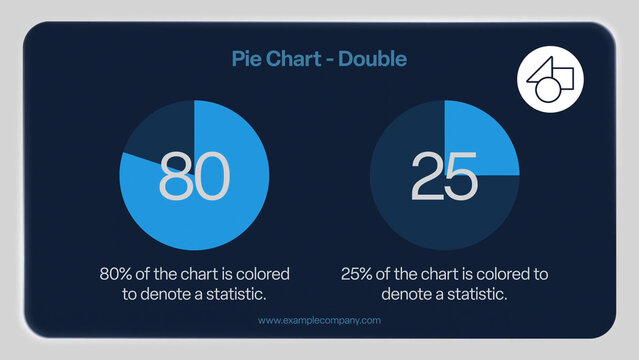
Elegant Double Pie Chart Infographic Slide

Annual Report Brochure Template
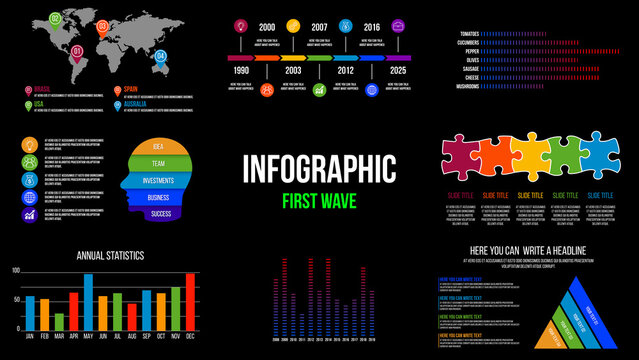
8 Infographics Elements
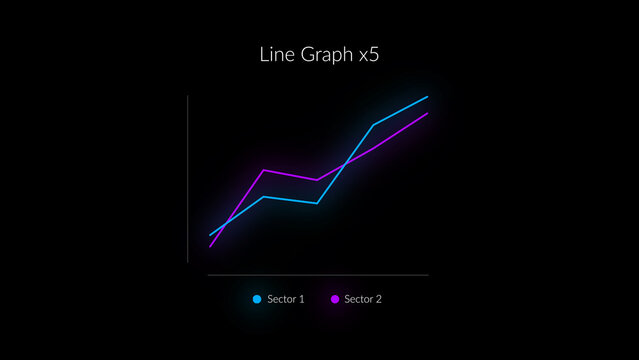
HUD Neon Infographics Line Graph x6
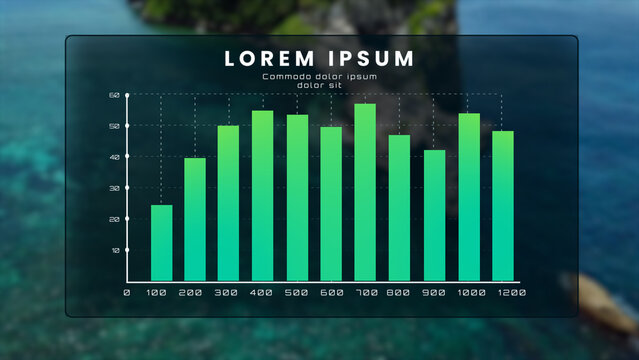
Infographics

Bento Box Business Infographic Template for Dashboard Report, KPI Metrics, Data Visualization

Business Dashboard Design
Map It Out Point Titles
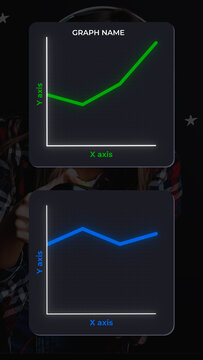
Mini Line Graph For Data Analytics And Trends Forecast

Modern Presentation Template with Agriculture, Agribusiness, Environmental & Sustainability Theme
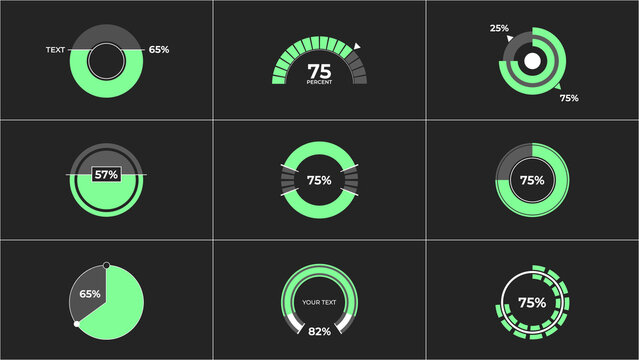
Circle Ring Infographic
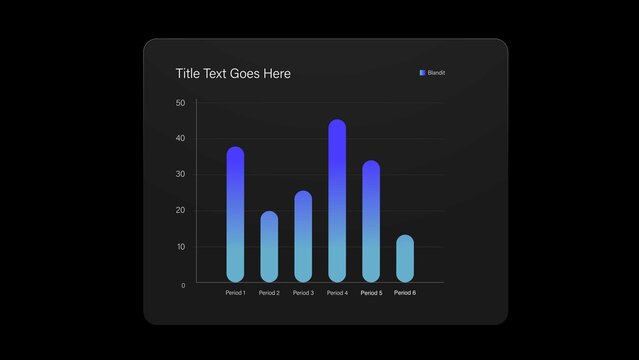
Infographic Bar Chart Video Template

Modern Dark Analytics Dashboard UI
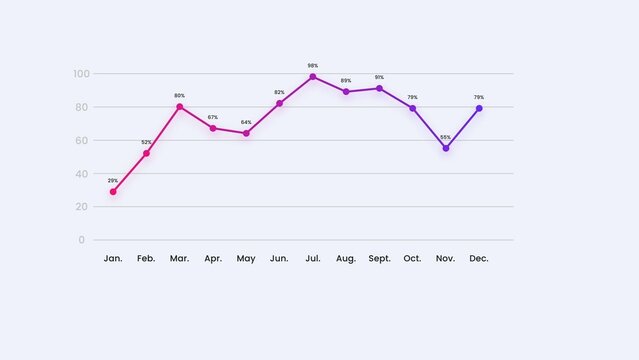
Modern Multi Value Chart Infographic

Account Service Dashboard
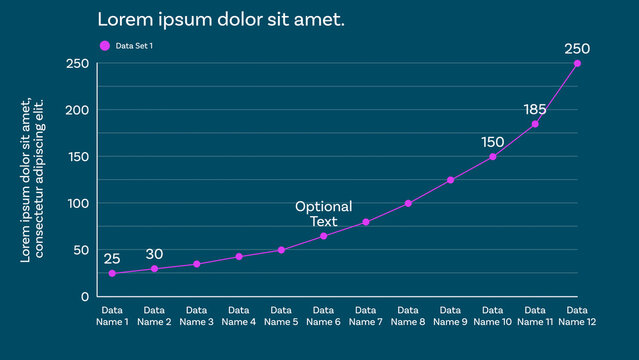
Responsive Line Graph for Clean and Modern Data Visualizations Design and Slide Presentations with up to 12 Animated Data Points and Optional Labels to show Percentages, Whole Values, and Custom Texts
Business Analysis Pie Chart Illustration Infographic Template
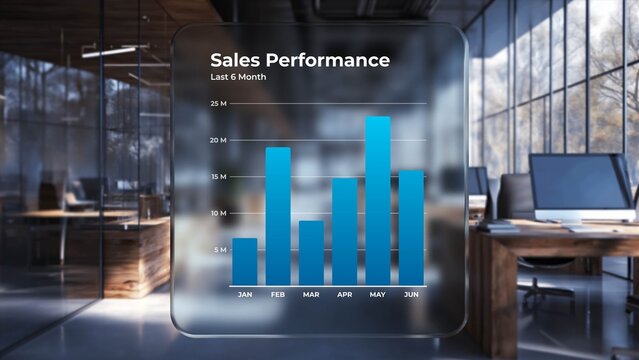
Glassmorphism Sales Performance Dashboard
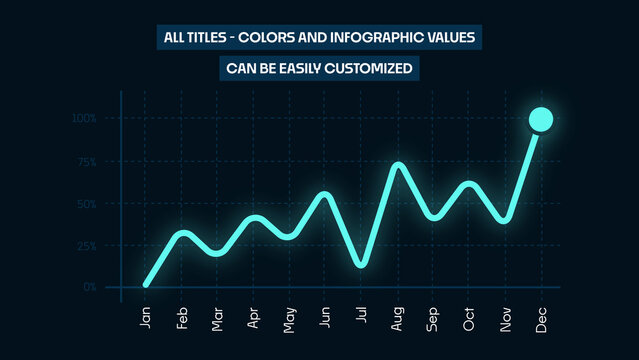
Animated Line Chart Infographics | Business Data Visualization and Analytics Graph
Bento Box Business Infographic Template For Dashboard Report, KPI Metrics, Data Visualization
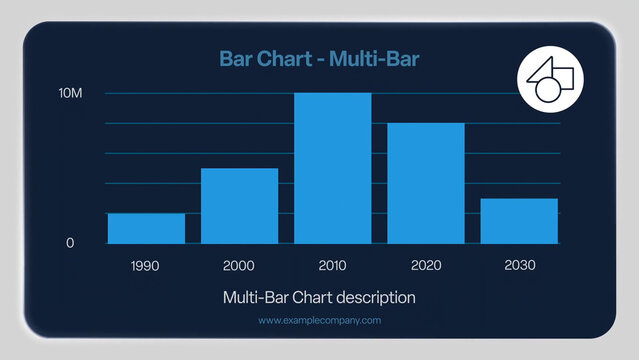
Elegant Multi-Bar Chart Infographic Slide
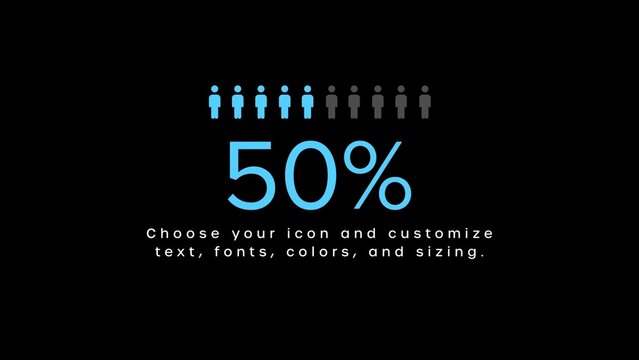
Infographic Maker with Percentage
Annual Infographic Timeline Template with Gradient Wave Line
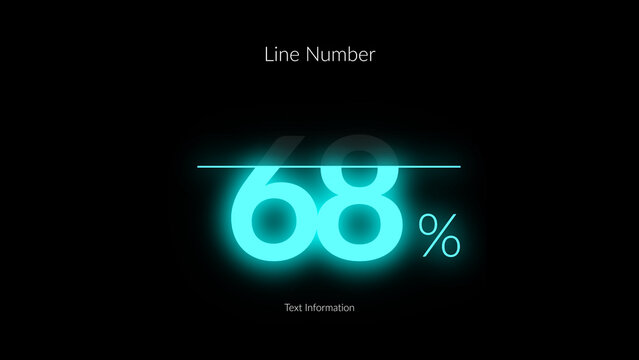
HUD Neon Infographics Line Number x1
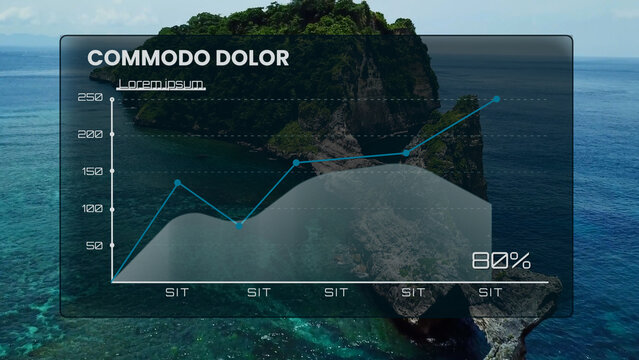
Infographics 03
Editable Graph Elements for Data Visualization Layouts
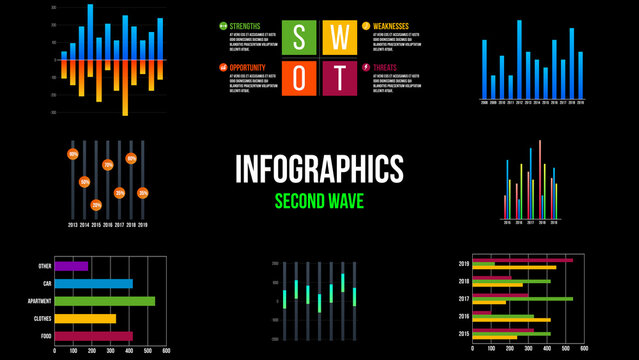
8 Infographics Elements
Business Infographic Set
Green And Black Fintech Fact Sheet
Modern Presentation Template with Agriculture, Agribusiness, Environmental & Sustainability Theme
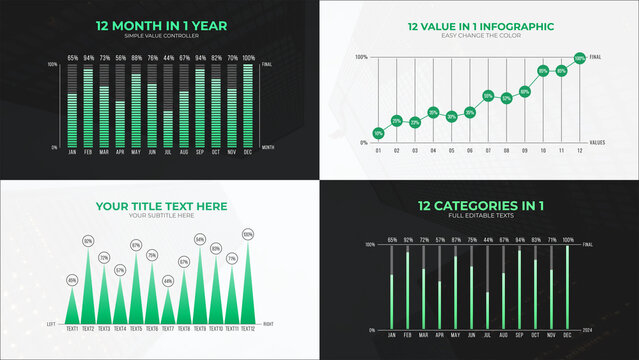
12 Value in 1 Infographic Charts
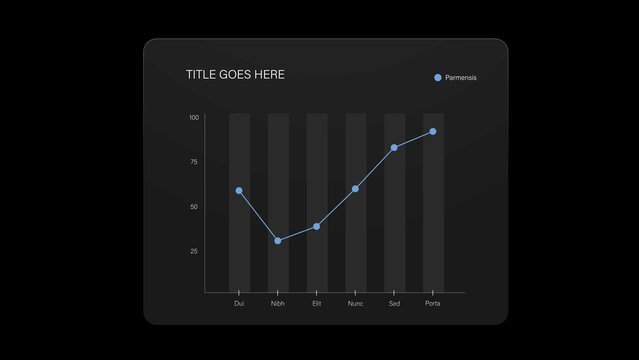
Line Chart Infographic Video Template
Modern Business Analytics Dashboard UI Template
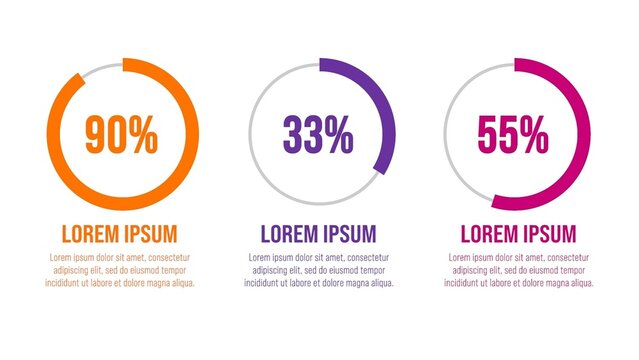
Modern Pie Style Circle Graph Chart With Percentages and Details Infographic
Three-Color Infographic Elements Set 2
Business White Paper Brochure Template Corporate Report Design
Business Projection Infographic Template with Candle Graph Illustration
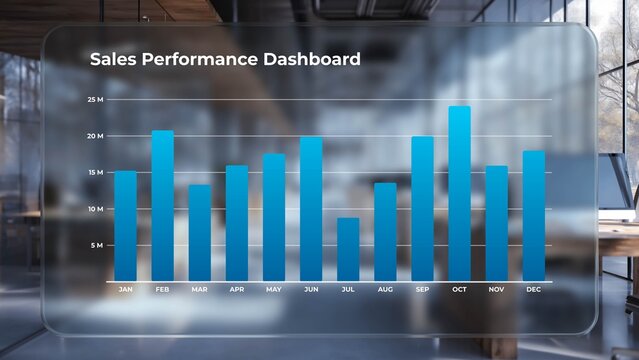
Corporate Glass Bar Chart
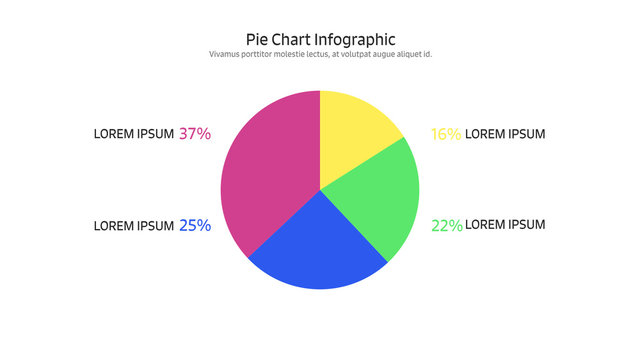
Pie Chart Infographic
Business Intelligence and Audience Targeting Vector Icons Set
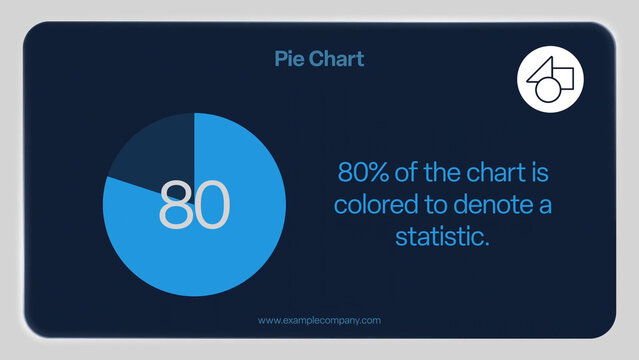
Elegant Pie Chart Infographic Slide
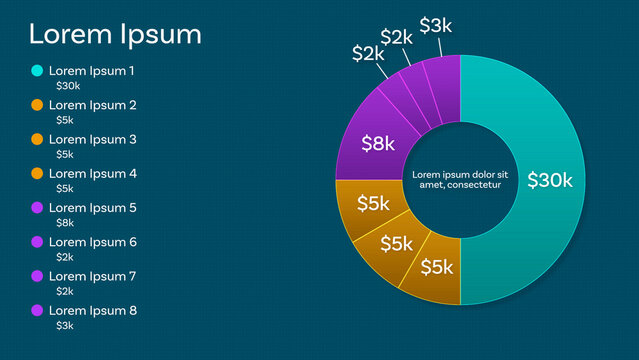
Responsive Pie Chart Mogrt for Clean and Modern Data Visualizations Design and Slide Presentation up to 8 Animated Data Points and Custom Text and Color with Percent Value Display Option and Paragraph
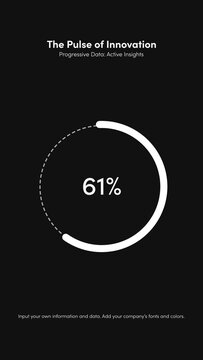
Social Interactive Data Visuals | With Control Panel for every Scene

HUD Neon Maps World Map x6
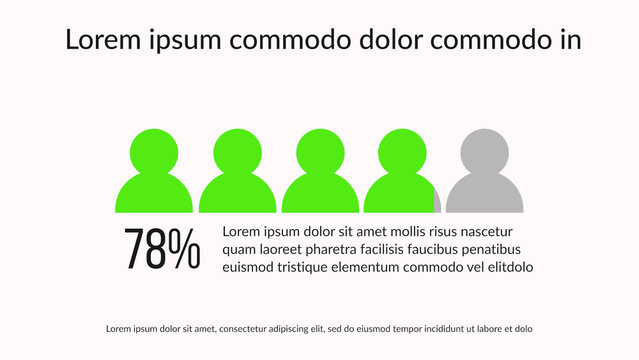
Infographic 08
Cryptocurrency Dashboard Template

Minimal Infographics Template | Business Reports, Charts and Graphs
Infographic Layout Set with Blue and Green Elements
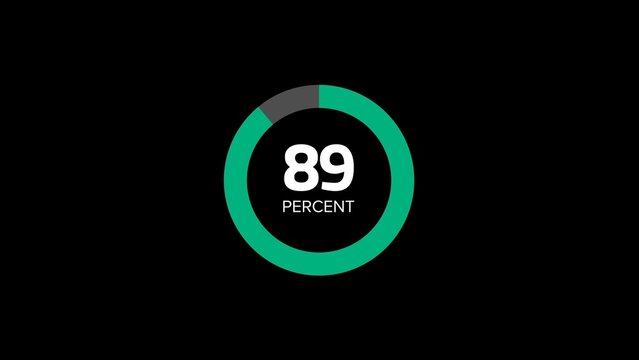
Circular Percentage Infographic with 3 Styles
Business Analysis Presentation Template, Corporate Report Deck, SWOT Strategy Pitch Slides
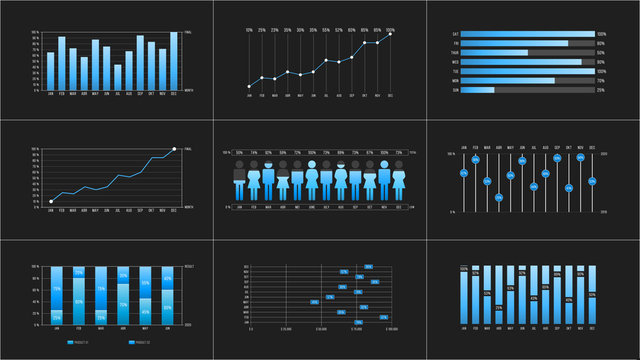
Infographic Charts
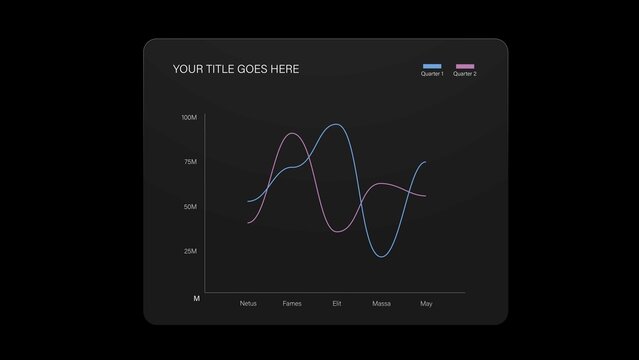
Line Chart Infographic Video Template
Annual Report Template Design
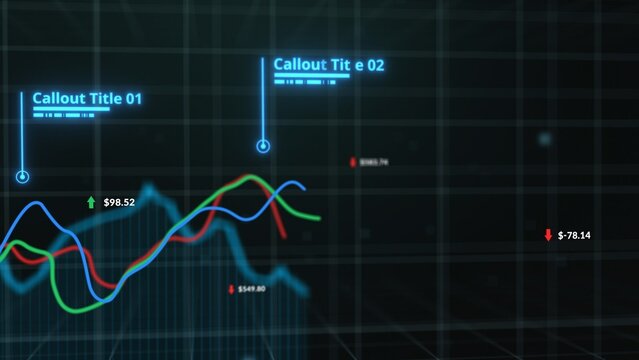
Stock Trading Animated Graph Title Template
Editable Chart Design with 6 Months Option
Data Analytics Black and White Outline Style Icons Set
High End Classy Capital Investment Presentation Deck Template with Illustrations
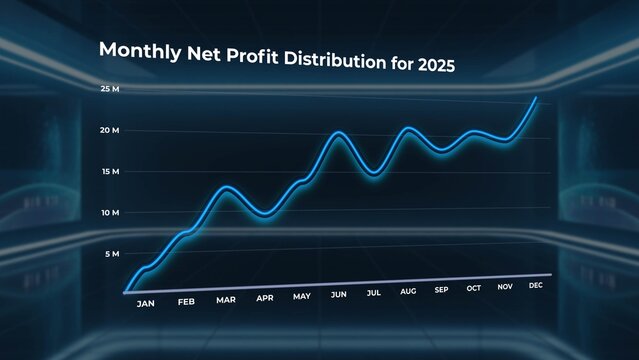
3D Glass Financial Line Chart
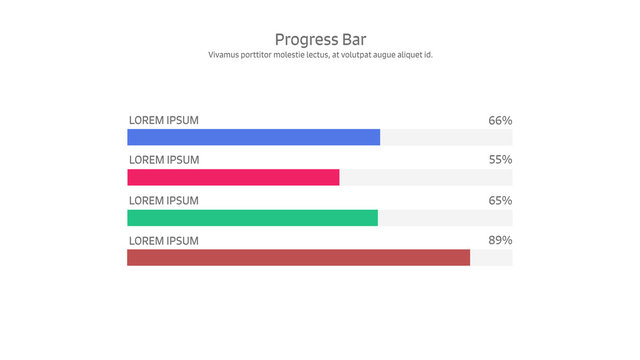
Progress Bar Infographic
Bento Box Dashboard UI Template, Modern Analytics Infographic Widgets, Admin Panel, App Dashboard Layouts
Annual Weekly Performance Infographic
Editable Graph Elements for Data Visualization Layouts
Saas Dashboard UI For An Email Analytics System
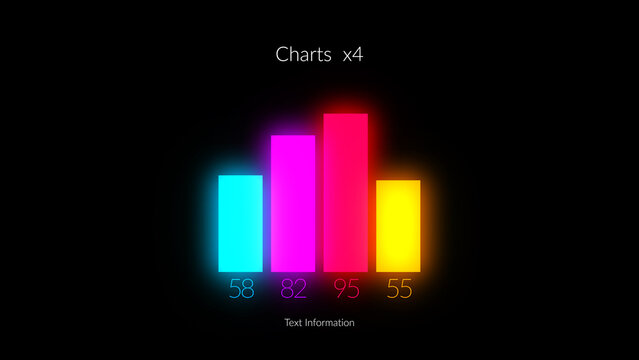
HUD Neon Infographics Chart Bars x4
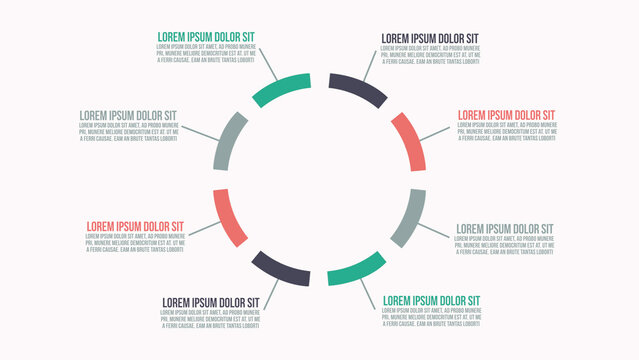
Infographic Animations
Stratis UI Analytics Model Graph Layout

Modern Infographics Elements | Data Visualization & Business Presentation
Modern Analytics Dashboard UI Kit Wireframe Design
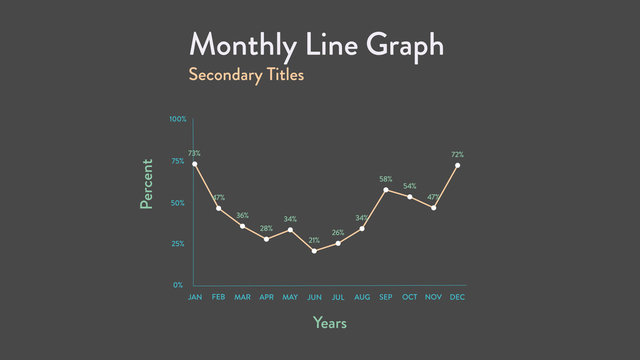
Monthly Line Graph Infographic
Modern Business Presentation Template for Creative Corporate Pitch Deck Layouts in Blue Hues
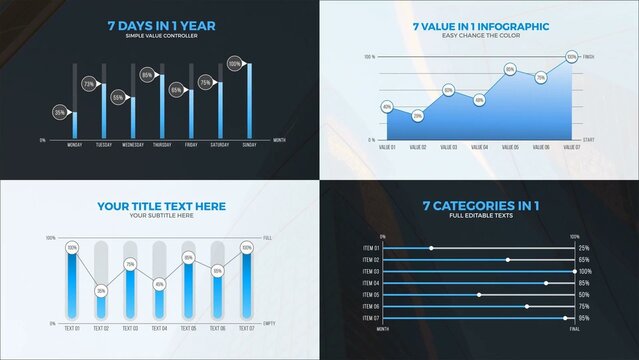
7 Value in 1 Infographic Charts
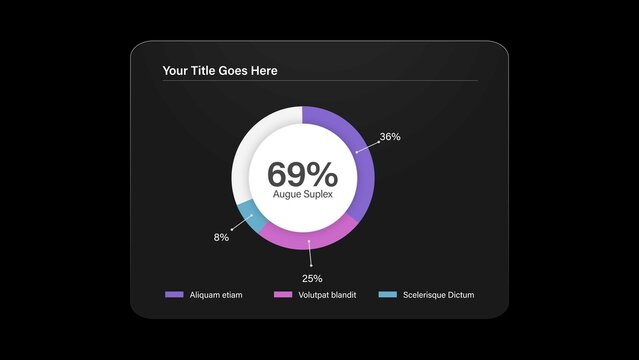
Infographic Pie Chart Animation Template
Data Compare Infographic Template
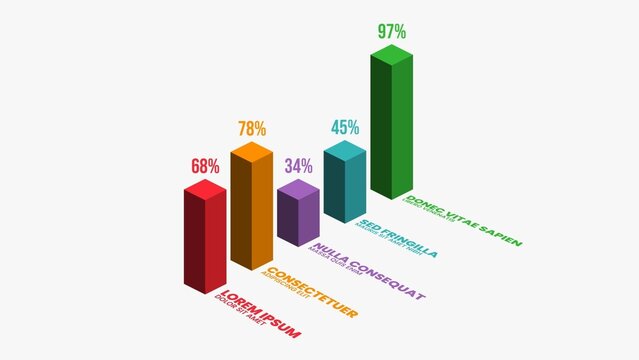
Clean Bar Graph Infographic Data Visualiser
Vertical Bar Chart Layout with Colored Paper Style Elements
Horizontal Status Graph Infographic 1
Editable Stacked Area Year on Year Chart with Increments Infographic Template
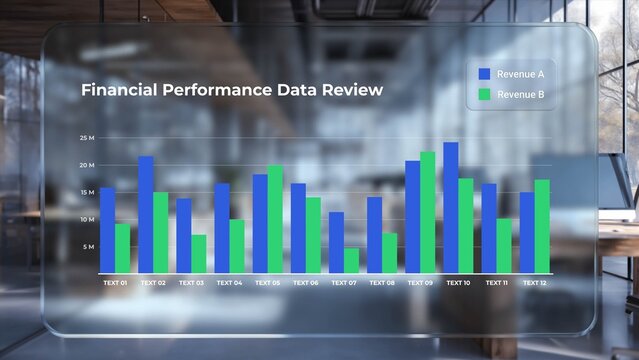
Glass Dashboard Bar Chart Infographic Template
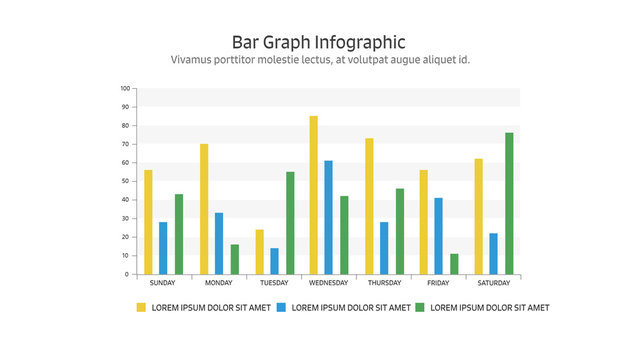
Multiple Bar Chart Infograph
Modern Annual Business Report & Financial Analysis Brochure Layout
365 Days Performance Infographic
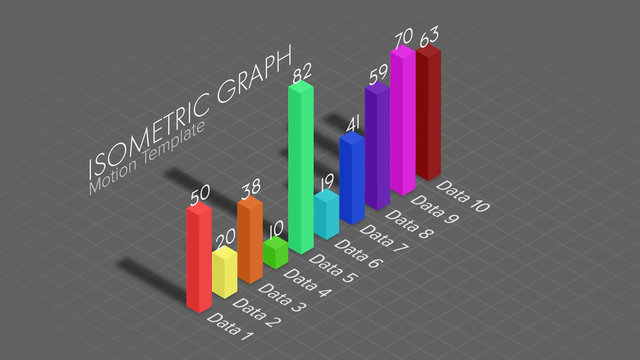
Isometric Graphs
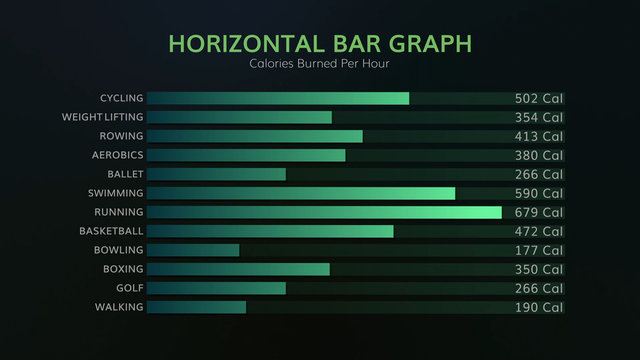
Data-Driven Horizontal Bar Graph Infographic
KOSTENLOS

HUD Neon Infographics Line Graph x5
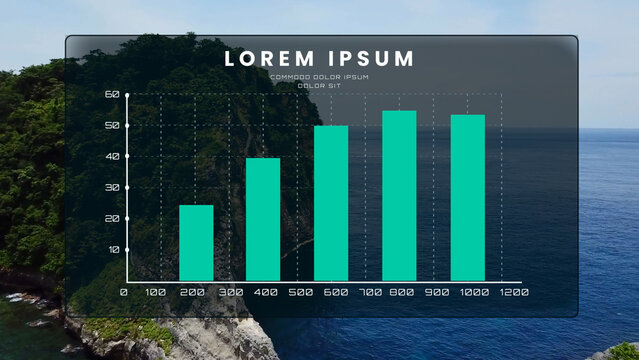
Infographics 04
Admin Dashboard Design
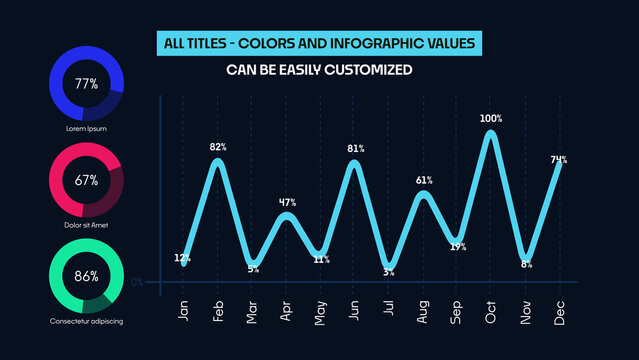
Animated Business Infographics | Charts, Graphs and Reports
Line Graph Infographic
Minimal Infographic