
Progress Stages Infographic Template with Filling Circles

SWOT Analysis Template

Question Mark Infographic Layout

150 Line Art Web Icons 1

SWOT Analysis Infographic 1

SWOT Infographic with Colorful Accents

Minimalist Line Graph Time Series Chart Infographic Template

Elegant Black Business Icons

Business Success Case Study Template

Colorful Productivity Business Finance Illustration Set

PESTLE Infographics Template

Daily Time Use Infographic

Iceberg Concept Infographic Layout

Shield Element Infographic with Grayscale Icon Set
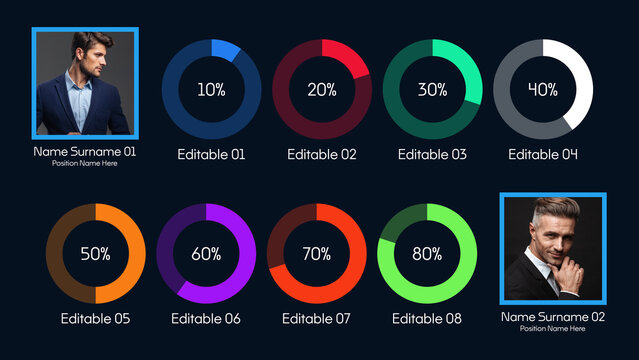
Personal Success Infographics | Animated Charts and Data Visualization for Achievement Analysis

Microscopic View of Coronavirus Disease Mockup

Conjunto de elementos de infografía
KOSTENLOS

Business Project Steps Infographic Template with Scaling Illustration

Minimalist Vertical History Timeline Infographic Template with Photos

Colorful Infographic Timeline Template with Key Points on thick colorful time line

Colorful Wavy Timeline Infographic Template with Key Dates

Business Growth Strategy Infographic Presentation Template with Arrow and Celebration Illustration

Progress Stages Vertical Infographic Template with Illustration

Infographic Timeline Template for the Whole Year - Modern Design

25 Business Services Icons

Line Graph Chart Infographic for Time Series in Business Presentation Layouts
Abstract vector illustration of flat and colorful time is money concept with long shadow. Design elements for web and mobile applications.
180 Circular Web Icons
Multipurpose Timeline Template Design with big teal square blocks
Gantt Chart Infographic
Vector set of analytics and investment line web icons. Each icon with adjustable strokes neatly designed on pixel perfect 64X64 size grid. Fully editable and easy to use.
SWOT Analysis Infographic 4
SWOT Analysis Diagram Template
Business and Finance Icons Set
25 Business and Finance Icons
PESTLE Analysis Infographics
25 Flat Square Business and Productivity Icons 1
Business Tasks Illustration Design Set
PEST Analysis Infographic Template for Business Strategy and Market Research
Vector set of business management flat line web icons. Each icon with adjustable strokes neatly designed on pixel perfect 48X48 size grid. Fully editable and easy to use.
Vector illustration of flat and colorful time management concept. Design elements for web and mobile applications.
180 Colorful Icons 1
Characteristics of Project Plans - Diagram Schema
36 Business and Finance Icons
SWOT Analysis Infographic 3
Pest Analysis Schema Infographic Diagram Concept Dark Template
30 Circular Flat Business Icons 1
KOSTENLOS
Pest Analysis Schema Infographic Diagram Concept Template
Dark PEST diagram infographic template with four factors items - political, economic, social and technological
25 Multicolored Minimalist Icons
Line Graph Time Series Chart Infographic Template in Modern Minimal Style
Colorful Question Mark Infographic Layout
Vector set of office and business flat line web icons with grunge noise texture effect.
Investment Icons Set
Line Graph Time Series Chart Infographic Template
Gear and Arrow Element Business Infographic with Grayscale Icon Set
Web Icons Set 01
Modern Multipurpose Timeline Infographic Template showing steps and progress over time on Dark Background
Line Graph Time Series Chart Infographic Template
Colorful Dark Thick Line Timeline Graphic Template with five Milestones
Colorful Education School Science Knowledge Learning Illustrations Set
25 Business and Finance Icons
Colorful Social Media Infographic Analysis Design Template
25 Colorful Business and Finance Icons 1
Overlapping Tile Infographic
Business and Finance Icons
Investment Icons Set 02
Neumorphic Infographic Circles Template with Business Icons
Colorful Thick Line Timeline Graphic Template with five Milestones
Purple and Orange Finance Time Budget Business Infographic
25 Business and Finance Icons
Rainbow circles project management mind map scheme diagram made
Vector illustration of flat and colorful social campaign concept. Design elements for web and mobile applications.
Mosaic Tile Infographic
PEST diagram infographic template with four factors items - political, economic, social and technological
Colorful Three and Four Step Infographic Layouts
20 Yellow and Cyan Marketing Analytics Icons 1
Abstract flat vector illustration of business news concept. Elements for mobile and web applications.
Corporate Business Icons Set 02
Line Graph Time Series Chart Infographic Template in Modern Minimal Style
Horizontal Status Graph Infographic 1
Colorful Circles Mind Map Layout
20 Flat Two-Color Analytics Icons
150 Assorted Circular Web Icons
PEST Analysis Infographic Template for Business Strategy and Market Research
Business and Finance Icons Set 02
25 Flat Colorful Business Icons
Black And White Circular Clock Workflow Infographic Template
Multilayered 3D Infographic Design Template with Steps and Icons
Business and Finance Icon Set
Investment Icons Set
Vector set of innovation and business planning line icons. Pixel perfect 48X48 size grid with adjustable strokes. Professional symbols for corporate strategy, investment and global management
Colorful Shaded Line Graph Layout
Wheel and Thumbs Up Element Business Infographic with Grayscale Icon Set
25 International Business Icons
25 Flat Business Icons
PEST Analysis Infographic Template with Political, Economic, Social, Tech Factors
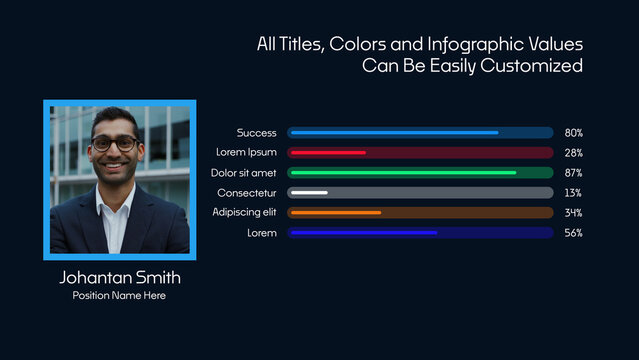
Personal Success Infographics with Image | Success, Growth, Productivity and Motivation Data Visualization
Colorful Vertical Bar Graph Layout
Minimalist Line Graph Time Series Chart Infographic Template