Odkaz k nastavení vašeho hesla byl poslán na adresu Do budoucna budete k přístupu ke svým nákupům potřebovat heslo.
Získejte 3 videa nebo 25 obrázků v rámci bezplatné zkušební verze.
Byly přidány nové filtry
Uspořádat podle

53 117 výsledků pro variable data v kategorii videa

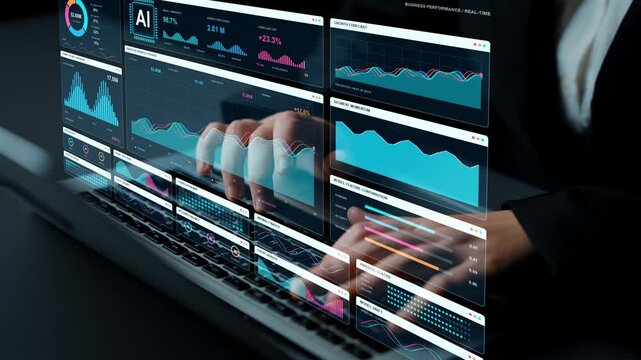
Hands type on a laptop. Business intelligence combines revenue composition and cohort analysis with AI forecasts, offering several views of performance and emerging data changes.
00:12
HD
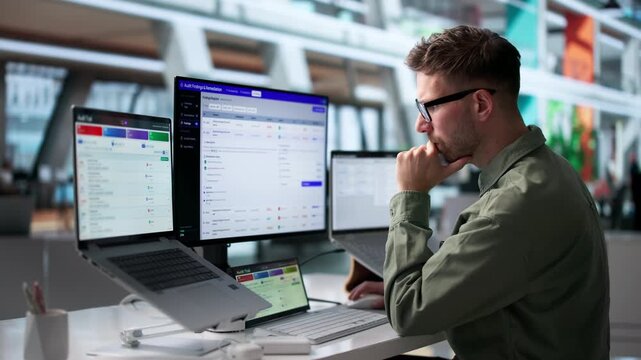
Internal Auditor Reviews Laptop Data
00:18
HD
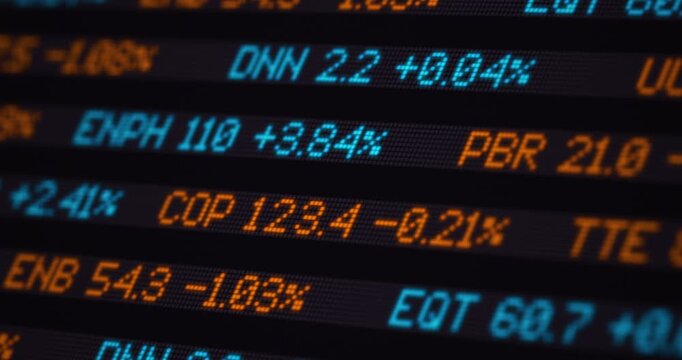
Energy stocks market quotation ticker board, commodities prices electronic yield table, financial market scrolling LCD board close-up, footage
00:30
HD
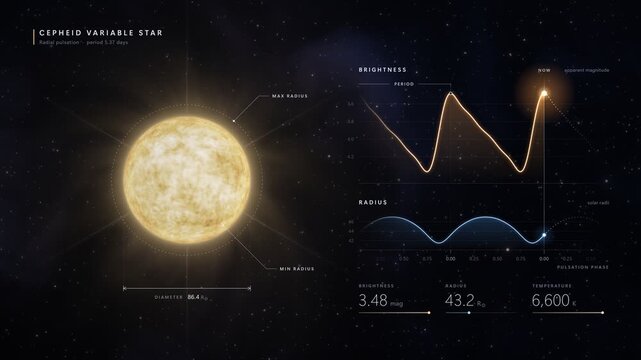
Cepheid variable star pulsation cycle infographic with astronomical data graphs in deep space
00:15
HD
Computer, screen and people with satellite, data and broadcast for news research. Discussion, ecology and weather team with forecast for media report, meteorology update and climate change map study
00:05
HD
Live data on an Excel spreadsheet with cells changing colours and calculations
00:30
HD
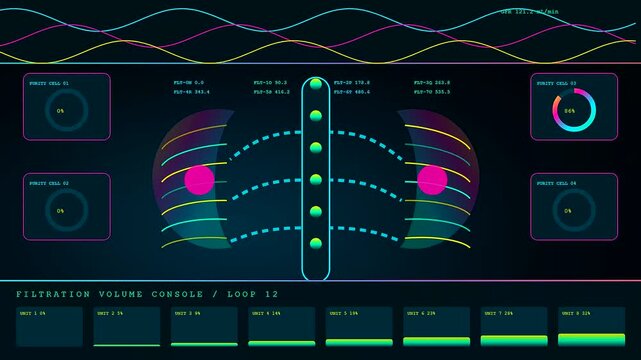
Medical recovery analytics shown through vibrant digital lung diagrams with changing statistics and fluctuating data wave patterns on a dark screen interface for health monitoring systems
00:06
HD
Warehouse optimization systems are displayed across three digital panels featuring neon glowing graphical interfaces with changing flow charts and data metrics for industrial logistics software
00:06
HD
Explore an AI Portfolio Risk Forecasting Dashboard that predicts exposure changes and identifies emerging vulnerabilities through animated data visualizations and neural network aesthetics.
00:15
HD
File exchange, information data transfer between two laptops, website migration concept, changing website structure syncing data from web sources, video animation 2d clip.
00:08
HD
Seamless looped abstract visualization of financial data, price fluctuations, investment analysis and trading activity. Financial market interface with changing charts. Forex trading concept
00:10
HD
Scattered green zeros ones glow over source code a deep blue backdrop. digital composition coding workflows, information systems algorithmic concepts in software, data science technology stories. 3D
00:20
HD
A digital graph shows stock market performance with lines and bars. The blue and red lines represent different data trends. Data points highlight changes in values over time.
00:10
HD
Seamless loop 3D animation of a stock market ticker table with orange red negative price changes and numeric rows on a dark screen, ideal for trading, finance, news, and analytics.
00:10
HD
Three panels showing algorithmic trading data with complex moving wave graphs and changing numerical values inside a dark digital interface screen of a financial monitoring system
00:06
HD
Futuristic digital access denied warning interface with glowing red neon frame and rapidly changing numerical data stream for cyber security, system error, and unauthorized network intrusion concepts
00:10
HD
Expanding and Growing Neural Network from Center Core to Large Scale and Complex Web with Nodes and Connections. AI, Computer Algorithms, Artificial Intelligence and Large Language Model Visualization
00:14
HD
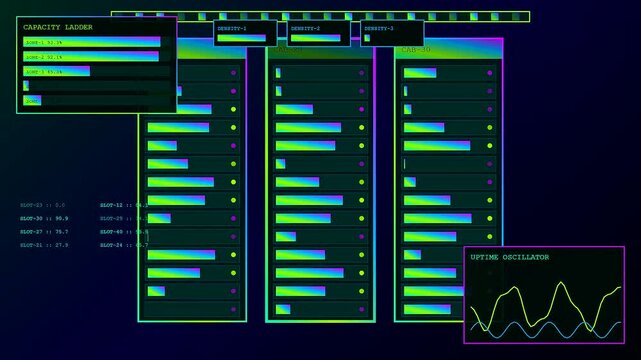
the silicon security mainframe grid displays dynamic server rack data updates with changing graph node topology and probe density monitoring statistics shown in multiple sequential digital frames
00:06
HD
Complex digital biometric validate interface showing moving wavy neon lines and segmented graphs on a dark screen panel for advanced data monitoring and system analysis
00:06
HD
When opening dark wireframe grid, teal HTML code snippets scrolling clustering forming data tunnel
00:12
HD
A digital audio console interface displaying evolving flow data within multiple monitor panels showing changing graphs and network routing connectivity in a vibrant neon aesthetic style
00:06
HD
Auditor And Team Reviewing Data Logs For Compliance
00:20
HD
Futuristic global social media, people network and tacit digital data sharing . Concept of smart digital transformation and technology disruption that changes global trends in new information era .
00:24
HD
Dynamic progress bar representing variable levels of change from low to normal to intensity with a moving indicator for data visualization, analytical reporting, and business performance metrics
00:10
HD
Financial trading terminal screen with live market ticker data streaming price changes percentage indicators trading volume and trend arrows on dark monitor display
00:12
HD
Close-up stock market ticker tape, exchange data, prices, percentage changes and arrows up or down. Trading strategy, market data, business, investment, analyzing data, risk, wealth, financial markets
00:12
HD
Digital recovery analytics interface showing wave patterns changing color states on a black screen display that evolves through a process of continuous data stream monitoring
00:06
HD
Volumetric diagnostics display showing shifting data streams in a dark digital monitoring interface with pulsating light nodes and changing numerical values across multiple screens
00:06
HD
Abstract digital arrow pointing upwards, representing growth and progress in the future
00:08
HD
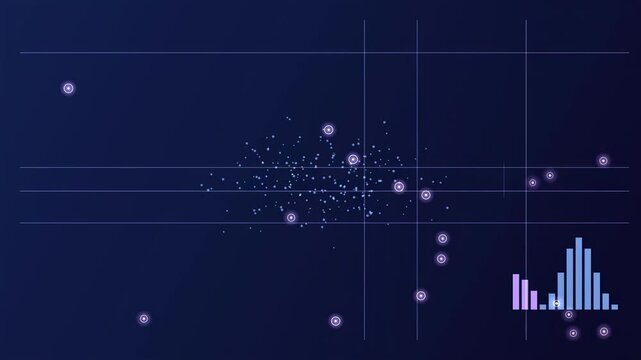
Scatterplot displays data points, histogram shows distribution. Blue tones dominate, creating abstract visualization.
00:07
HD
Abstract technology background, concept big data and digital transformation. Futuristic network connection. Modern innovation in computer science. Information system analysis. business communication.
00:10
HD
A finance monitor displays real-time stock market data fluctuating prices, exchange rates, and indices. An investor reviews current quotes and market trends on the screen
00:14
HD
Financial market trends are shown using colorful lines and bars on a dark background with visible data points.
00:10
HD
Digital dmx controller display showing active node network monitoring interfaces with changing color data visualizations in a complex light management system for event production stage setups
00:06
HD
Futuristic representation of cybersecurity, highlighting resilience in digital systems. Challenging digital landscape background. Protection mechanisms defend against risks in an changing cyber world
00:10
HD
Digital login failed warning interface with glowing red neon warning triangle and rapidly changing data streams for cybersecurity, network security breach, and system access error concept animation
00:10
HD
Abstract blue background with lines and dots that resemble news data streaming across a digital landscape
00:10
HD
Detailed crypto ledger animation displays shifting progress bars and changing data values on a deep purple digital dashboard for a modern decentralized voting system
00:06
HD
Monitoring a pipeline automation interface showing three glass beakers with colorful chemical fluids and changing numerical data points within a dark digital laboratory display screen environment
00:06
HD
Woman at laptop shifting to animated finance charts leaning and showing data while charts changing
00:12
HD
Map with Stock market Global earth map rotating 3D 4K Digital animation. World breaking news Studio Background for stock market news report and breaking news on world live report. Business
00:20
HD
Auditor And Analyst Reviewing System Logs
00:20
HD
Marketing team gathering in a information sharing meeting to study updates on regulatory changes or industry standards. Business employees reviewing all data analysis reports. Camera B.
00:26
HD
Dynamic pressure gauge indicator motion showing variable levels from low to normal and intensity settings for industrial monitoring, stress management analytics, and performance data visualization
00:10
HD
A varied and diverse group of skilled business professionals gathers together in a spacious conference room, actively collaborating on analyzing financial data and discussing intricate sales reports
00:14
HD
Dynamic stock market board showing changing percentage of profit and loss. Financial trading screen with red and green volatility indicators
00:08
HD
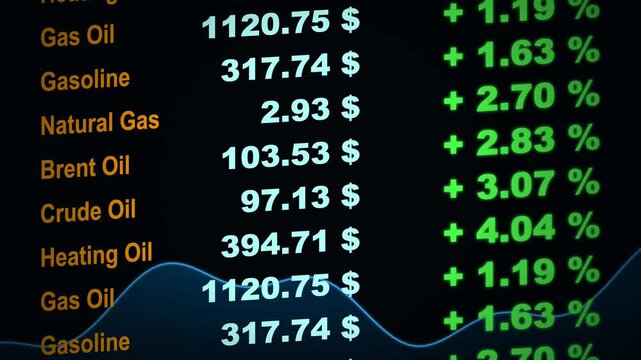
Financial market data screen with changing energy prices
00:10
HD
A high tech interface displays a global logistics route with moving data points and changing statistics for monitoring international shipping and transportation fleet operations.
00:06
HD
Medium shot of a printing press producing vibrant mail pieces with personalized names and dynamic offers highlighting advanced variable data printing technology.
00:06
HD
Cloud computer and online data storage with tacit intelligent sharing software . Concept of smart digital transformation and technology disruption that changes global trends in new information era .
00:24
HD
Tracking shot of female stock trader checking stock market data using mobile phone, scrolling, touching stock market chart on touch screen device, blurred computer monitor with chart of background.
00:14
HD
Financial data analysis, rising line graph and numbers over silver coins for accounting and investment
00:13
HD
Lines and bars represent stock prices over time. Numbers indicate values while patterns show fluctuations in the market. This data is part of financial analysis.
00:10
HD
Stock market and exchange data of price at market wall. Change and volume. Financial indexes change up and down over time. Concept of cryptocurrency and bitcoin BTC crypto trading
00:10
HD
Visualize how ERP digital data directly causes physical business operations and supply chain activities to change.
00:10
HD
Dynamic technology gauge animation featuring a moving needle indicating variable performance levels from low to for digital progress tracking, data analysis, and modern business performance monitoring
00:10
HD
Code Display
00:09
HD
A digital virtual lab interface displays complex geometric molecular structures with synchronized data streams changing across three distinct panels on a dark purple electronic monitoring monitor
00:06
HD
Digital dna sequence data biometric validate interface with changing statistical graphs and illuminated circular progress bars shown on a dark computer monitor for medical research analysis
00:06
HD
Changing multiple collage view different people using diverse devices, closeup
00:15
HD
A young trader girl intently tracks real-time stock market fluctuations, her glasses reflecting the changing numbers on the screen, as she analyzes market trends with focus and precision
00:12
HD
Mature Businessman Reviews Document Management System
00:23
HD
Dynamic financial market data visualization with animated graphs and changing metrics
00:05
HD
Cyber hacked warning alert with neon glowing digital interface and rapidly changing ip address data streams for cybersecurity breach notifications, network security threats, and information
00:10
HD
Close up of software developers sitting at an office desk to discuss machine learning code scripts and system architecture changes on a desktop monitor.
00:10
HD
Global satellite view of a powerful hurricane with detailed weather data. Climate change and extreme weather event monitoring. Global warming footage.
00:08
HD
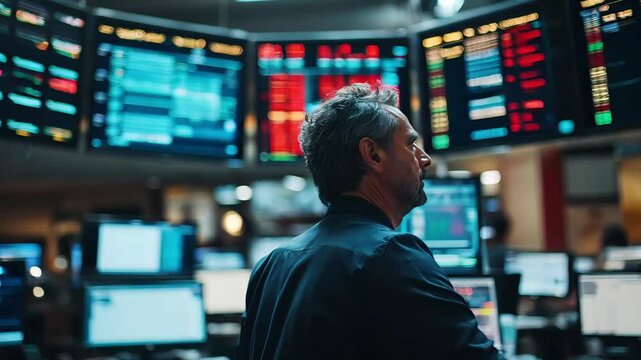
Trading room with brokers reacting to sudden changes in U.S. Treasury yields. Traders are watching the screens as bonds prices, interest rates fluctuate. Digital ticker boards display real-time data
00:05
HD
Digital displays showing complex servers telemetry data updates as oscillating waveforms and vertical bar charts cycle through varying metrics in a dark virtual interface environment setting
00:06
HD
A network of ocean floor sensors connected through 5G monitor changes in pH levels and collect data on ocean acidification aiding in understanding the impacts of climate change on marine
00:06
HD
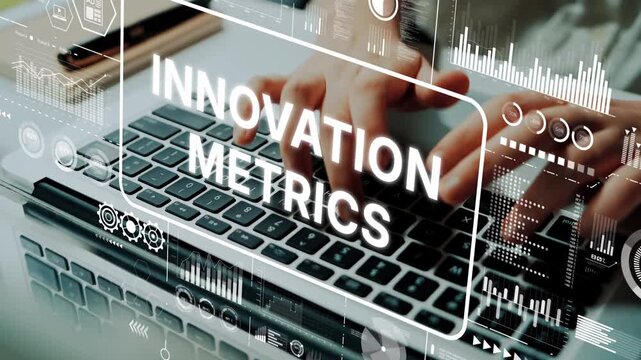
Hands Typing on Laptop Keyboard with Digital Innovation Metrics Overlay for Data Analysis and Technology Insights. Asymptotic smart data analytic.
00:17
HD
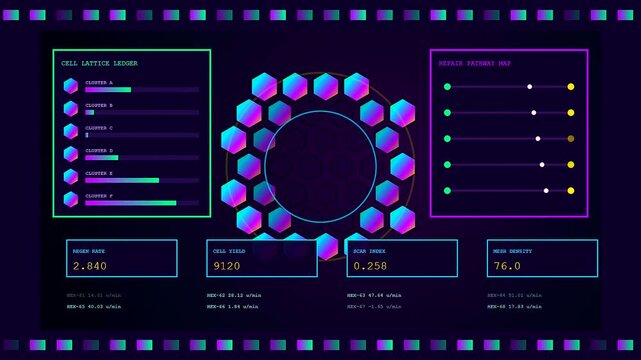
Three screens displaying recovery analytics in a glowing digital sequence showing changing biological data sets with colorful hexagons and numerical progression on a dark interface panel
00:06
HD
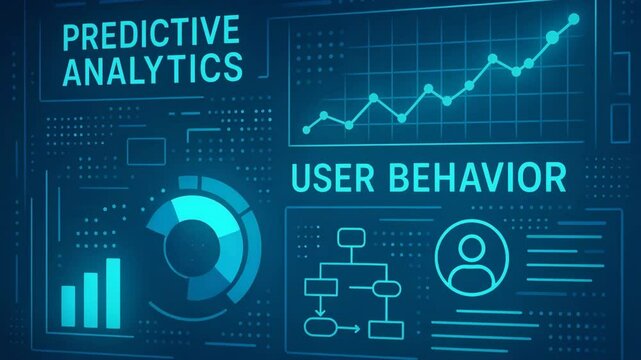
Futuristic data visualization showing predictive analytics and user behavior metrics. Displays charts and graphs representing trends, user engagement, and data flow.
00:05
HD
Graph shows changing data values over time indicating trends in a digital format with varying heights of bars.
00:10
HD
Cyber security access denied warning interface with glowing red neon frame, digital data streams, warning triangle and rapidly changing numerical code sequences for advanced network protection
00:10
HD
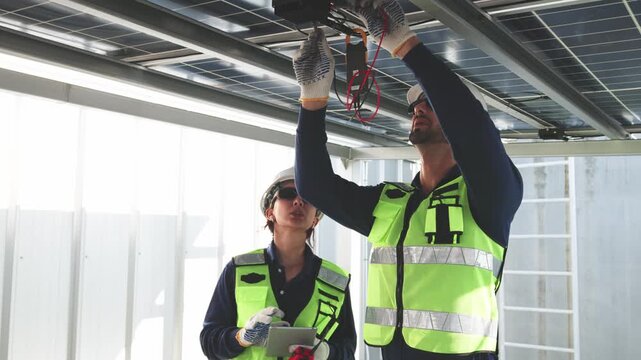
Two solar technicians installing and inspecting microinverter wiring beneath rooftop photovoltaic panels while reviewing system data on a tablet.
00:11
HD
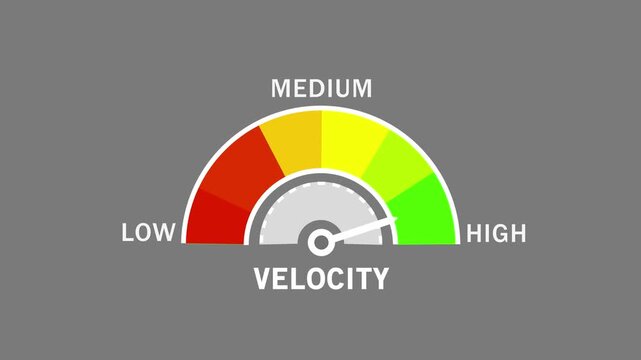
Dynamic velocity gauge meter animation showing variable speed levels from low to with a moving needle indicator for performance tracking, data visualization, industrial monitoring, and analytics
00:10
HD
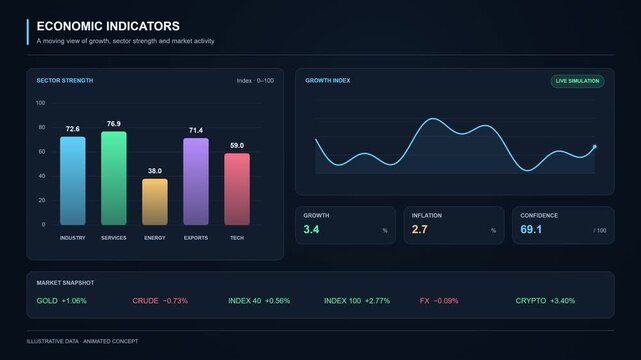
Animated economic indicators dashboard with changing sector bars and a growth index graph. GDP, inflation and confidence figures update on a dark interface, illustrating financial data monitoring.
00:15
HD
Displaying kinetic harvesting data through changing digital interface grids with neon charts and fluctuating metrics in this simulated screen sequence for modern data monitoring analysis displays
00:06
HD
Urban crowd experiencing digital transformation in a bustling city street
00:05
HD
Global Stock Market Animation with Digital Tickers, Financial Charts and Changing Prices. Market data business concept.
00:20
HD
Abstract computer code displayed on a computer screen showing software development process.
00:08
HD
Young Female Office Manager Efficiently Organizing Documents
00:20
HD
Spreadsheet with changing data and hand holding pen pointing to numbers
00:14
HD
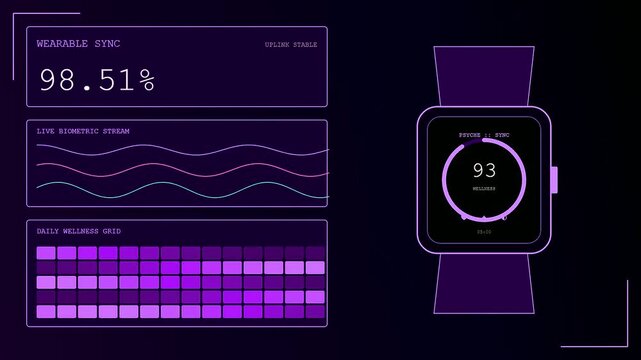
A digital dashboard displays realtime mental health monitoring data as biometric waves fluctuate and smart watch sync numbers dynamically change on screen
00:06
HD
Urgent cyber security alert displaying credential leak warning with glowing neon red warning triangle and rapidly changing digital data streams on a dark background, for network protection concepts
00:10
HD
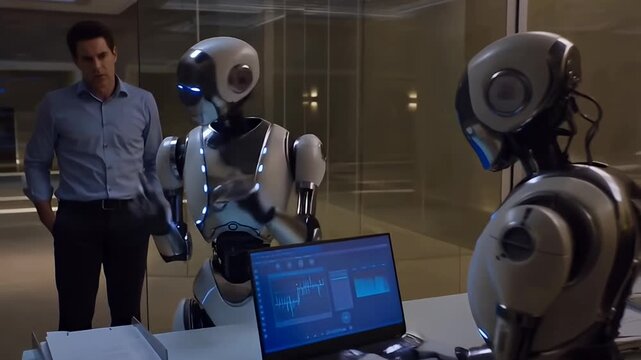
Two AI robots typing and analyzing data on laptop while businessman looks at them in disbelief in futuristic office. Businessman supervising robots while fearing being replaced
00:05
HD
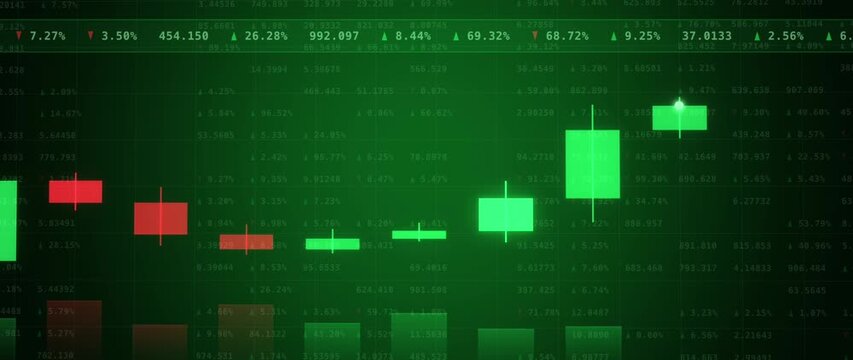
Green financial candlestick chart displays rising price bars over changing market data
00:10
HD
Precision farming data shows automated plant monitoring systems within a digital greenhouse interface with changing environmental metrics displayed in a graphical format for agricultural monitoring
00:06
HD
Innovative agricultural technology uses sensors and data analysis, optimizing crop growth, increasing efficiency, and promoting sustainable farming practices in modern agriculture
00:07
HD
Business data analytic with tacit intelligent software making marketing strategy . Concept of smart digital transformation and technology disruption that changes global trends in new information era .
00:24
HD
Stock Market monitor screen while open market for trading sell and buy stock online. Business economic and finance concept.
00:22
HD
Flying Through Network of Colorful Icons, Connections and Nodes Illustrating Social Media Content and Complex Algorithms. AI Neural Network, Chatbot, Artificial Intelligence, and LLM Visualization
00:13
HD
The scene shows a display of wave-like patterns formed by tiny dots in varying shades of blue against a black background. This artwork represents digital data and technology.
00:10
HD
Digital bim modeling data displayed on dark monitors showing three changing isometric building structures with glowing lines and metrics for engineering and architecture design project
00:06
HD
A screen displaying dynamic pricing data with glowing seat maps and statistical flight analytics showing variable revenue trends across multiple simulated air travel passenger digital portals
00:06
HD
A visual representation of balance in analytics, featuring data graphs and a scale. This image signifies the importance of data analysis and decision-making in business.
00:05
HD
Financial data processing against blue background
00:15
HD
Stock market and information of exchange with data of price on market wall. Change and volume. Financial indexes change up and down over time. Concept of trading cryptocurrency assets and bitcoin
00:15
HD
Digital data processing concept. Fast travel through abstract cloud of variable code, ciphers, digits, letters, secure programs or other encrypted information
00:10
HD
Digital data streams flow into each other - movement of series of random varying binary code digits in blue color
00:15
HD