Odkaz k nastavení vašeho hesla byl poslán na adresu Do budoucna budete k přístupu ke svým nákupům potřebovat heslo.
Získejte 3 videa nebo 25 obrázků v rámci bezplatné zkušební verze.
Byly přidány nové filtry
Uspořádat podle

19 524 výsledků pro increase and decrease v kategorii videa

Animation graphics business growth icon. Business charts. Clean White background icon 4 k video...
00:06
HD
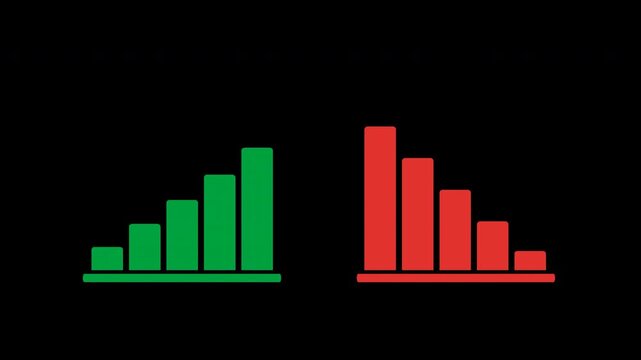
A comparative visualization of increasing and decreasing bar charts representing percentages, against a dark, futuristic background. The increasing chart is red, and the decreasing chart is blue
00:10
HD
22 seconds Countdown timers with decreasing numbers during a subtle digital transition for business analytics
00:22
HD
Abstract decrease icon on black background. Reduce cost concept with dollar and down arrow animation.
00:10
HD
Cost reduction and cost saving through digital transformation, business cost optimization, operational cost reduction, financial savings, and resource efficiency strategies for business success. Muxer
00:20
HD
Zoom in and out animation the sparkles symbol. Large black symbol in the center and four small symbols around. Seamless looped 4k animation on white background
00:12
HD
Stock market concept featuring green upward arrow and red downward arrow on financial chart background with candlestick chart symbolizing investment growth decline finance and market trends
00:08
HD
Blue line graph showing fluctuating financial data on a dark background
00:10
HD
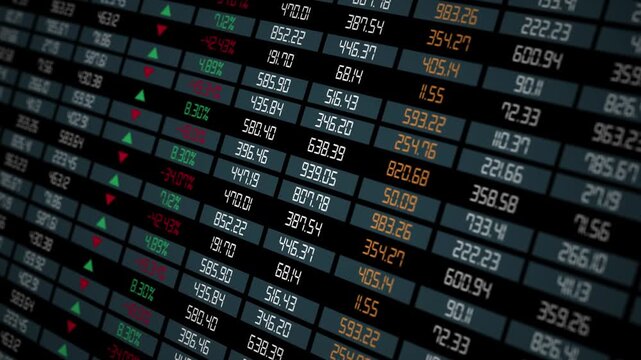
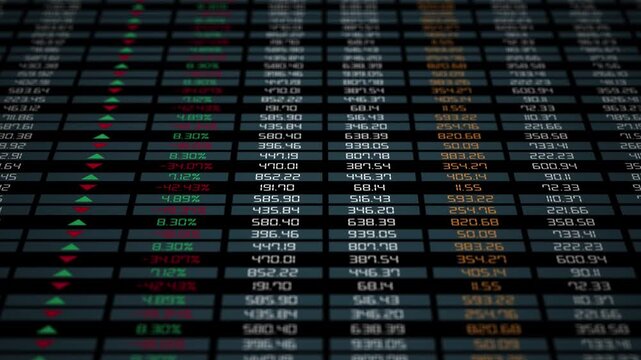
Finance fund stocks price increase and decrease charts arrow up and down, ticker display. table grid Stock exchange screen number with financial trade index rates
00:20
HD
Corporate Revenue Growth Dashboard Animation with Positive Trend Visualization
00:13
HD
Abstract decreasing business graph chart animation background. Indicate revenue decline, financial loss, negative growth, and market decrease performance 4k
00:10
HD
Red glowing chart graph on black background
00:10
HD
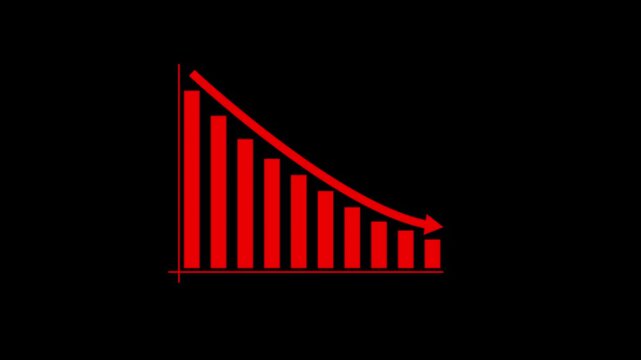
Declining business bar chart with downward arrow representing falling sales, reduced revenue, financial losses, market decline, decreasing performance.financial loss icon.
00:10
HD
Abstract decrease icon on green background. Dollar rate down looped icon. Reduce costs sign and symbol. Motion graphics of concept. animation
00:06
HD
Animated Bar Chart for Data Visualization
00:10
HD
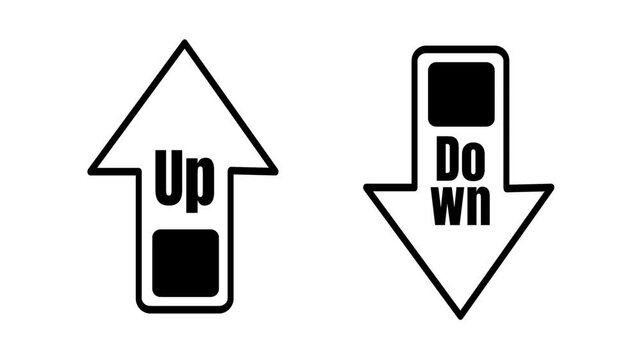
Black and white icons of an up arrow and a down arrow with words Up and Down and solid squares representing increase, decrease and change in trends
00:10
HD
Business growth concept in graph chart animation on black background. Statistics bars columns growth, positive increase chart. Increase graph icon suitable for business and finance concepts
00:08
HD
Financial Data Display Showing Green and Red Stock Numbers with Dynamic Market Graphs and Charts for Stock Trading, Crypto Investment, and Global Forex Business Motion Graphics.
00:15
HD
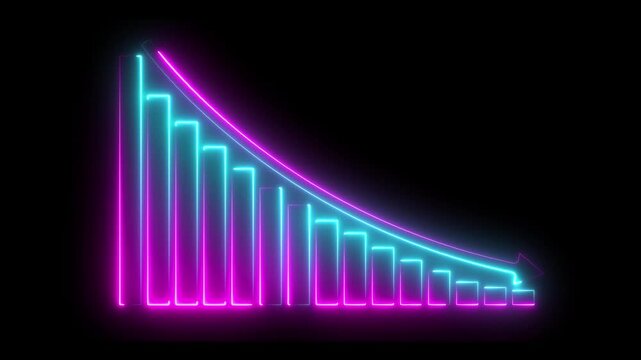
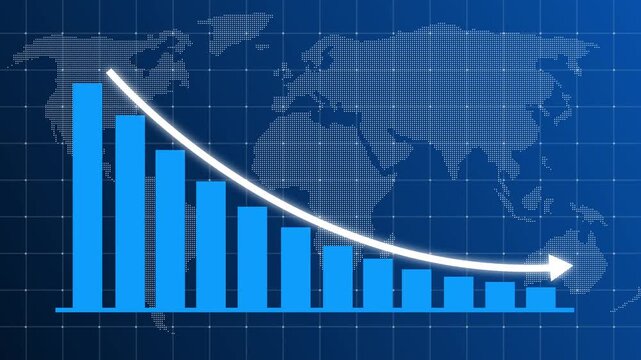
Neon blue bar chart showing a downward trend with a diagonal arrow pointing down, symbolizing financial loss, decrease in stock, or negative business growth.
00:10
HD
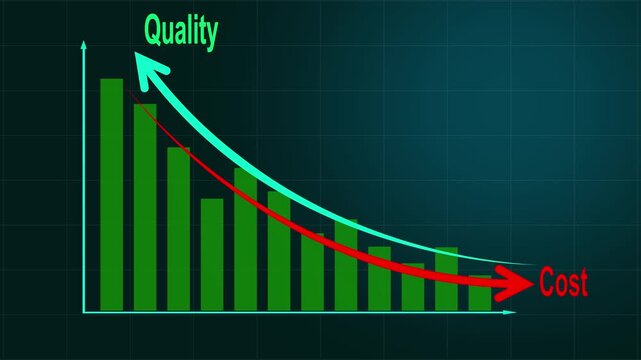
Cost reduction and quality improvement concept. Teal bar chart with line arrow falling cost and quality increase. Successful business strategy, efficiency, product optimization and management
00:10
HD
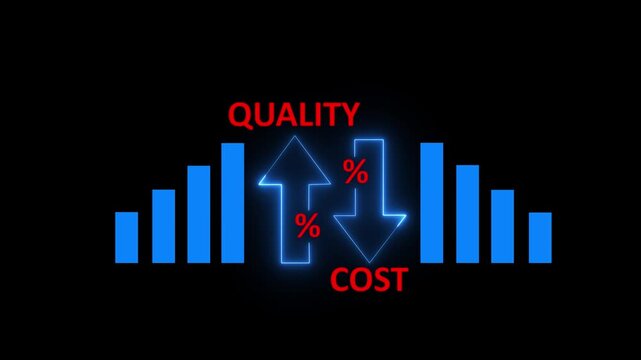
Quality Improvement and Cost Reduction Business Strategy Showing Rising Quality and Decreasing Costs for Operational Efficiency and Competitive Performance
00:10
HD
Business Statistics Bars, Up and Down Arrows, Looping Animation, Data Analytics, 4K Transparent Video with Alpha Channel
00:08
HD
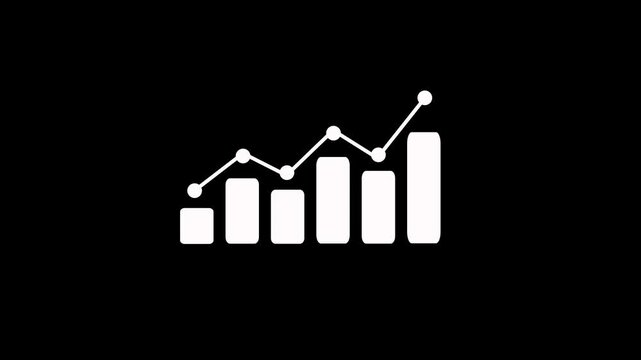
Abstract chart with bar graph and line graph showing business data trend animation
00:09
HD
Quality control and cost reduction concept. Graph bar chart line arrow quality increase and falling cost. Successful business strategy, efficiency, product optimization and planning management, 4k
00:10
HD
Cost reduction and cost saving through digital transformation, business cost optimization, operational cost reduction, financial savings, and resource efficiency strategies for business success. Spire
00:20
HD
Large black magic wand symbol zooms in and out at the center, surrounded by four small copies. Seamless looped 4k animation on white background
00:12
HD
Glowing neon line graph showing data growth on dark background
00:08
HD
Dynamic Graphical Representation of Data Trends and Patterns.
00:07
HD
Stock market trading graph in red as 3D illustration background showing economy trading trends, financial crisis, economic development and investment decline concept
00:20
HD
Financial Report Presentation Animation with Business Growth Visualization
00:06
HD
Falling bar chart with a downward line and rising arrows animation, Business chart with rising arrows decline
00:09
HD
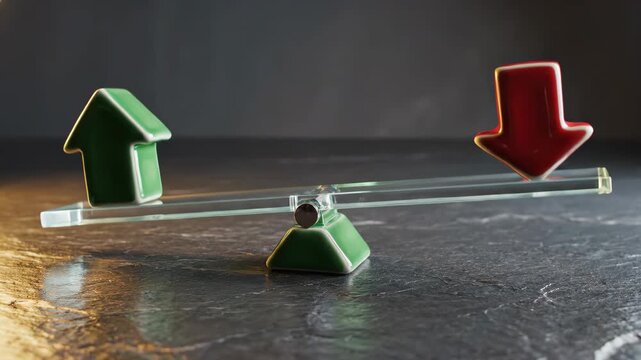
Green up arrow and red down arrow balanced on a seesaw represent market trends
00:07
HD
glowing neon line business graph growth arrow to down arrow. Financial business Loss down graph chart with red neon line, glowing red neon downward graph with arrow indicating decline, 4k video
00:10
HD
Business growth concept in allusive graph chart showing marketing sales profit increasing to future target . Excellent share market status of corporate business rise up 4k motion video...
00:10
HD
Quality increase and cost optimization for products or services to improve customer satisfaction and enhance company performance. Successful corporate strategy and management. Effective business.4k
00:10
HD
Red Line Graph Showing a Downward Trend on Dark Background
00:15
HD
Business graph chart arrow line down white color animation on black background. growth concept white moving.
00:15
HD
Dynamic bar chart animation on shelf, showing progressive growth and decline, representing business analytics, financial performance, and data visualization
00:05
HD
Climate Change Bar Chart: Rising Temperatures and Global Warming Trends
00:10
HD
Business graph chart drop circle with down arrow moving animation on green background. Decreasing business graph and down arrow for business loss falling, bad economy recession concepts
00:10
HD
Abstract decrease icon on White background. Dollar rate down looped icon. Reduce costs sign and symbol. animation. 4k video...
00:10
HD
Abstract chart with bar graph and line graph showing business data trend animation
00:09
HD
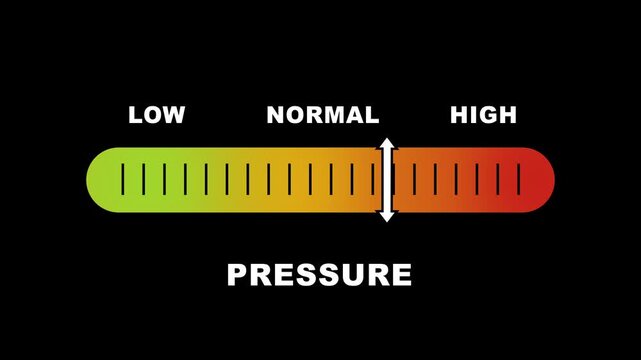
Pressure level indicator scale. Low normal high meter infographic animation on black background. Showing high pressure level color gauge indicator for health monitoring and safety analysis.
00:10
HD
Cost reduction and cost saving through digital transformation, business cost optimization, operational cost reduction, financial savings, and resource efficiency strategies for business success. Elide
00:14
HD
Zoom in and out animation the bookmark symbol. Large black symbol in the center and four small symbols around. Seamless looped 4k animation on white background
00:12
HD
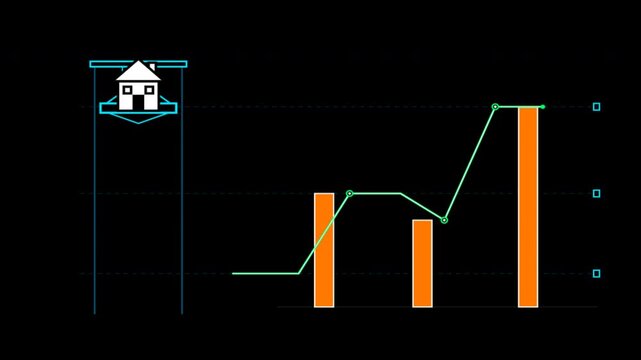
Housing market trend motion with property value bar charts. 4k
00:08
HD
Cost reduction icon with down arrow for budget management and cost management. A downward arrow, representing cost reduction and financial efficiency. decreasing costs and quality control concept.
00:06
HD
Finance fund stocks price increase and decrease charts arrow up and down, ticker display. table grid Stock exchange screen number with financial trade index rates
00:20
HD
Financial Report Presentation Animation with Business Growth Visualization
00:10
HD
White business graph chart growth up down or signal on transparent background with alpha channel. Business up and down signal concept animation in 4k.
00:10
HD
Animated Bar Chart Graph Visualization Data Analysis and Growth Concepts
00:08
HD
Business growth concept in graph chart showing marketing sales profit increasing to future target on black background. business graph success animation 4k video
00:10
HD
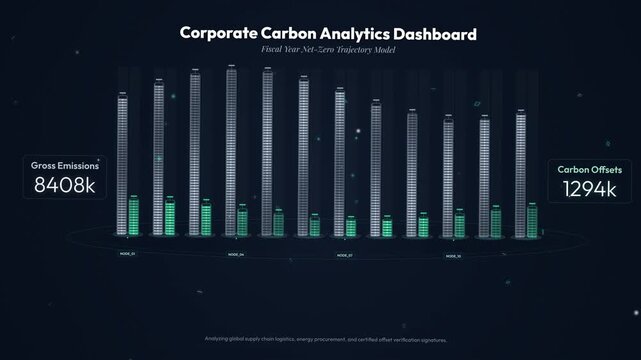
Corporate carbon analytics dashboard animation showing gross emissions decreasing and carbon offsets increasing in a net-zero trajectory model
00:59
HD
Interest rate increase arrow animation.Financial, business, and statistical analysis.
00:10
HD
Abstract neon line decreasing business graph chart animation background. Bad Economy Graph Chart, Down business graph icon animation on black background. Loss concept business graph animation.
00:10
HD
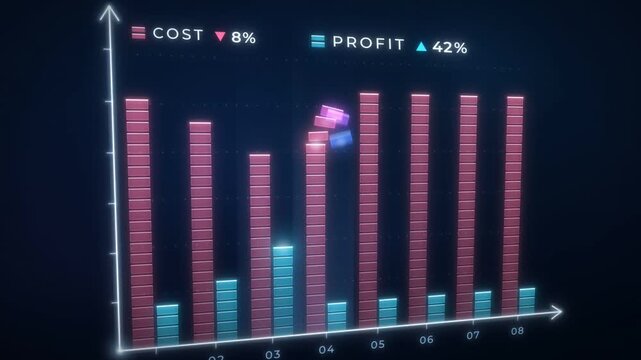
Cost and profit bar chart, cost bars shrink as profit bars grow until trend lines cross at break even point
00:16
HD
White Bar Chart Growth and Decline Animation on Black
00:05
HD
Regulating house temperature with a thermostat in four simple steps
00:16
HD
Abstract Financial Data Graph with Teal and Orange Bar Charts, Floating White Pink Line Overlay, and Glowing Data Points on Dark Grid Background for Business Motion Graphic, Corporate Tech VJ Loop.
00:12
HD
Business graph chart drop circle with down arrow moving animation on black background. Decreasing business graph and down arrow for business loss falling, bad economy recession concepts
00:10
HD
Cost reduction and quality improvement concept. Bar chart and line arrows illustrating increasing product quality and decreasing cost. Successful business strategy, efficiency and management
00:10
HD
Abstract chart with bar graph and line graph showing business data trend animation
00:09
HD
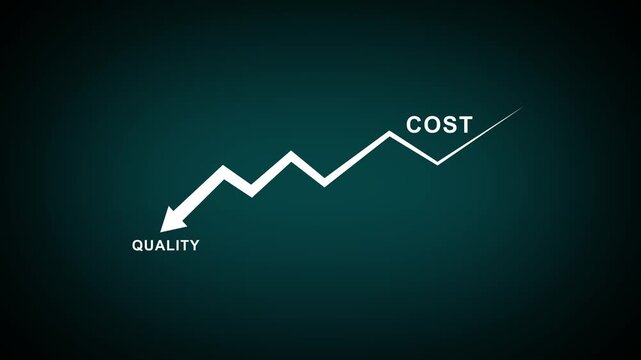
Quality vs Cost Comparison Chart with Business Decision Making and Performance Analysis Concept on Black Background..
00:10
HD
Visual representation of increasing quality percentage alongside decreasing costs, highlighting the importance of optimization in business strategies for improved profitability. Qubit
00:14
HD
Abstract 3D number 2000 text animation floating against a deep black void offering a vibrant and modern visual for the year with a sense of digital energy. 4k motion video.
00:10
HD
Glowing neon purple increase business graph chart animation on black background ideal for interest rate, finance, growth.
00:12
HD
Graph Going down animation. Down business graph icon animation on black background. Loss concept business graph animation. Indicates steady revenue decline, financial loss, negative growth
00:10
HD
Finance fund stocks price increase and decrease charts arrow up and down, ticker display. table grid Stock exchange screen number with financial trade index rates
00:20
HD
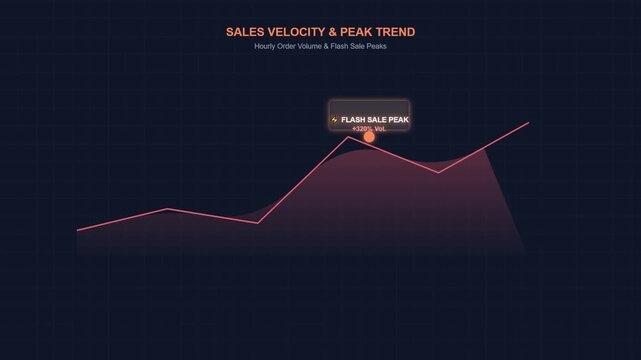
Sales Velocity and Peak Trend Analysis
00:06
HD
Green bar graph showing decline with grid background during financial analysis on black
00:10
HD
Illuminated abstract bars rise and fall against dark background, symbolizing growth and fluctuation.
00:07
HD
Minimalist business chart animation with downward trending  arrow and percentages 4k animation showing financial loss over with background dynamic...
00:10
HD
Warm yellow light shines through round holes in a black background. The intensity of the glow increases and decreases
00:22
HD
White Bar Chart Growing and Shrinking in a Clean Studio Setting
00:05
HD
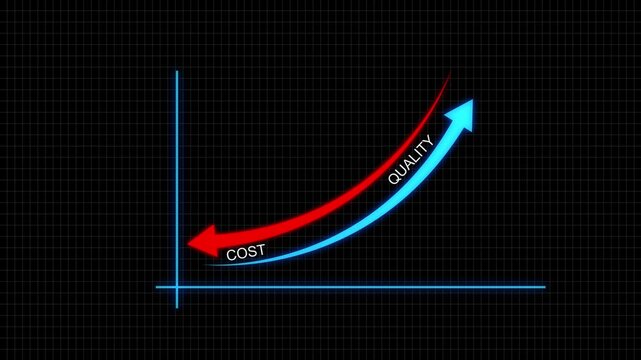
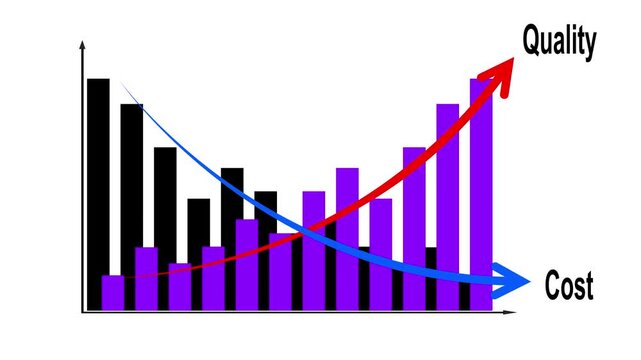
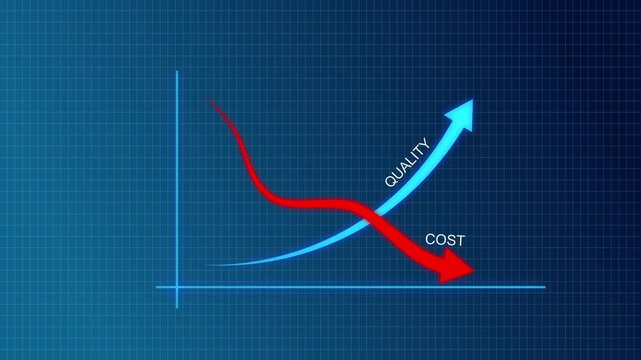
Rising quality bar chart and declining cost curve showing quality control and cost reduction. Quality improvement and cost reduction concept with blue quality line rising and red cost line falling.
00:10
HD
Luminous White Financial Chart Line Rising and Falling on Black Background
00:10
HD
Cost reduction concept. Cost wording on decrease money with down arrow. Cost Management, Economy recession, low budget, Effective business, Expense reduce on transparent background 4k video,
00:10
HD
Animated White Up and Down Arrows Direction Icons on Black Background
00:10
HD
Abstract business graph animation. business growth and success concept icon.Glowing business graph arrow rising financial business graph chart animation black background 4k, video
00:10
HD
animated of cost symbol dollar increase and decrease icon, money, dollar sign with arrow down. Money loss concept. Business loss. Cash with down arrow stocks graph, concept of financial crisis,
00:10
HD
Line art success graph icon animation. Finance and business, Financial report. Financial analysis icon. Animated line growth and decrease diagram.
00:05
HD
Cg footage with a reflection in glasses on a male face searching for information on the Internet and five stars as a symbol of evaluation
00:16
HD
Neon line Rising arrow transparent channel. arrow rising transparent channel, business growth arrow and graph chart, Business line arrow.
00:10
HD
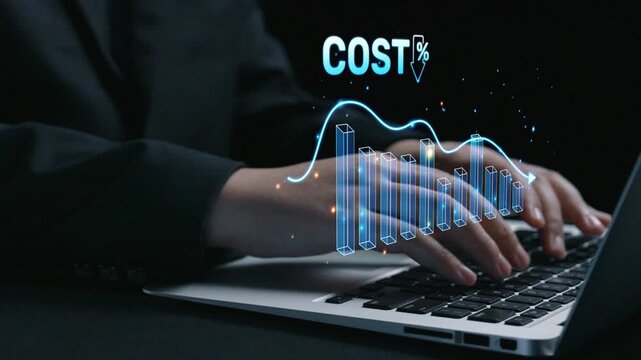
Close-up of hands typing on a laptop keyboard while analyzing financial data on a digital chart. Ideal for illustrating business growth and investment strategies. Copula
00:10
HD
Mosquito, insect bite, disease spread. Vector control. Blood vessel reacts to anticoagulant. Malaria transmission increases infection rates. Insecticide usage reduces population density.
00:10
HD
Cost reduction and cost saving through digital transformation, business cost optimization, operational cost reduction, financial saving, and resource efficiency 4k video animation.
00:06
HD
Business Growth Fluctuating Graph Chart Showing Sales, Revenue and Profit Increase and Decrease, Financial Data and Corporate Business Animation...
00:10
HD
Dynamic Growth Chart With Rising Bar Graph and Glowing Line Trend Against Dark Background
00:10
HD
Neon line Abstract decreasing business graph chart animation background. Indicate revenue decline, financial loss, negative growth, and market decrease performance 4k video
00:10
HD
Cost reduction and quality improvement concept. Green bar chart with line arrow falling cost and quality increase. Successful business strategy, efficiency, product optimization and management
00:10
HD
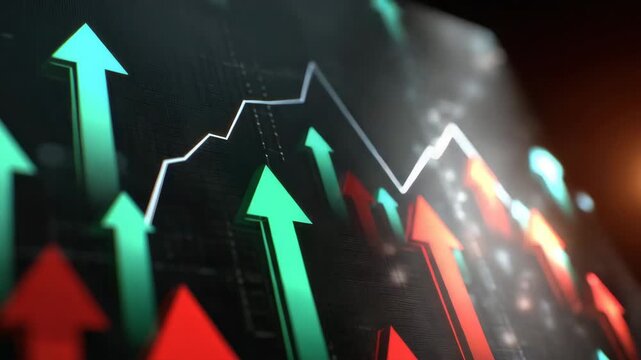
Stock market graph with colorful arrows showing financial growth and decline, investment data chart with green and red arrows on dark background, dynamic business trends and financial analysis
00:10
HD
Animated Metabolism level scale with arrow, Metabolism indicator gauze for weight management and health awareness.
00:10
HD
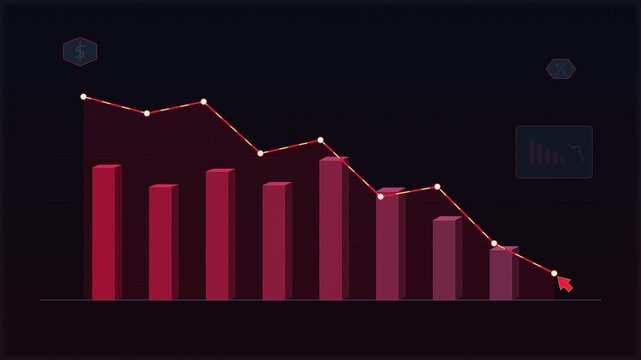
downward trending bar chart and line graph motion graphic, showing financial loss and economic recession
00:06
HD
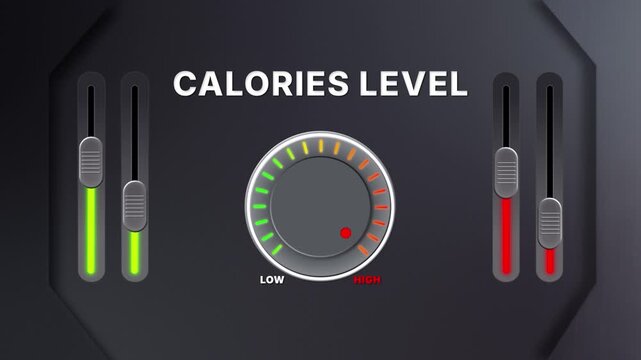
Animation of Calories level on a circular gauge moving from low to high and back. Can be used to show increase or decrease. Perfect for diet, nutrition, and health visuals.
00:26
HD
Down Arrow. Decreasing Concept Animation Video - Transparent
00:08
HD
Female transition: body progress, shape reduction, fitness effort, strength growth, health shift, diet plan, waist change, energy rise, lifestyle reform, muscle build, image contrast, visual result
00:10
HD
Red-orange particles transforming into clean blue light streams, representing carbon emission reduction and environmental transition for ESG and climate technology media.
00:05
HD
Quality vs Cost Comparison Chart with Business Decision Making and Performance Analysis Concept on Black Background..
00:10
HD
inflation Increased product sales growth basket market or consumer price index concept shopping cart with food increase with arrow graph on the coin inflation.4k motion graphics video animation
00:06
HD