
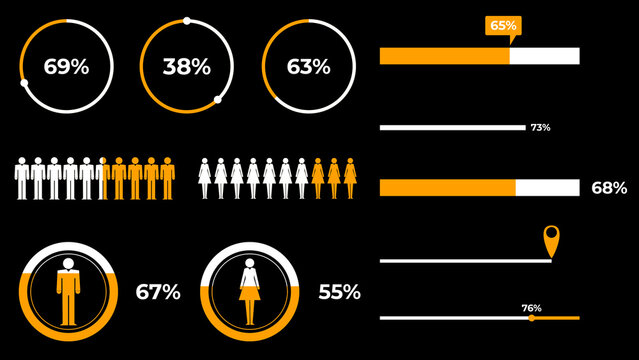
Infographics Elements.

Business Infographic Editable Template in Question Mark Shape with Icons
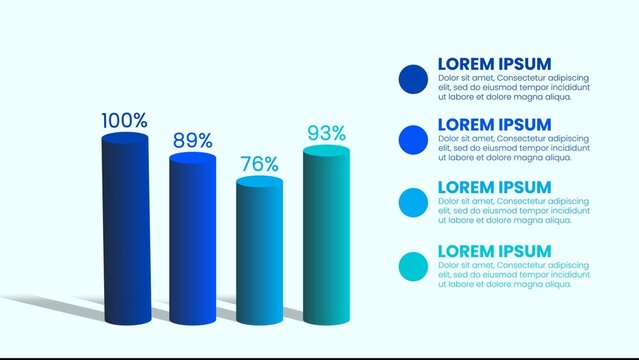
Dynamic Data Modern Infographic Elements

Project Steps Infographic Template Work Progress Presentation
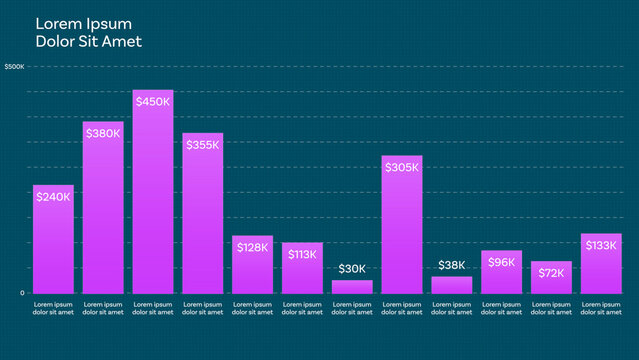
Responsive Vertical Bar Chart for Design and Data Visualization Design and Slide Presentation and with 12 Animated Data Points + Custom Text + Color with Dual Bar Graph Mode and Dynamic Auto-width Bar

Modern Business Infographic Elements Set

Bento Box Business Infographic Template For Dashboard Report, KPI Metrics, Data Visualization

Minimalist Green Global World Data Analysis Infographic Template

Modern Dark Analytics Dashboard UI

Dark-themed Infographic with Purple Accents

Cyber Security Dashboard UI Design
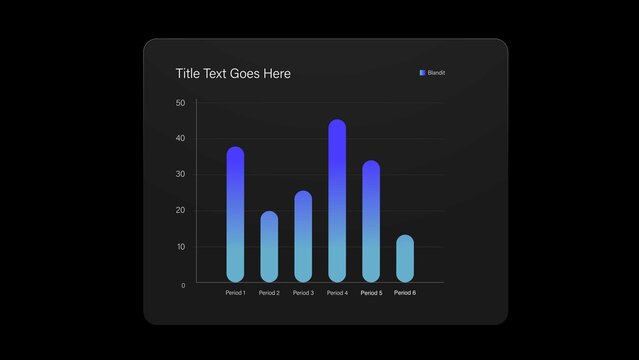
Infographic Bar Chart Video Template
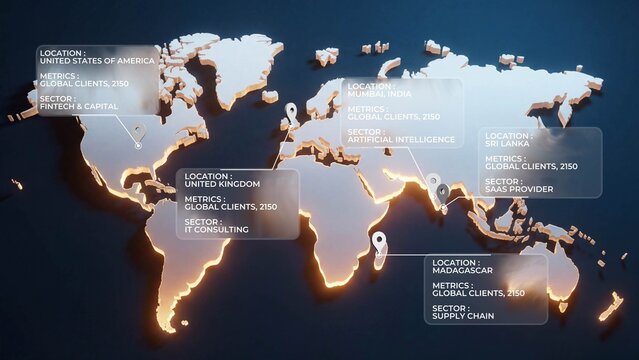
World Map Data Visualization

Minimalist 2 Step Percentage Circle Infographic Diagram for Business Plan and Execute Strategy

Editable Medical Infographic Template with Human Anatomy Elements and Data Visualization Statistics for Healthcare Reports.

Educational Dashboard Template

Blue Dawn - Particle Cinematic Titles
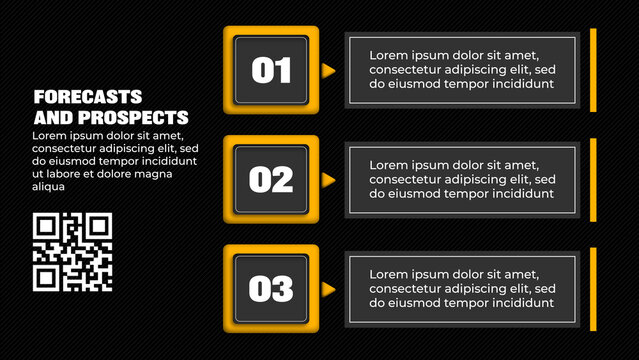
Informational Corporate Presentation Titles
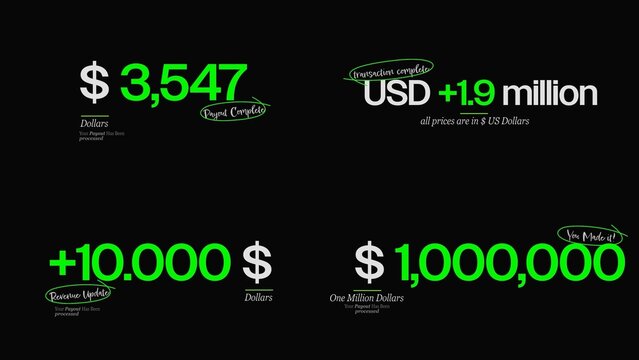
Currency Counters Text Animations | Animated money values, exchange rates & price displays for finance & banking.
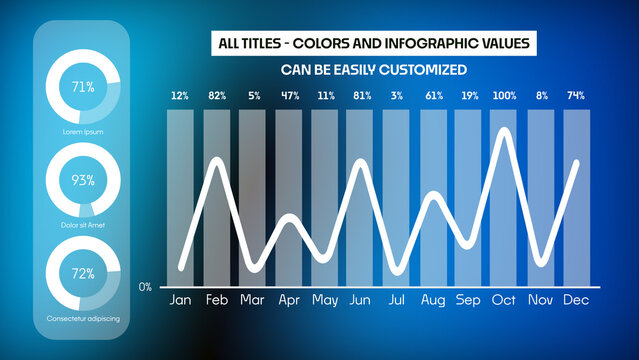
Corporate Infographics
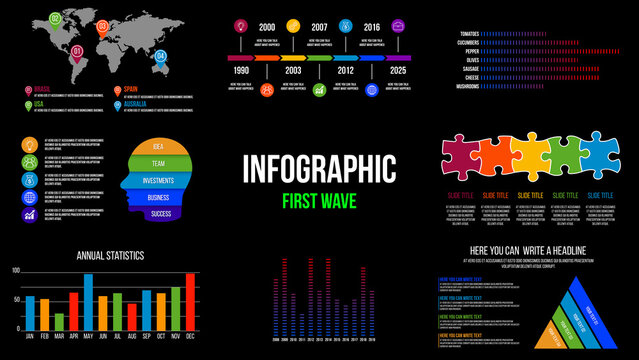
8 Infographics Elements

Modern Business Infographic Template with Five Steps and Colorful Ribbon Design
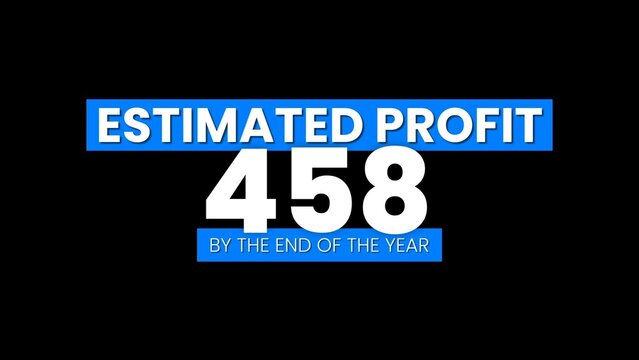
Clean Professional Value Number Increase Kinetic Title

Business Growth Strategy Plan Infographic Template

Whitepaper Report Template, Business Research Brochure & Case Study Layout with Fact Sheets, Executive Summaries & Data Visualization

Timeline Infographic Template
Bento Box Business Infographic Template For Dashboard Report, KPI Metrics, Data Visualization
Dark Modern Infographic Presentation Slide Template Set
Clean And Modern Business Analytics Dashboard UI
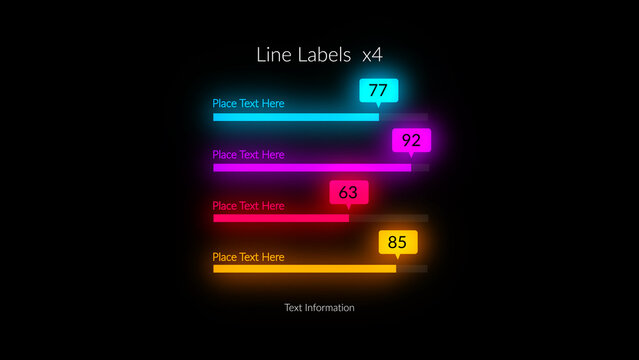
HUD Neon Infographics Lines Labels x4 – Futuristic Sci Fi Data Interface, Glowing Digital Dashboard Elements, Cyberpunk Analytics Charts, Tech UI Visualization Pack
Data Analytics Management Dashboard

Vertical Map Visualization 01
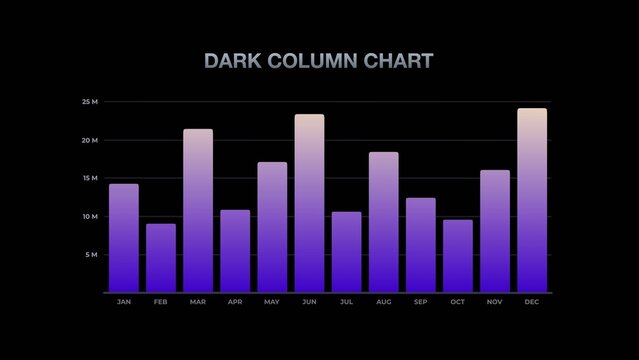
Modern Gradient Dark Column Chart
Bento Box Business Infographic Template for Dashboard Report, KPI Metrics, Data Visualization
Big Data Website Hero Image Layout with Colorful Waves
Financial Data Overview
Transformation Lines Infographic
Editable Graph Elements for Data Visualization Layouts
Three-Color Infographic Elements Set 1
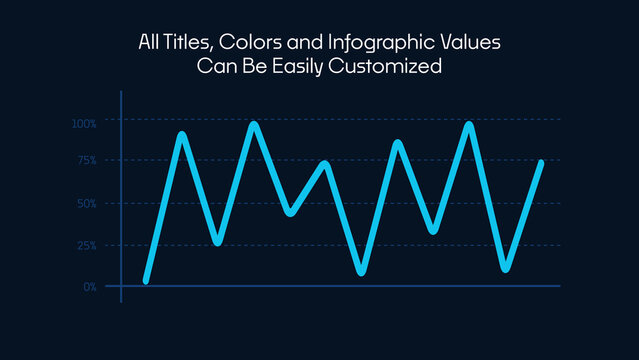
Corporate Infographics Template | Dynamic Data Visualization, Business Marketing and Statistical Graphs for Presentations
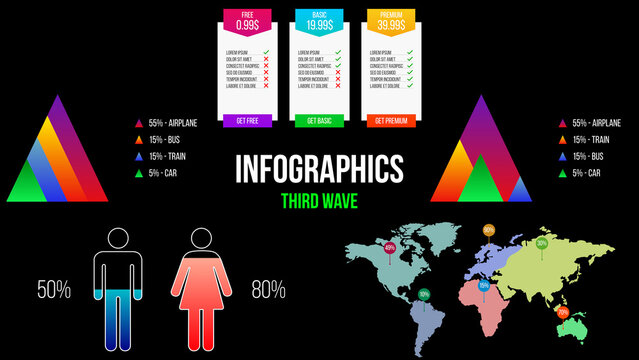
5 Infographics Elements
Seven Steps Vertical Infographic Template with Colorful Banners
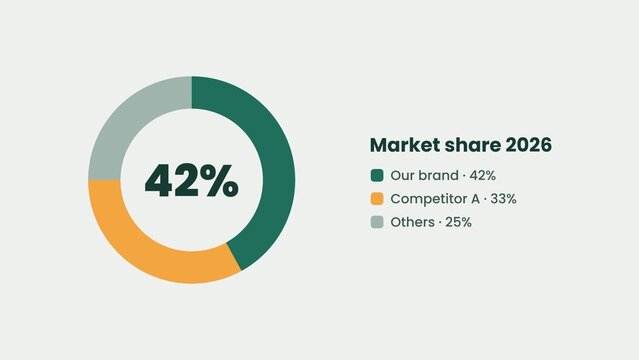
Donut Circle Split Pie Chart Market Share Infographic
Business Growth Infographic Template with Illustration of Vision
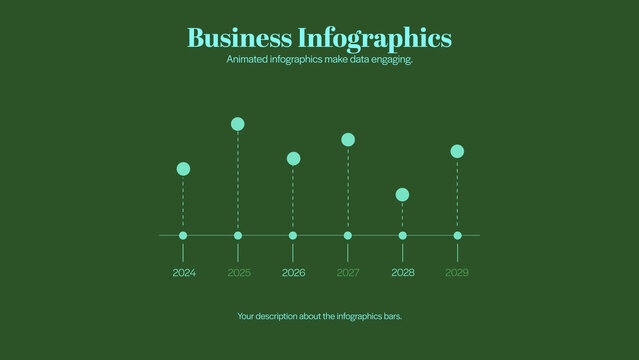
Economic Impact Visuals | 5 Different Resolutions with Control Panels
Modern Growth and Progress Business Infographic Presenation with Steps Layout
Line Graph Chart Infographic Vector with Cute Education Style for School Teachers
Dark Purple and Multicolor Business Infographic Data Analysis Infographic
Modern Business Analytics Dashboard UI Template
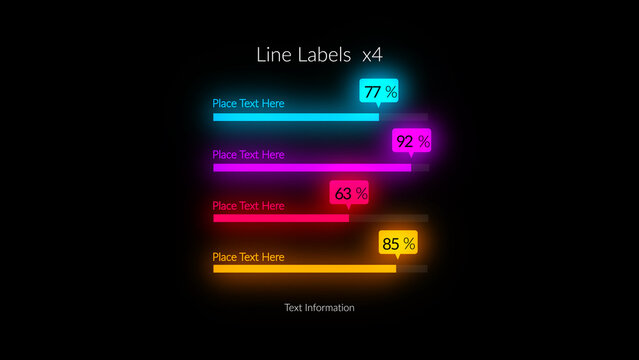
HUD Neon Infographics Lines Labels x4
Education Dashboard Design Template
Number Counter 02
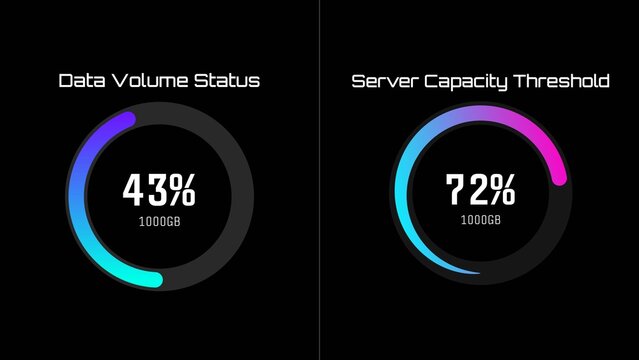
Modern Tech Circular Progress Infographic
Modern Corporate Annual Report Presentation with Financial Infographics & Charts
Colorful Shiny Waves Big Data Network Concept
Account Service Dashboard
Hexagon Performance Graph Infographic
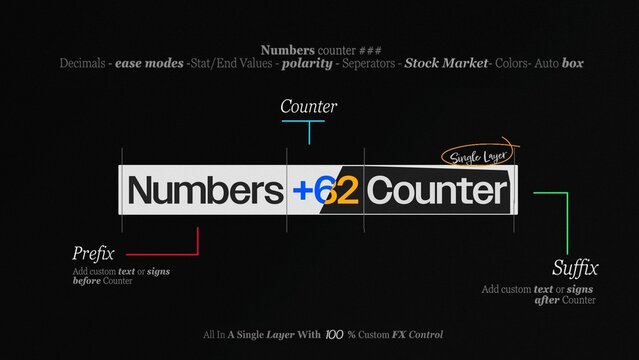
Number Counter Text Animation Maker | Universal Tool for count ups , countdowns , rolling percent stats and more
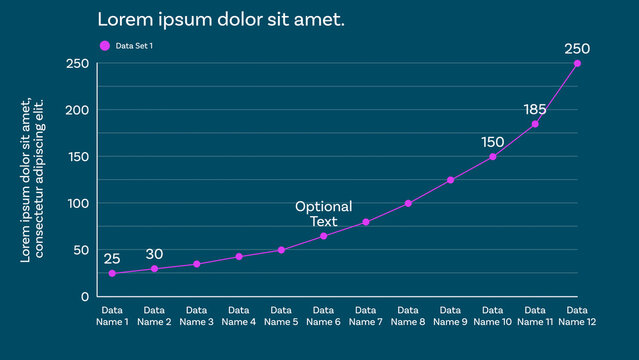
Responsive Line Graph for Clean and Modern Data Visualizations Design and Slide Presentations with up to 12 Animated Data Points and Optional Labels to show Percentages, Whole Values, and Custom Texts
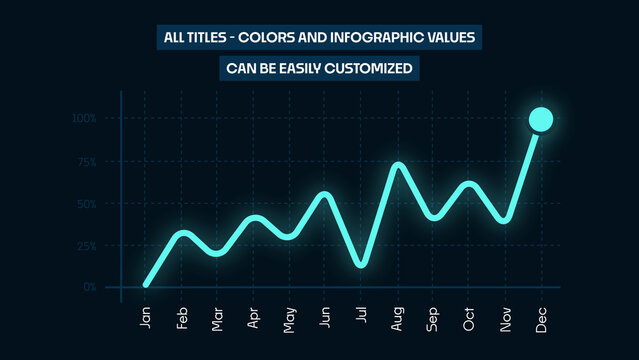
Animated Line Chart Infographics | Business Data Visualization and Analytics Graph
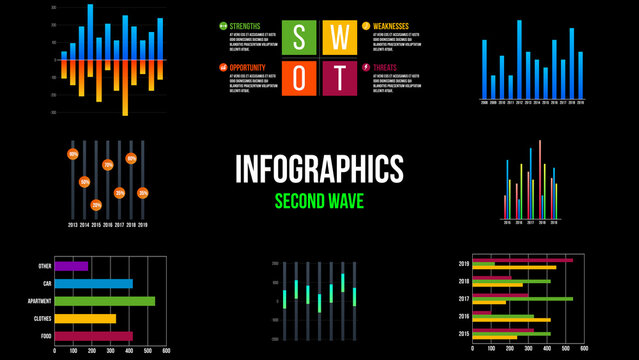
8 Infographics Elements
Simple stylized blue color data table layout template with semi transparent effect
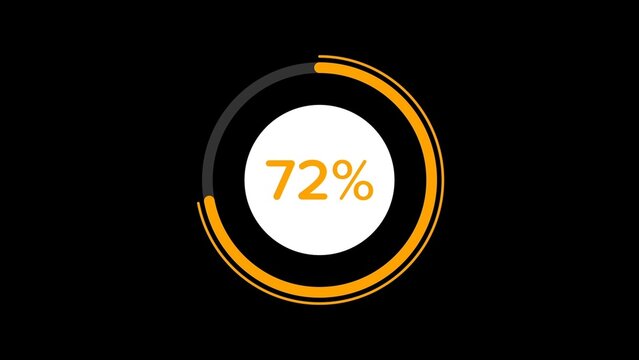
Infographic Percentage Pie Chart
Business Growth Infographic Template with Abstract Minimalist Illustration
Editable Graph Elements for Data Visualization Layouts
Roadmap Infographic Layout
Donut Doughnut Pie Chart Infographic Template in Modern Corporate Style for Business Presentations & Data Visualisation
Bright And Bold Color Infographic Layout
ZDARMA
Modern Analytics Dashboard UI Kit Wireframe Design
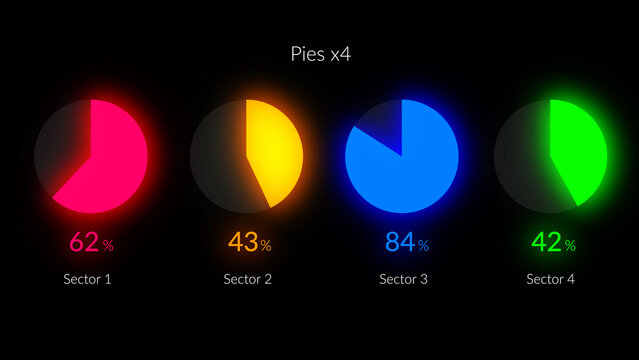
HUD Neon Infographics Pies x4 – Futuristic Sci Fi Data Interface, Glowing Digital Dashboard Elements, Cyberpunk Analytics Charts, Tech UI Visualization Pack
Cryptocurrency Dashboard Template
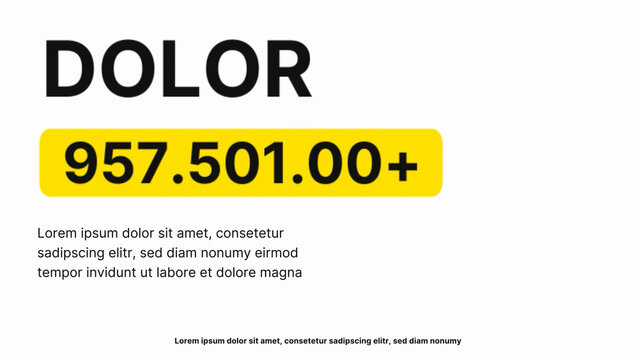
Number Counter

Corporate Presentation Information Titles
4 Step Business Growth Timeline Infographic Presentation Layout
Dark Modern Gradient Infographic Presentation Template Data Visualization Design
Payroll Dashboard Template
Circular Third Progress Infographic

Business Strategy | with Control Panel
Data Visualization Technology Layout
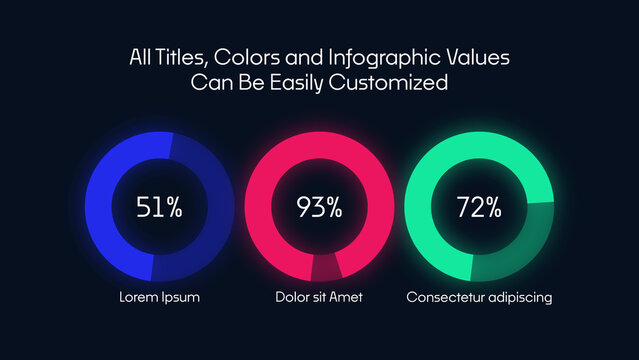
Corporate Infographics | Statistics, Reports and Data Visualization Elements
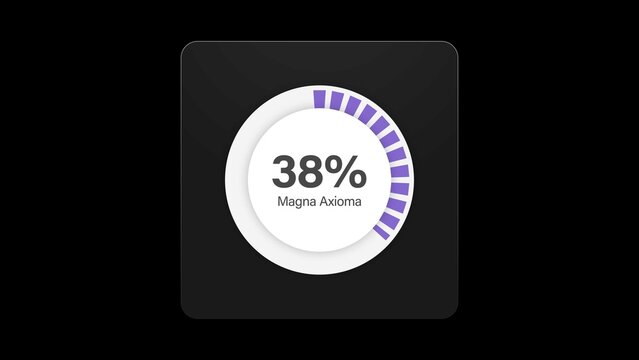
Infographic Pie Chart Animation Template
Modern Vertical Timeline Template Infographic for Business Presentation
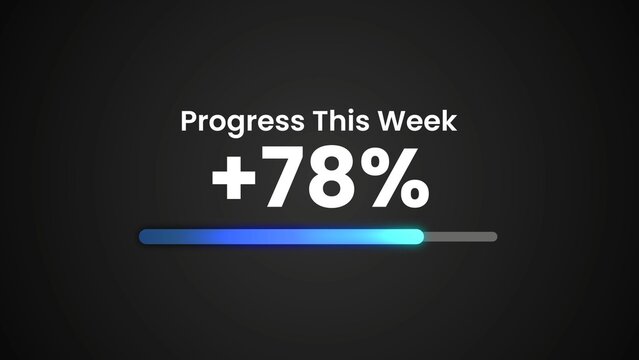
Clean Professional Value Number Increase Kinetic Title
Business Merger and Acquisition Deal Infographic Template
Bright Infographic Layout with Simple Graphics
Minimal Roadmap Infographic Template
Donut Doughnut Chart Infographic Template
Editable Chart Design with 6 Months Option
Professional Case Study Report Template Design
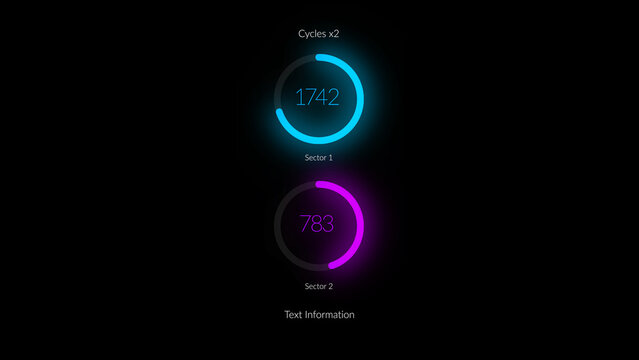
HUD Neon Infographics Cycles 2
Cyber Security Admin Dashboard UI Threat Monitoring And Network Analytics Template
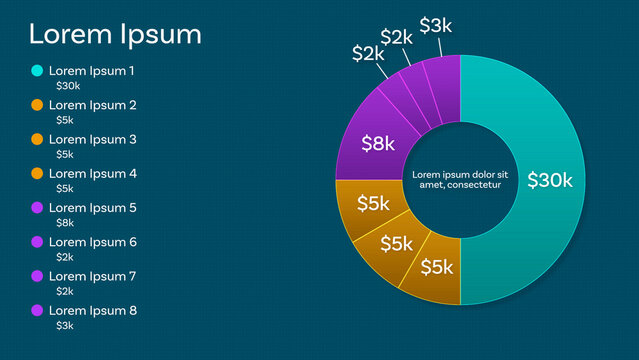
Responsive Pie Chart Mogrt for Clean and Modern Data Visualizations Design and Slide Presentation up to 8 Animated Data Points and Custom Text and Color with Percent Value Display Option and Paragraph
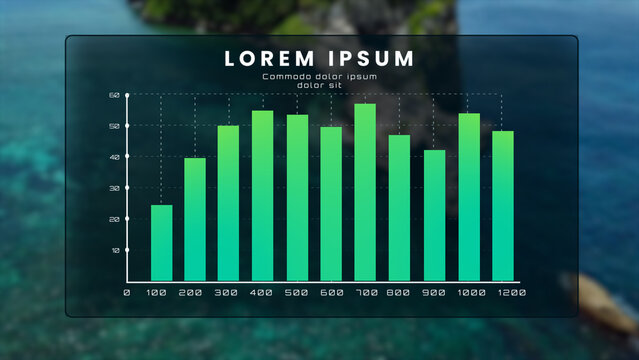
Infographics
Minimal Iceberg Infographic Design for Business Data Visualization
Grey Edge Computing Network Technology Icons Set
Sales Dashboard Template
Infographic Set
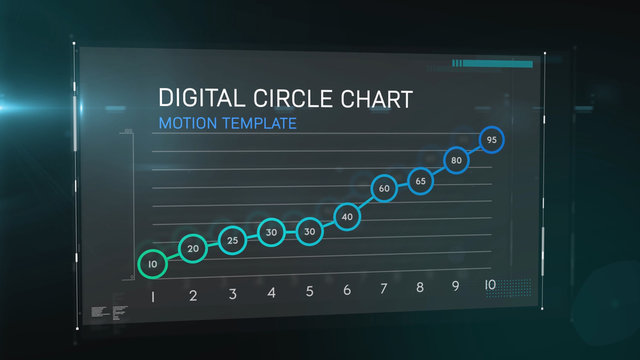
Digital Circle Chart
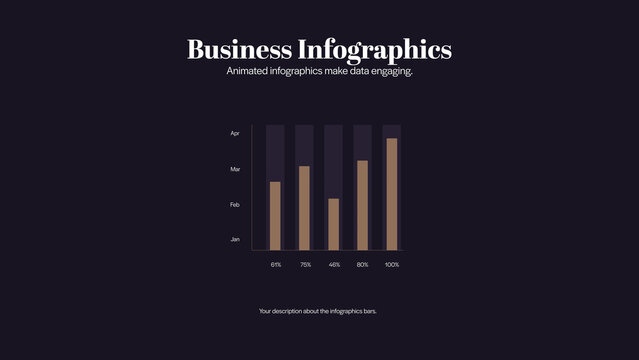
Business Model Adaptations | 5 Different Resolutions with Control Panels
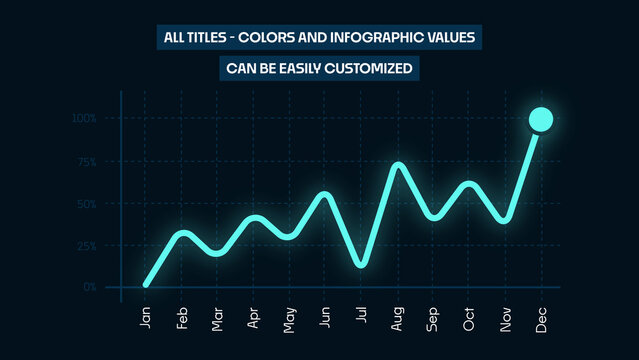
Animated Line Chart Infographics | Business Data Visualization and Analytics Graph