A link to set your password has been sent to: To access your purchases in the future you will need a password.
Get 10 Stock images with a free trial
New filters added
Sort by

201,453 results for increase and decrease in all

19,766 results in video
Volume Level Control Animation with Speaker Sound Wave, Plus and Minus Buttons on Soft Peach Background
00:09
HD
Glowing neon purple increase business graph chart animation on black background ideal for interest rate, finance, growth.
00:12
HD
Carbon Footprint Reduction and Tree Growth Cycle Motion Graphics
00:13
HD
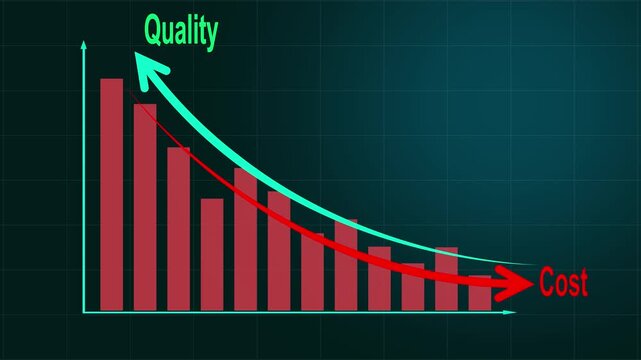
Cost reduction and quality improvement concept. Red bar chart with line arrow falling cost and quality increase. Successful business strategy, efficiency, product optimization and management
00:10
HD
Data analysis software, statistical tools, research presentations. Visual representation of interconnected data points with adjustable correlation threshold.
00:10
HD
Animated Calculator with Money Bag and Cash Stacks - Transparent
00:10
HD
Cost reduction and cost saving through digital transformation, business cost optimization, operational cost reduction, financial saving, and resource efficiency 4k video animation.
00:10
HD
Business Growth Chart with Up and Down Arrows Animation.Motion graphics of concept
00:10
HD
Business Growth Fluctuating Graph Chart Showing Sales, Revenue and Profit Increase and Decrease, Financial Data and Corporate Business Animation...
00:10
HD
Blood vessel obstruction caused by fatty cholesterol buildup demonstrating reduced circulation, vascular inflammation, and increased risk of coronary artery disease and stroke. 3D Rendering
00:15
HD
Cost reduction and cost saving through digital transformation, business cost optimization, operational cost reduction, financial saving, and resource efficiency 4k video animation.
00:06
HD
Futuristic Concept of Artificial Intelligence Impacting Quality and Cost on a Laptop Keyboard with Data Visualization Graphics Sigmoid
00:10
HD
thermometer temperature animation rising and falling
00:10
HD
Health Bar
00:06
HD
Profit gap chart illustrates financial analysis with a pie diagram, money bag, bar graph, and computer screen presenting percentage data for strategic business planning and growth
00:17
HD
Business Growth Fluctuating Graph Chart Showing Sales, Revenue and Profit Increase and Decrease, Financial Data and Corporate Business Animation...
00:10
HD
A glowing teal-to-green neon icon featuring side-by-side vertical elements resembling a directional or up-and-down arrow symbol against a dark background.
00:10
HD
Framed Volume Slider Animation from Zero to Maximum with Mute Control for Digital Audio Interfaces
00:08
HD
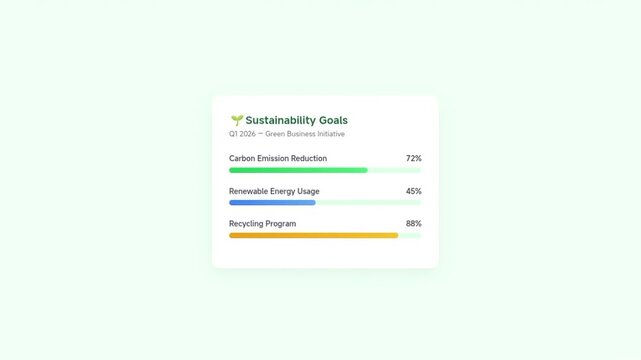
Animated UI dashboard showing sustainability goals progress bars for carbon emission, renewable energy, and recycling. Modern green business ESG data visualization.
00:06
HD