A link to set your password has been sent to: To access your purchases in the future you will need a password.
Get 10 Stock images with a free trial
New filters added
Sort by

201,280 results for increase and decrease in all

19,585 results in video
Time management with AI technology concept. Saving working time to reduce costs, work planning for increased efficiency and reduced work time. Business project planning.
00:15
HD
Animated stock market candlestick chart showing financial data. A graph illustrating market volatility with growth, decline, and recovery. Finance and trading concept
00:07
HD
Corporate Success Animation Rising Arrow on Business Graph
00:10
HD
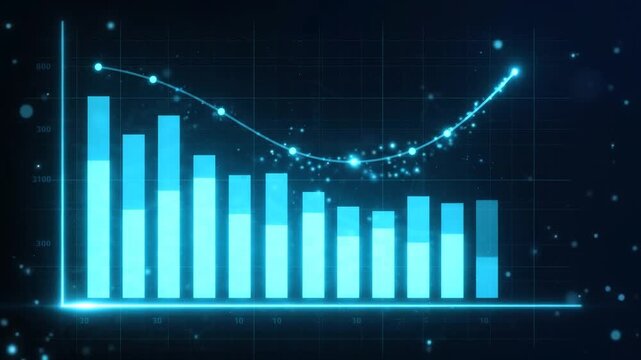
Abstract Blue Data Visualization Bar Chart Animation with Line Graph
00:05
HD
Crude oil price drop animation reduction money animation.cost reduction vector icon. dollar decrease.
00:10
HD
Cost Reduction Business Growth Motion Graphics Line Chart Arrow Down Concept, Financial Loss Analysis, Budget Cut Optimization, Downward Arrow Graphic with Text Animation on Black Background.
00:10
HD
Environmental attention has turned to the carbon credit market as an important tool for incentivizing reductions in greenhouse gas emissions.
00:08
HD
Market oversaturation concept illustrated by surging competition. Increasing product or service availability. And a corresponding decrease in demand
00:17
HD
Blue 3D Bar Chart Animation Visualizing Data Growth
00:10
HD
Professional Business Growth Chart Animation with KPI Analytics
00:09
HD
Percentage with arrow up and down. Banking, credit, interest rate. Motion Graphic
00:12
HD
Animated blue graph displaying market trends with rising and decreasing lines, showcasing trade dynamics, crypto fluctuations, and varied expenses in a digital diagram format.

00:11
HD
Green Bar Chart Animation Stock Market Data Growth Visualization
00:05
HD
Revenue and Profit Growth Animation for Corporate Business Reports
00:08
HD
AI agents disruption employment automation reskilling upskilling cost reduction workforce adaptability growth chart analysis
00:05
HD
Stress reduction and calm from chocolate consumption, on adrenal glands slowing cortisol release, hormones shifting from chaotic red to serene blue
00:07
HD
Business Analytics Dashboard Motion Graphic with Growth Statistics
00:10
HD
Bar chart columns animation shows currency dollar marks. Business revenue analytics track on bar chart columns animation. Profitable economic investment growth drives columns.
00:06
HD
Bar Chart Decline Animation
00:06
HD
Glowing Blue Financial Data Chart with Animating Bar Graph and Curved Line Growth Analysis on Dark Grid Background
00:08
HD