A link to set your password has been sent to: To access your purchases in the future you will need a password.
Create without limits — unlimited downloads, plus powerful AI editing
New filters added
Sort by

19,768 results for increase and decrease in videos

Black color arrow rising transparent channel. Abstract arrow growth chart of economy icon black color animated down to up arrow animation, on a white background, direction animation,with video
00:05
HD
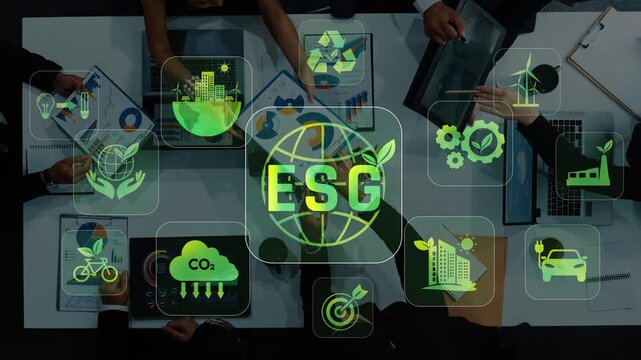
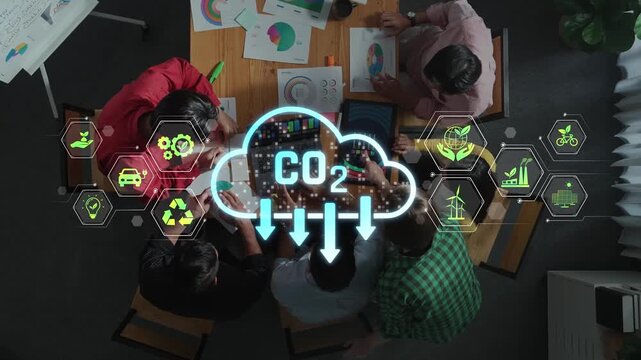
A diverse team collaborates on ESG strategies, surrounded by digital icons representing critical sustainability and governance concepts in a modern office setting. Raster
00:12
HD
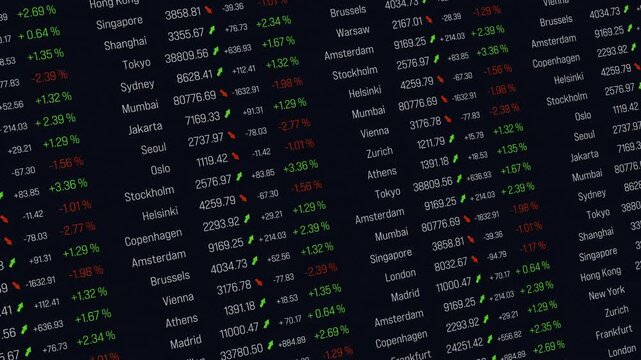
Financial markets, global stock index data, trading board. Investment, stock exchange data, price, risk, strategy, analyzing, business. 3D animation
00:12
HD
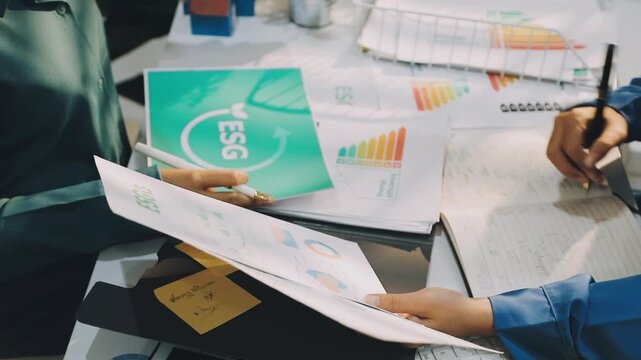
Business leaders discuss implement environmental sustainability strategies net zero carbon goals corporate responsibility using ESG reports data at meeting
00:12
HD
Thermometer Temperature Increase Decrease Animation Clinic Weather in 4k animation -5 degree temperature animation with alpha channel in transparent background
00:10
HD
Zoom in and out animation the package box symbol. Large black symbol in the center and four small symbols around. Seamless looped 4k animation on white background
00:12
HD
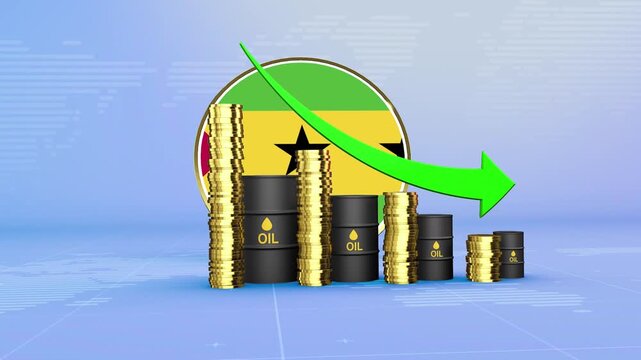
Sao Tome and Principe Oil Prices Decline with Oil Barrels, Gold Coins and Downward Green Arrow, 3D Economic and Financial Market Concept
00:11
HD
dynamic brush stock profit arrow animation.
00:10
HD
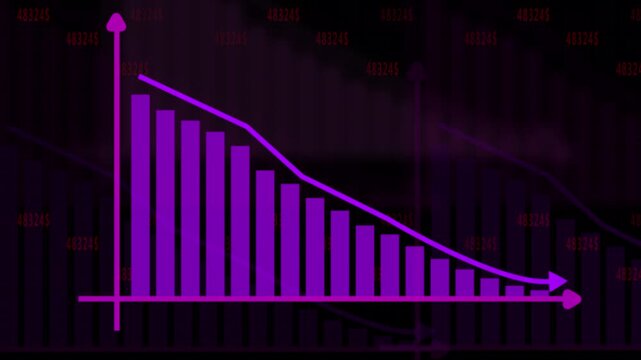
Purple bar chart showing downward trend with arrow graph. Financial loss chart for corporate performance failure metrics. Digital bar chart animation for network alert.
00:12
HD
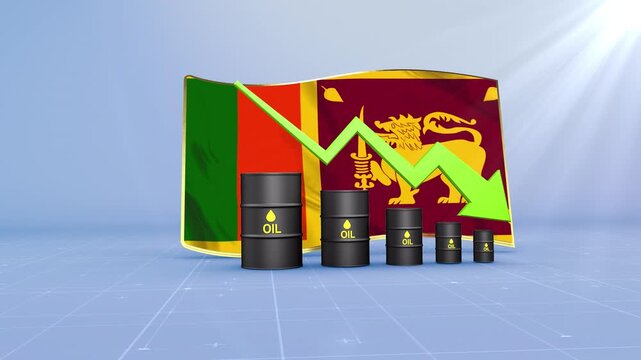
Sri Lanka Oil Price Falling with Oil Barrels Downward Green Arrow and 3D Financial Data Visualization Graphs for Economy and Business Concept
00:11
HD
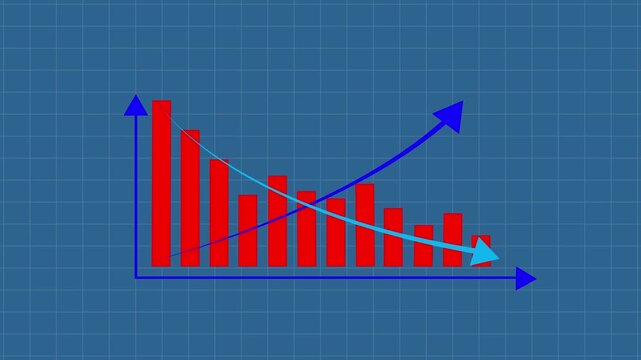
Red bar chart with line graph showing cost reduction and improving quality.. growing business concept.
00:10
HD
Animated line graph showing declining financial performance and market downtrend animation 4k financial chart
00:10
HD
Blue Neon Dollar Sign with Downward Arrow Symbolizing Financial Decrease.dollar and down arrow  animation on black background.
00:10
HD
Percentage Progress Bar Loading Concept, Digital Data Flow, Financial Growth, UI Element
00:10
HD
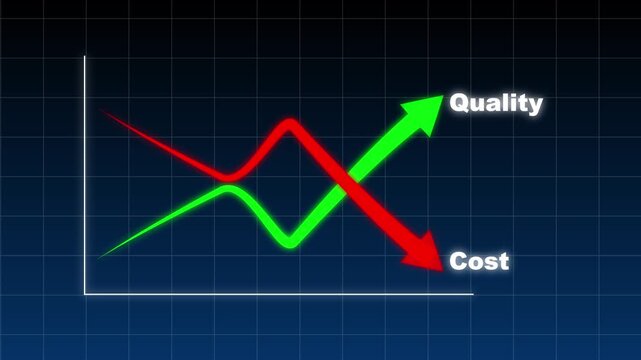
Business Strategy Showing Fluctuating Quality Improvement and Declining Costs, Highlighting Process Optimization, Operational Efficiency, Cost Reduction, Productivity Growth, and Better Performance
00:10
HD
Green rising zigzag arrow on black background showing stock market recovery, with video animation.
00:10
HD
Up and down arrow icon set, glowing neon upload download symbol on black background
00:10
HD
2027 New year with change to UP and Down arrow. Interest rate, GDP, stocks market, financial, deflation and Inflation, mortgage, debt, Loan and Economic Recession
00:09
HD
Two curved arrows pointing in opposite directions minimal animation
00:06
HD
Bright white 3D number 2023 text animation floating against a deep black void offering a vibrant and modern visual for the year with a sense of digital energy.
00:10
HD
Animated financial bar chart and line graph showing data trends on a dark purple background
00:08
HD
Colorful Digital Promotional Banner Featuring a Dynamic Shopping Frenzy Sale Event with Large Discount Offer and Festive Confetti Elements
00:10
HD
Rising graph, chart moving up, stock market rally, plus hundred percent, gain, high profit. Bull market, economic moving up, growth, progress, strong business.
00:09
HD
AI supports net zero goals via virtual assistant insights, AI-based green strategies, and artificial intelligence for climate-aware business planning. Kernel
00:12
HD
Person icon holding money on a hand, symbolizing receiving advantageous financial conditions for credit with decreasing graphs and house icon
00:17
HD
Zoom in and out animation the database symbol. Large black symbol in the center and four small symbols around. Seamless looped 4k animation on white background
00:12
HD
Monaco Oil Prices Decline with Oil Barrels, Gold Coins and Downward Green Arrow, 3D Economic and Financial Market Concept
00:11
HD
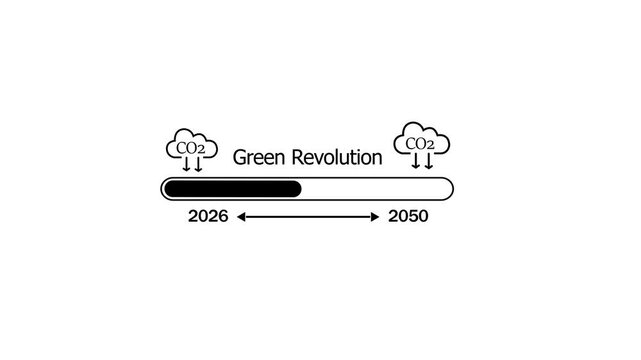
Animated green revolution progress bar illustrating carbon dioxide co2 emission reduction targets and climate change mitigation goals from the year 2026 to the future milestone of 2050 sustainability
00:10
HD
Digital bar chart lines compare market volatility trends using dual arrows. Financial analysis software modules look crisp across this grid monitor bar chart framework. Data charts update.
00:10
HD
Morocco Oil Price Falling with Oil Barrels Downward Green Arrow and 3D Financial Data Visualization Graphs for Economy and Business Concept
00:11
HD
Digital data visualization shows fluctuations on a computer circuit board. Glowing blue particles form a graph indicating market changes over time.
00:08
HD
Animation Glowing neon line graph arrow downwards against black background, abstract neon line arrow down business graph, with neon effect and business growth arrow animation.
00:08
HD
Abstract dollar sign icon and up arrow animation on a white background. Upward arrow and dollar icon. High pricing icon. profit, investment, growth business, economy, finance and success concept
00:10
HD
Neon glowing dollar sign with down arrow animation showing financial loss concept graphic.
00:10
HD

Bar chart animation showing changing data values, representing business analytics, statistics, performance comparison, financial reporting, growth and market trends.
00:06
HD
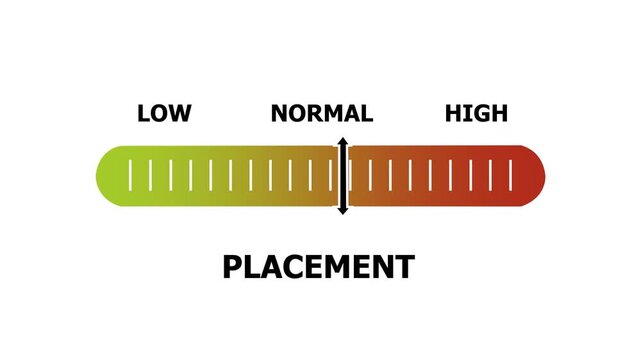
placement level indicator scale. Low normal & high meter infographic animation. Showing high placement level color gauge indicator. on a white background 4k animation video
00:10
HD
Neon decreasing graph with user profile analytics representing negative growth and customer loss
00:08
HD
Sustainability Performance Dashboard
00:06
HD
Reduction of carbon emissions concept on the transparent background. Net zero greenhouse gas emissions target. Motion graphics for reducing carbon Idea. 4k video animation.
00:06
HD
A CO2 cube and a dollar money bag. Recycling grants. Reducing environmental impact while generating income. Increase in the cost of emission quotas for enterprises. Waste recycling
00:14
HD
Radiation level indicator scale. Low normal & high meter infographic animation on black background. Showing high radiation level color gauge indicator for environmental and safety monitoring.
00:10
HD
ESG Sustainability Business Finance Dashboard Motion Graphics
00:20
HD
Neon financial graph icon with dollar coin and scissors cutting down trend isolated on black
00:08
HD
A business team engages in strategic planning and analysis using financial charts and digital overlays, capturing global market trends in a modern office setting. Raster
00:12
HD
Pricing control concept managing business cost strategy, showing a scale with a dollar sign, scissors cutting a price tag, and arrows indicating rising expenses towards a briefcase
00:17
HD
Zoom in and out animation the shopping bag symbol. Large black symbol in the center and four small symbols around. Seamless looped 4k animation on white background
00:12
HD
Moldova Oil Prices Decline with Oil Barrels, Gold Coins and Downward Green Arrow, 3D Economic and Financial Market Concept
00:11
HD
Economic graph animation going down with an arrow isolated on white background
00:10
HD
Cost cuts business concept motion with red downward arrows and modern typography
00:08
HD
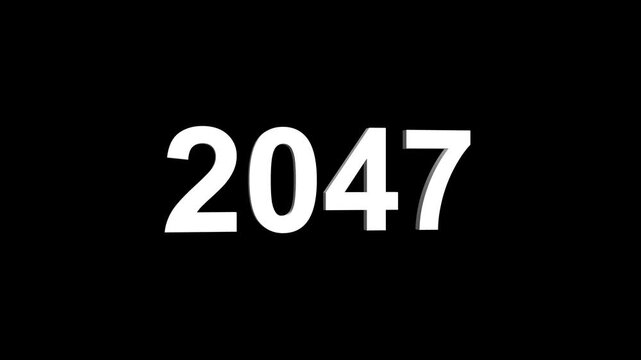
Bright white 3D number 2047 text animation floating against a deep black void offering a vibrant and modern visual for the year with a sense of digital energy.
00:10
HD
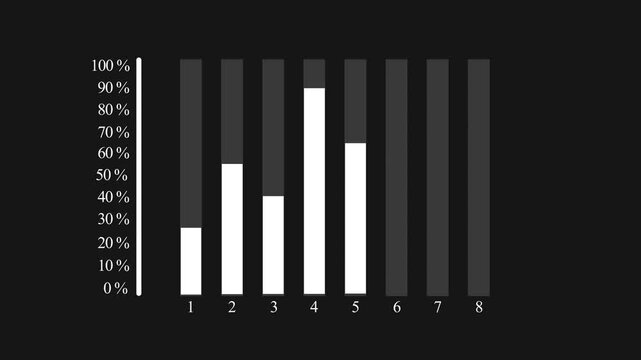
Animated histogram with data showing growth over 8 steps percent on black background motion graphic
00:10
HD
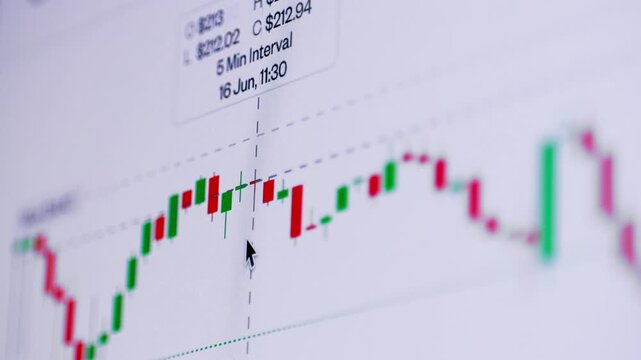
Cryptocurrency trading. Bitcoin stock graphic. Bitcoin mining and Finance banking management concept, oil and Money trading, Digital trade platform. Profit and loss graph. Online trading
00:13
HD
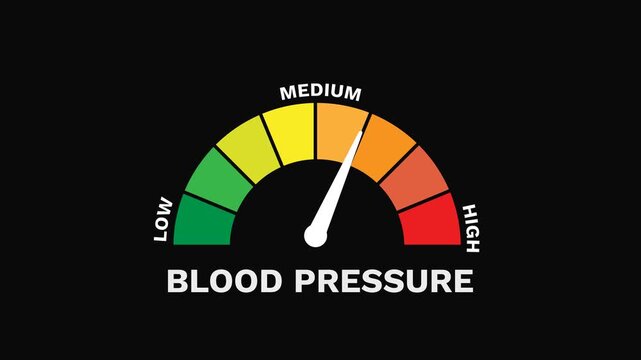
Blood Pressure Gauge Increasing and Decreasing Indicating Hypertension and Health Animation
00:19
HD
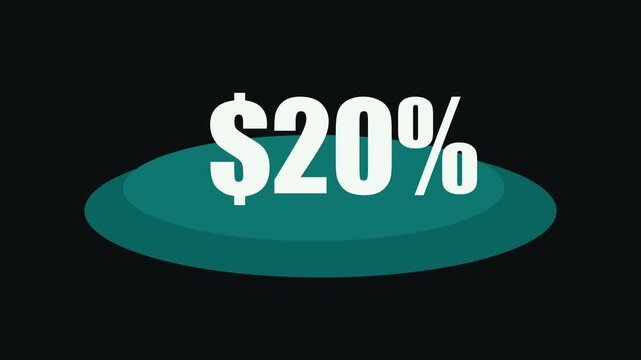
Futuristic dollar countdown timer animation, glowing dollar symbol integrated with a circular countdown display, numbers decreasing smoothly from 0 to 20,
00:10
HD
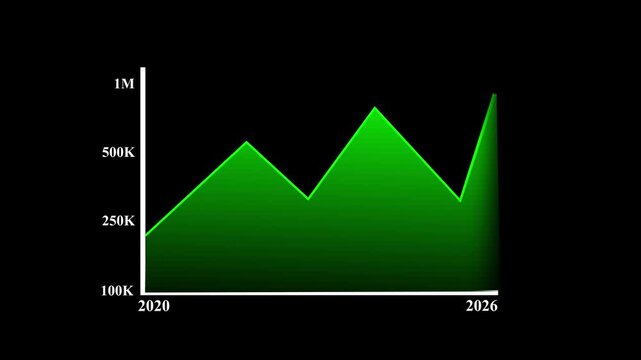
Green chart rises and falls over a four year period
00:08
HD
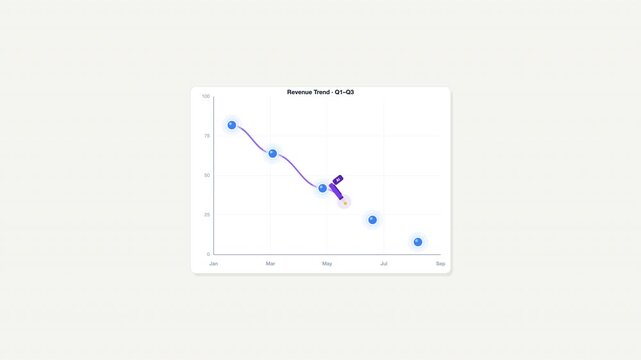
Revenue trend 6m line chart with blue circles and purple wavy line. Suitable for financial presentations, reports, and data analysis projects.
00:10
HD
Declining Percentage Trend and Falling Performance Over Time, Representing Financial Downturn, Reduced Growth, Lower Returns, and Increasing Risk in Investment and Market Value
00:10
HD
Discount sign animation with blue neon seventy percent. Discount sign marketing sale banner. Discount sign digital ecommerce graphic on black background for retail.
00:13
HD
White dashed line graph with dots on black background chart data
00:10
HD
Success level indicator scale. Low normal & high meter infographic animation on black background. Showing high success level color gauge indicator for goal achievement and performance monitoring.
00:10
HD
Managing Your Finances Tracking Debt Reduction and Progress Towards Financial Freedom
00:10
HD
Palestine Oil Price Falling with Oil Barrels Downward Green Arrow and 3D Financial Data Visualization Graphs for Economy and Business Concept
00:11
HD
Hand-drawn downward trend arrow animation on black background, for financial data, visualization and business reports
00:10
HD
A group of professionals collaborates in a meeting to discuss climate change solutions with visual data on CO2 impact and eco-friendly strategies for a sustainable future. Raster
00:20
HD
Financial strategy showing asset value decreasing on a monitor, networked individuals, and a hand making a payment, representing the process of economic resource consumption
00:17
HD
High pricing icon. Up arrow with dollar sign. high price business money cost pay payment logotype animation on a transparent background.4k video
00:10
HD
Costa Rica Oil Prices Decline with Oil Barrels, Gold Coins and Downward Green Arrow, 3D Economic and Financial Market Concept
00:11
HD
Lean thinking concept. Cost reduction concept. Business process improvement. Maximising productivity and quality, reducing time and cost. Cost cutting, lean process for surviving the recession.
00:10
HD
White dollar sign with green fill and grey 40 percent number on dark background with green abstract lines representing financial growth and economic data analysis
00:06
HD
Informational graphic presents Boost vs Drain on a split screen. Text colors subtly change over a light gray background, focusing on a critical concept
00:06
HD
Business growth concept in graph chart animation on black background. Statistics bars columns growth, positive increase chart. Increase graph icon suitable for business and finance concepts
00:08
HD
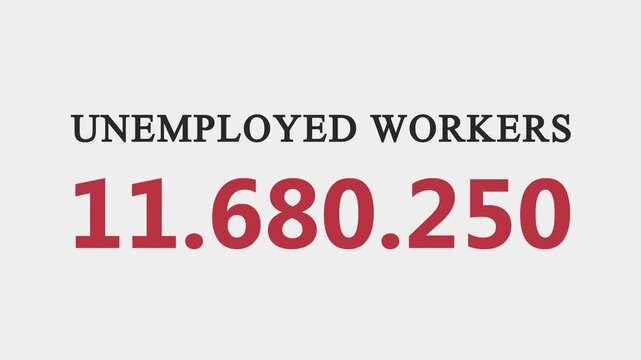
 4K Ultra High Unemployed Workers Number US
00:30
HD
Currency fluctuation icon featuring money with upward and downward arrows. Visual representation of exchange rate movement and financial market changes.
00:10
HD
response level indicator scale. Low normal & high meter infographic animation. Showing high response level color gauge indicator. on a black background 4k animation video
00:10
HD
Man hand adjusting smart thermostat temperature on wall from 23 to 26 and 25 degree. Digital climate control and energy saving concept for modern home automation
00:08
HD
black business graph chart growth up down or signal on white background with alpha channel. Business up and down signal concept.
00:07
HD
High Performance Gauge Indicator Animation. Speedometer Icon with arrow Indicate high level
00:10
HD
Animated bar chart showing growth and decline metrics
00:10
HD
Bright white 3D number 2020 text animation floating against a deep black void offering a vibrant and modern visual for the year with a sense of digital energy.
00:10
HD
Danger level indicator scale. Low Normal High meter infographic animation on black background. Animation showing high danger level color gauge indicator for safety and risk monitoring
00:10
HD
Bar chart for declining business performance by month. the curve shows a downward move .chart graph animation, 4k arrow is making downfall on a grid ...
00:10
HD
Burundi Crude Oil Price Drop with Oil Barrels Downward Green Arrow and 3D Financial Data Visualization Graphs for Economy and Business Concept
00:11
HD
Financial Market Decline and Economic Downturn Falling Dollar Value, Decreasing Wealth, Shrinking Investment Returns, Lower Asset Prices, and Increasing Financial Risk
00:10
HD
AI boosts quality and reduces costs with smart analytics and virtual tools that support Lean, Six Sigma, and TQM for better efficiency. Epoch
00:13
HD
Supporting quiet meditation and wellbeing through stress reduction, positive mental health, mindfulness, and care, represented by a serene mind, a calm heart, and undisturbed time
00:17
HD
Exclusive digital commerce promotional sale and discount on green screen background
00:10
HD
Belarus Oil Prices Decline with Oil Barrels, Gold Coins and Downward Green Arrow, 3D Economic and Financial Market Concept
00:11
HD
Customer Retention Strategy and Client Churn Reduction Concept featuring Long Term Loyalty Analytics, Consumer Relationship Icons, Product Value, and Enterprise Growth Motion Graphic
00:12
HD
Animated Security Status Meter.Measure Security Levels from Low to High with Dynamic Increasing and Decreasing Gauge, Ideal for Data Visualization, Performance Tracking, and Motion Animation
00:10
HD
Sustainable Globe Reflecting Eco-Friendly Icons in Sunlit Forest Moss for Green Future
00:08
HD
Glowing neon line House under protection icon with up arrow isolated on black background. a glowing light drawing a neon outline of houses decreasing in size. House, home building. 4K animation Video.
00:10
HD
Cost reduction business finance concept. Businessman cost reduction icon with down arrow for budget management and 4k Animation video on Black Background
00:10
HD
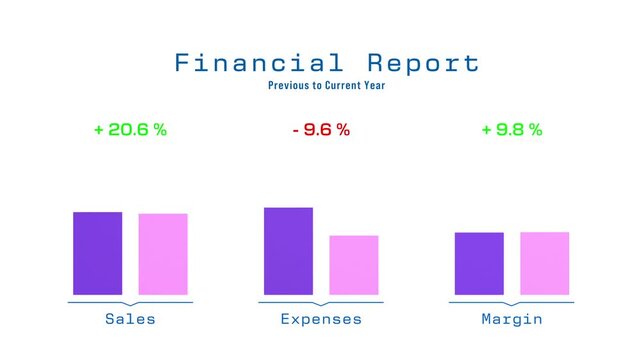
Financial report bar chart with rising sales, and margin, reduced expenses compared last year to the previous year. Business data, profitability, corporate data, research, financial figures, planning.
00:10
HD
Interest rate increase arrow animation.Financial, business, and statistical analysis.
00:10
HD
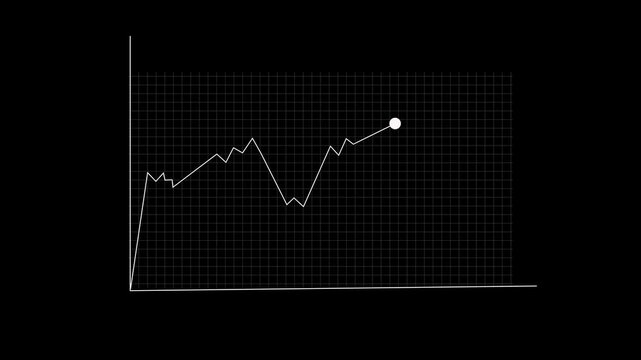
White line graph showing a peak and decline on grid. White line graph for business data and trend. Digital white line graph animation for report.
00:06
HD
Abstract decrease icon on green background. Ruble rate up looped icon. white reduce costs sign and symbol.
00:06
HD
Red Arrow Pointing Down in Front of Glass Bar Chart Showing Financial Decline
00:05
HD
0-100 neon glowing upload completed animation on a black background. Progress bar indicator from 0 to 100 increasing percentage.
00:10
HD
4k video Neon business graph Profit and cost future concept up business graph icon animated Success , profit, growth concept.......
00:10
HD
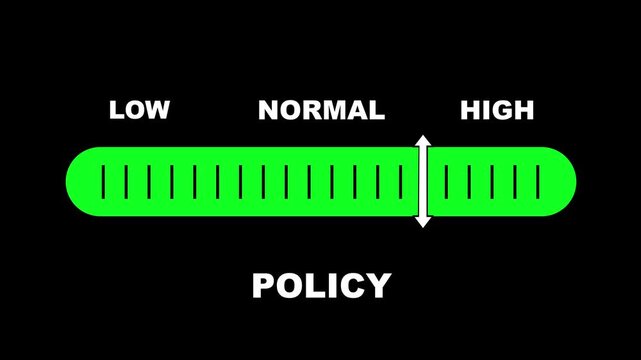
Policy level indicator scale. Low normal & high meter infographic animation on black background. Showing high policy level color gauge indicator for business governance and management analysis.
00:10
HD