A link to set your password has been sent to: To access your purchases in the future you will need a password.
Create without limits — unlimited downloads, plus powerful AI editing
New filters added
Sort by

19,767 results for increase and decrease in videos

Blue down and pink up neon arrows glowing on a black background
00:08
HD
Animated Red Bar Chart Showing a Declining Negative Business Trend
00:09
HD
animation of 3 bar chart in different color and available in 6 variation  growth trends
00:34
HD
Portion level indicator scale. Low Normal High meter infographic animation on black background. Showing high portion level color gauge indicator for healthy eating and nutrition monitoring
00:10
HD
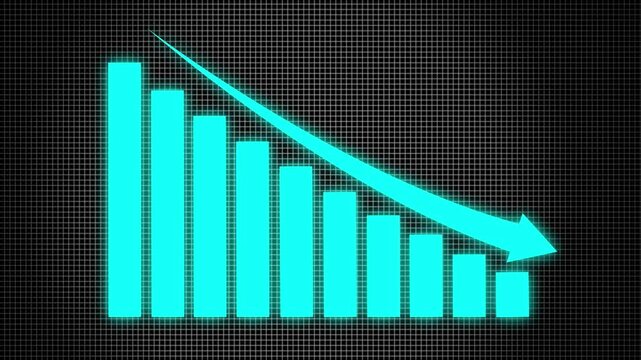
Declining bar chart with downward trend, Blue bar chart with falling line graph decline in business data, finance performance and analytics animation
00:07
HD
Animated interface icons with growth decline idea and alert symbols on white background
00:08
HD
White fluffy mycelium threads fill a mold around a small object, creating soft packaging that later breaks down into dark soil
00:15
HD
Business Team Collaborating on Climate Action Strategies While Analyzing Data for Achieving Net Zero Carbon Emissions and Sustainable Practices Sigmoid
00:12
HD
Animated White Bar Chart Showing Growth and Data Fluctuations on Green Screen for Business Statistics
00:05
HD
Down arrow business graph chart animation. Loss business graph icon animation.  on black background. 4k video
00:10
HD
decrease icon animation video. dollar rate decrease today.
00:05
HD
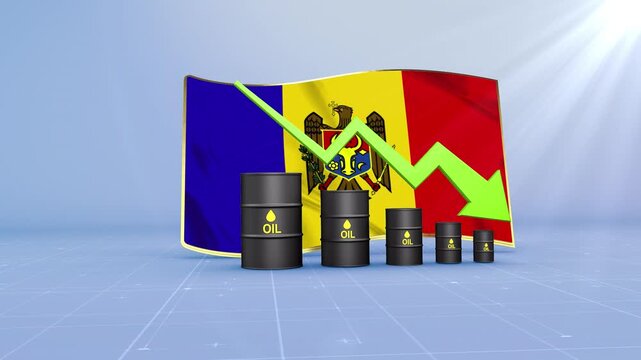
Moldova Oil Price Falling with Oil Barrels Downward Green Arrow and 3D Financial Data Visualization Graphs for Economy and Business Concept
00:11
HD
Simple bar and line chart showing business graph data trend and growth animation
00:07
HD
Business graph chart arrow line down red color animation on white background. growth concept red moving.
00:13
HD
Red chart background glows with financial data. White and orange candlesticks show market movements. Green and yellow lines track rising and falling trends
00:10
HD
Vertical adjustment bar animation with orange and yellow gradient level indicator on transparent background
00:08
HD
Business graph chart drop circle with down arrow moving animation on white background. Decreasing business graph and down arrow for business loss falling, bad economy recession concepts
00:10
HD
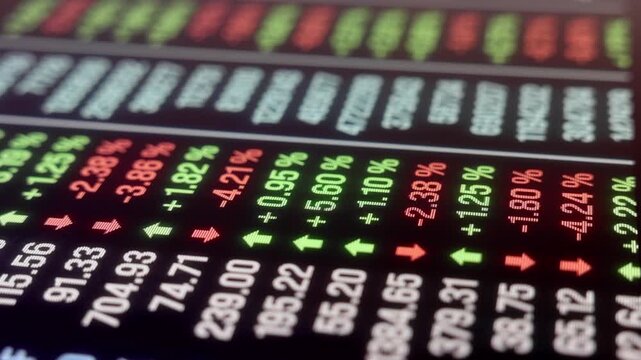
Close-up stock market trading screen with market data, trading volume, prices and percentage changes. Investment strategy, analyzing, data spreadsheet, financial figures, trading board, exchange infor
00:10
HD
Animated price tag with downward arrows indicating cost reduction
00:08
HD
Modern supply chain management system optimizing inventory control and logistics, integrating data, planning, and cost reduction strategies for efficient business operations
00:17
HD
Business efficiency concept with business plan strategy and setting icon animation illustrating process optimization, cost reduction and corporate productivity enhancement.
00:10
HD
Bar chart for declining business performance by month. the curve shows a downward move .chart graph animation, 4k arrow is making downfall on a grid ...
00:10
HD
Small red percent symbol button centered on warm gradient
00:05
HD
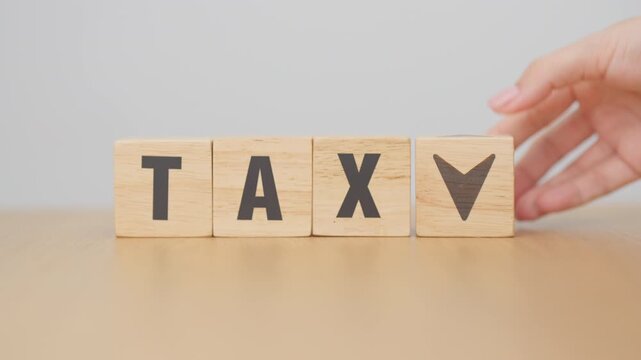
hand change wooden block with TAX text to UP and Down arrow icon. decrease and Increase, Taxpayer, Taxable Income, Tax Filing, Deduction, Withholding Tax, WHT, VAT, Computation and Exemption concept
00:08
HD
business graph chart and success arrow indicating profit profit and loss business plan motion graphics.
00:10
HD
glowing neon Global business analyzing concept with trade. Financial figures and charts showing a downward trend, business crash and economic collapse 4k video animation.
00:10
HD
Animated star of black dots pulsing on white. Minimalist stipple style star expanding and contracting, motion graphics
00:05
HD
Growth Projection for Net Zero Goals with Graphical Data Representation and Business Team Discussion Overhead in a Modern Office Environment Sigmoid
00:20
HD
Downward Trending Bar Chart with Red Arrow on Black Background graph data
00:07
HD
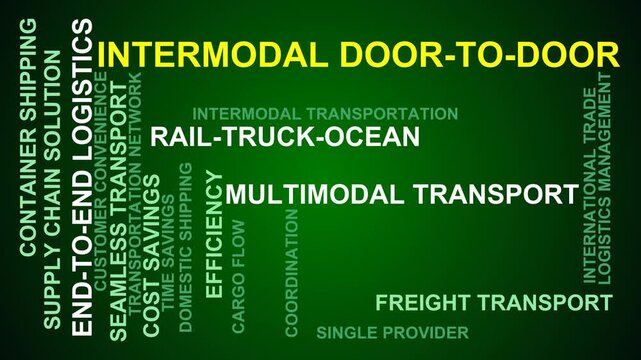
Intermodal Door-To-Door Word Cloud
00:11
HD
Candles of the stock market, price falls. Falling prices of securities. Loss of assets in equities stock. Decreasing trend showing unsuccessful performance and losses failure due to economic.
00:10
HD
Djibouti Oil Price Falling with Oil Barrels Downward Green Arrow and 3D Financial Data Visualization Graphs for Economy and Business Concept
00:11
HD
Animated yellow bar chart and line graph showing financial data on grid background
00:10
HD
Energy level indicator scale. Low Normal High meter infographic animation on black background. Animation showing high energy level color gauge indicator for power and performance monitoring.

00:10
HD
Bright white 3D number 2014 text animation floating against a deep black void offering a vibrant and modern visual for the year with a sense of digital energy.
00:10
HD
Quarterly sales performance chart with green and red bars on dark background.
00:05
HD
Retro 8-Bit Pixel Art Style Audio Volume Level Bar Animation with Speaker Icon on Dark Background
00:10
HD
Red bar chart showing a downward trend with a glowing arrow on a dark background
00:12
HD
Business crisis line chart animation with downward arrow loop on black background...
00:13
HD
Corporate Revenue Growth Dashboard Animation with Positive Trend Visualization
00:13
HD
Business strategy visualizing annual operational savings, managing financial risks, and achieving cost reduction through budgeting, planning, and automated efficiency, aiming for profit growth
00:17
HD
Churn rate Blue fintec KPI dashboard card showing customer loss percentage, decrease indicator and trend chart. Animated motion graphics component for subscription analytics, SaaS reports, retention
00:10
HD
Minimalist bar chart animation showing declining business trends
00:10
HD
Abstract increase icon on green background. Dollar rate up looped icon. Reduce costs sign and symbol. 4k video animation
00:10
HD
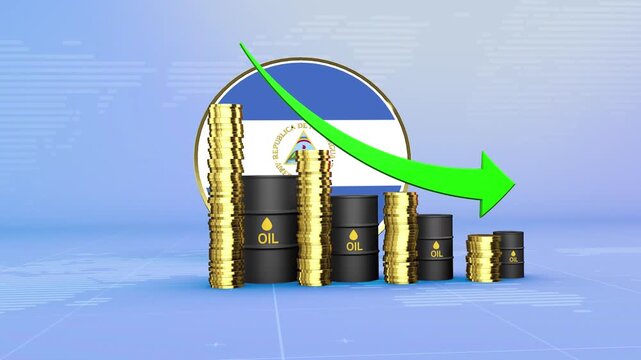
Nicaragua Oil Prices Decline with Oil Barrels, Gold Coins and Downward Green Arrow, 3D Economic and Financial Market Concept
00:11
HD
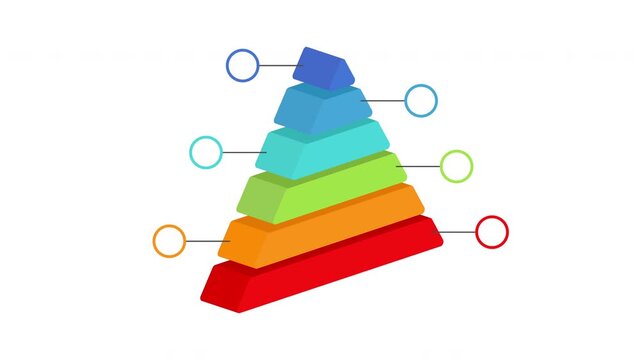
Commercial infographic animated 3D pyramid consisting of 6 blocks
00:07
HD
Glowing neon line graph downwards against black background animation. Stock market losses and descending trading graph and downward arrows recession
00:10
HD
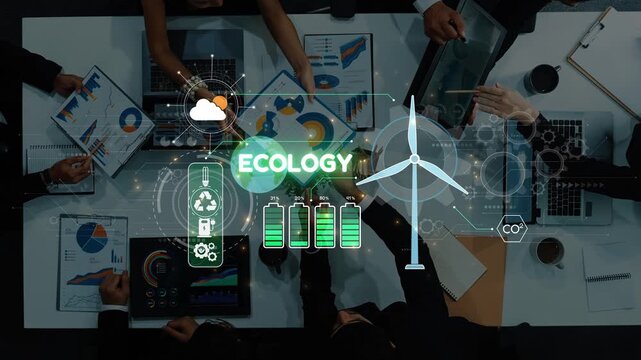
A dynamic business meeting focused on ecology and sustainability with professionals analyzing data and engaging with visual elements related to renewable energy. Raster
00:12
HD
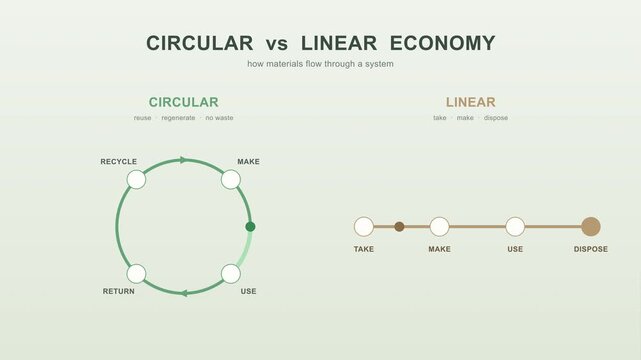
Circular vs linear economy diagram showing resource cycles, sustainability, and waste reduction concepts
00:08
HD
acceleration race
00:10
HD
word LOSS dips letter by letter as a red downward graph line draws beneath it and ends in a descending arrow. Useful for financial loss with a transparent alpha channel for compositing
00:08
HD
Animated of down business graph icon .business or finance concept icon ,Animated illustration of a downward statistical curve with a loss sign business graph...
00:10
HD
Simple bar and line chart showing business graph data trend and growth animation
00:07
HD
Threat level indicator scale. Low normal & high meter infographic animation on black background. Showing high threat level color gauge indicator for safety and risk monitoring
00:10
HD
Bright white 3D number 2034 text animation floating against a deep black void offering a vibrant and modern visual for the year with a sense of digital energy.
00:10
HD
Red Bar Chart Declining Trend Data Analysis Business Growth.
00:10
HD
Two curved arrows pointing in opposite directions minimal animation
00:06
HD
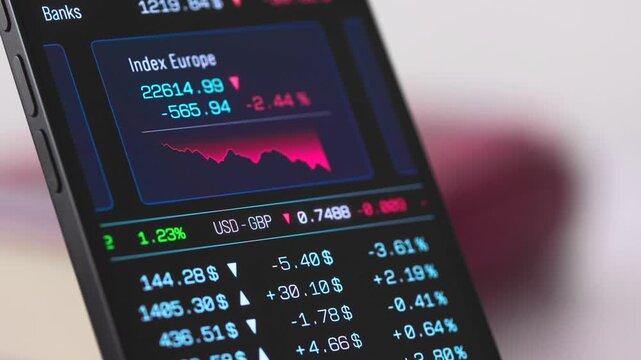
Smartphone screen shows trading board with European index chart down, currency and sector data, stock market information. Business, trading board, computer screen, prices, trading volume, investment,
00:10
HD
Two yellow circle icons showing a smartphone with a minus and a plus sign, ideal for adding or removing devices, apps, users and device management
00:10
HD
Financial Growth Trend Animation with Positive Revenue Indicators
00:09
HD
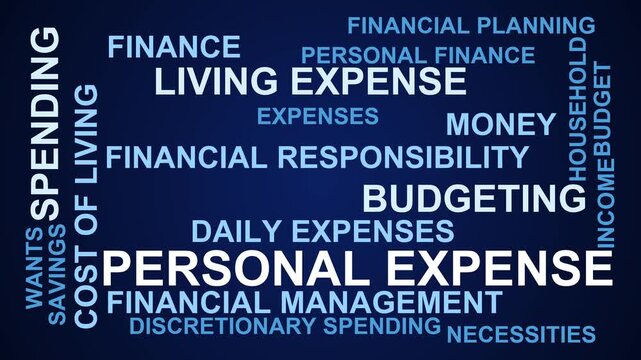
Personal Expense Word Cloud
00:11
HD
Hand Drawn Animated Up and Down Arrow Graph Green Screen Chroma Key
00:10
HD
Animated Stress Level Gauge Infographic Illustrating Mental Health Tension and Overwhelm
00:07
HD
Business growth concept animation, Business line arrow .Chart arrow still goes Down animation. Graph decreasing. Business animation. Economy concept. arrow down
00:10
HD
Gold coin stacks as growth charts on dark background
00:10
HD
Declining business bar chart with downward arrow representing falling sales, reduced revenue, financial losses, market decline, decreasing performance.financial loss icon.
00:10
HD
Neon Red and Pink Bar Chart with Percentage Labels on Dark Grid animation Background graph data. Vibrant neon red and pink bar graph animation with percentage indicators on dark grid display.
00:08
HD
A robotic hand points at a digital cost chart with a declining trend in a modern business office, illustrating the intersection of technology and finance analysis. Synapse
00:12
HD
winrate level indicator scale. Low normal & high meter infographic animation. Showing high winrate level color gauge indicator. on a white background 4k animation video
00:10
HD
White downward arrow for cost and upward arrow for with percentage symbols on a solid black background for business performance analysis
00:10
HD
LGBTQ economic bar chart graph showing decreasing downturn with national Flag 3D animation on black background.
00:16
HD
Thyroxine Level Gauge Increasing and Decreasing Indicating Metabolic Activity Animation
00:19
HD
Vibrant neon glowing arrow animation transition effect dynamic digital motion futuristic u i symbol
00:10
HD
Abstract increase icon on green background. Dollar rate up looped icon. Reduce costs sign and symbol. 4k video animation
00:06
HD
Bright white 3D number 2048  text animation floating against a deep black void offering a vibrant and modern visual for the year with a sense of digital energy.
00:10
HD
Green arrow pointing down over a dollar sign icon on a black background
00:10
HD
Modern line graph displays falling investment market trends. Technical line graph monitors negative corporate revenue data. Financial crisis concept with digital line graph.
00:10
HD
Futuristic dollar countdown timer animation, glowing dollar symbol integrated with a circular countdown display, numbers decreasing smoothly from 0 to 30,
00:10
HD
Candle stick chart and two lines graphs, moving average and market data. Banking, moving up and down, finance, equity, investment, making money, strategy, stock market trend, stock trading.
00:14
HD
HUD particle and elememt three graph radar pointer with percent text and radar reletion with scale bar on the black screen
00:14
HD
Zigzag line with a downward arrow falling trend loss decline and negative business direction animation
00:06
HD
Animated fire icon with percentage progress bar on dark background.
00:07
HD
graph chart up down business statistics
00:10
HD
Downward zigzag arrow symbolizing decline loss or falling trend animation
00:05
HD
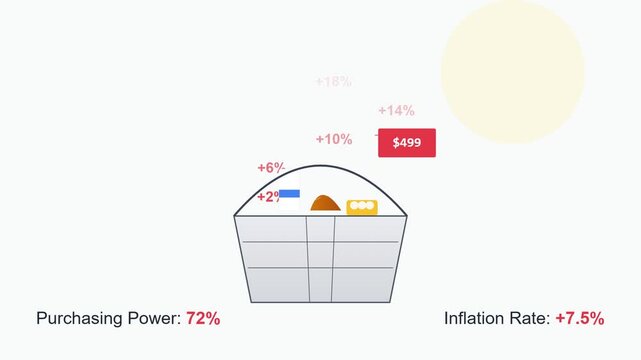
Inflation and Purchasing Power Concept Illustration with Grocery Basket
00:10
HD
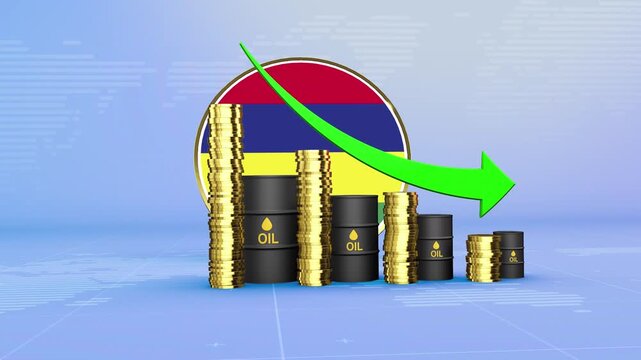
Mauritius Oil Prices Decline with Oil Barrels, Gold Coins and Downward Green Arrow, 3D Economic and Financial Market Concept
00:11
HD
Neon blue bar graph animation. Animated data technology business finance abstract background looping motion graphics modern digital presentation visuals financial growth success progress statistics.
00:12
HD
A close-up image of hands typing on a keyboard integrated with digital icons showcasing cost reduction, data analysis, and performance metrics for business growth. Qubit
00:14
HD
Minimalist animated line chart with a smooth up and down movement
00:06
HD
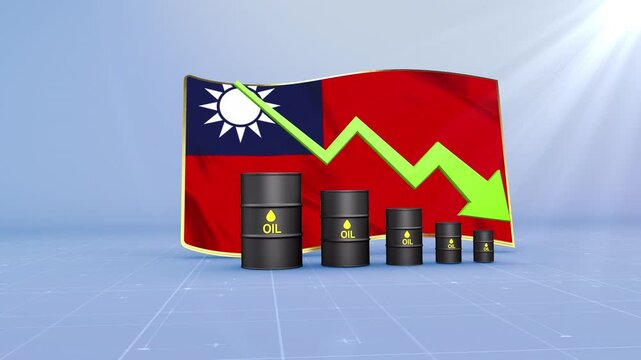
Taiwan Oil Price Falling with Oil Barrels Downward Green Arrow and 3D Financial Data Visualization Graphs for Economy and Business Concept
00:11
HD
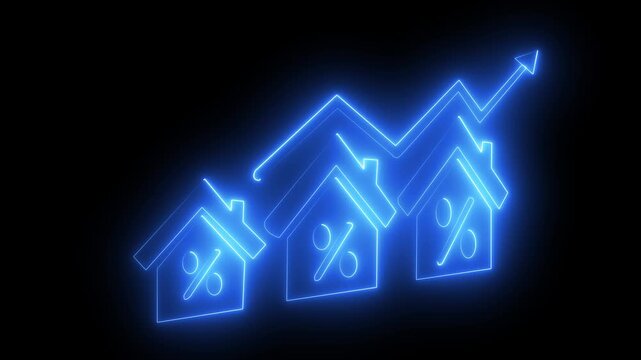
Glowing neon line House under protection icon with up arrow isolated on black background. a glowing light drawing a neon outline of houses decreasing in size. House, home building. 4K Video.
00:10
HD
changes level indicator scale. Low normal & high meter infographic animation. Showing high changes level color gauge indicator. on a white background 4k animation video
00:10
HD
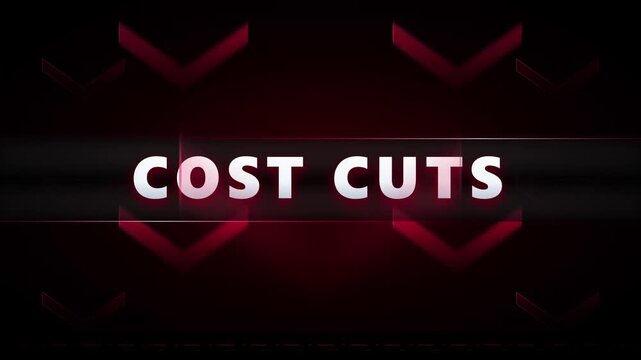
Cost cuts business concept motion with red arrows and typography finance savings
00:08
HD
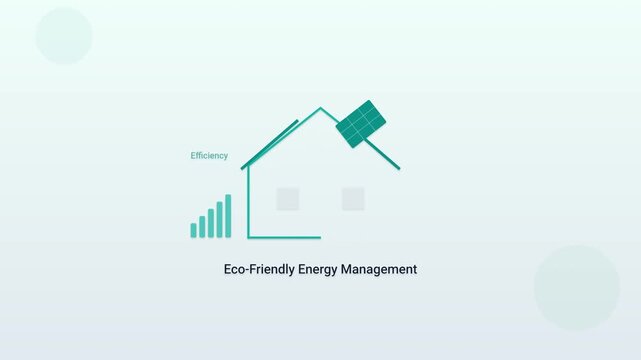
Eco Friendly Energy Management Concept Animation with Solar House
00:10
HD
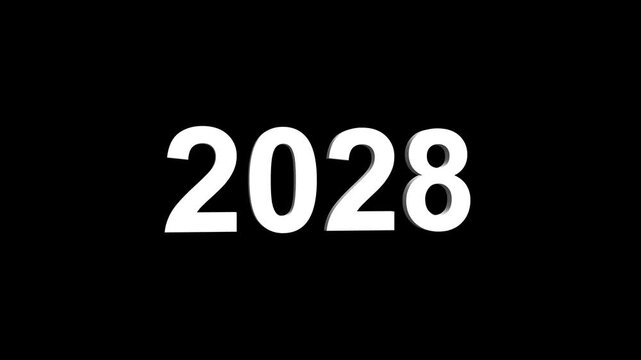
Bright white 3D number 2028 text animation floating against a deep black void offering a vibrant and modern visual for the year with a sense of digital energy.
00:10
HD
Dynamic financial market analysis showing fluctuations in stock prices over time
00:10
HD
Financial Graph Declining as Particles Dissolve Against Black Background
00:07
HD
Colorful bar chart displayed on a dark dashboard interface.
00:10
HD
Businessman walks down a long hallway with green plants on the walls. ESG Environmental, social, and governance, carbon reduction decarbonization net zero and climate change
00:05
HD
Video with the phrase Sell Your Knowledge in Spanish, animated word by word with letter spacing reduction and sharp zoom transitions, delivered in four background and outline versions.
00:12
HD