A link to set your password has been sent to: To access your purchases in the future you will need a password.
Create without limits — unlimited downloads, plus powerful AI editing
New filters added
Sort by

19,766 results for increase and decrease in videos

Neon Celsius thermometer displayed temperature 17 degree. Digital Temperature Meter Display 17°C. That's indicates weather temperature 17 degree increase or decline.4k video.
00:10
HD
Business professional analyzing data on smartphone with AI technology interface showcasing quality and cost metrics against a city skyline backdrop Sigmoid
00:10
HD
Dynamic downward trend line animation stock visual representation business finance market analysis
00:10
HD
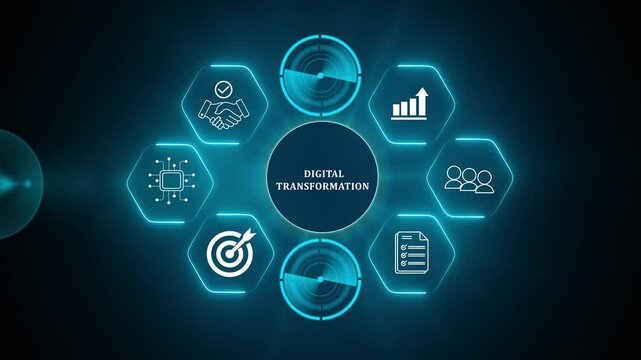
Digital transformation in business concept. Leveraging modern technologies; automation, data analytics, cloud computing and AI to increase efficiency, reduce costs and gain competitive advantage.
00:12
HD
Restrictions gauge rises from low to high before falling, presenting changing limits, regulation, pressure, risk, recovery, and improving business conditions with copy space
00:40
HD
Production Tax Credit Word Cloud
00:09
HD
Large black shekel symbol zooms in and out at the center, surrounded by four small copies. Seamless looped 4k animation on white background
00:12
HD
Business Analytics Dashboard Motion Graphic with Growth Statistics
00:10
HD
Abstract background with rising and falling arrows showing growth decline data flow and business trend concepts animation
00:18
HD
graph chart up down business statistics
00:08
HD
Gray business graph chart growth up down or signal on transparent background with alpha channel. Business up and down signal concept animation in 4k.
00:10
HD
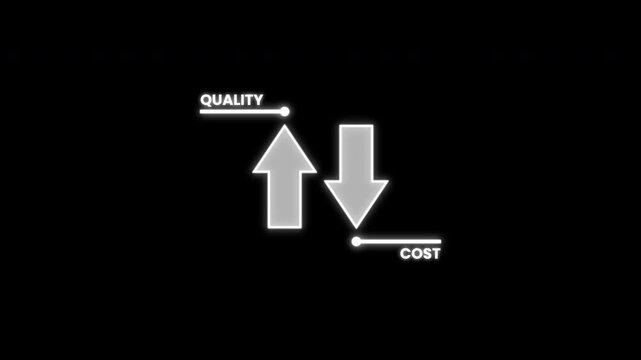
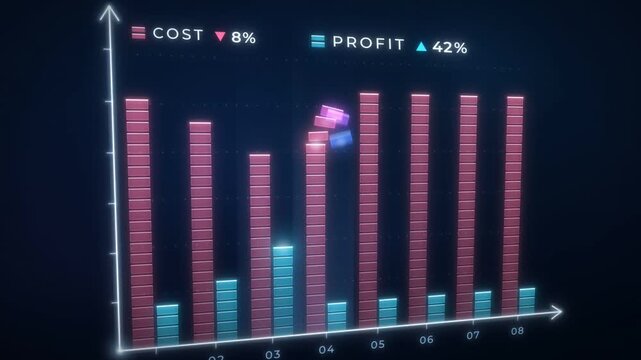
Glowing Neon Quality vs Cost Arrow Graph Motion Graphic Loop Dark Red Background Video
00:10
HD
Curved arrow pointing down and to the right with a flowing shape animation
00:06
HD
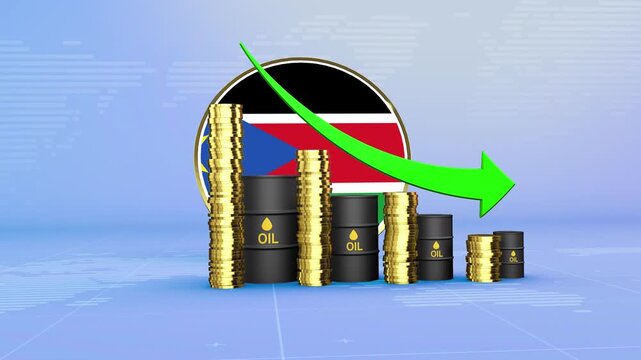
Somalia Oil Prices Decline with Oil Barrels, Gold Coins and Downward Green Arrow, 3D Economic and Financial Market Concept
00:11
HD
Money reduction icon animation. circle with down arrow moving animation. 4k video
00:08
HD
Dynamic bar graph animation with recursive red arrows, representing growth, analysis cycles, and feedback loops, for business data visualization and financial reporting.
00:05
HD
Business strategy visualizing continuous improvement, waste reduction, and process streamlining leading to increased efficiency and overall productivity for company operations
00:17
HD
Housing market trend motion with city skyline and fluctuating graph. 4k
00:08
HD
Green up arrow and red down arrow motion animation comparing growth and decline, success and failure concepts on clean minimalist background
00:16
HD
Business concept for quality improvement and cost reduction. Bar and arrow showing quality control growth graph and cost optimization. Successful organization strategy and management
00:10
HD
Neon style rotating bar graph animation on black background representing data analysis and market trends
00:08
HD
Visual Representation of Artificial Intelligence Impact on Quality and Cost in Business Environment with Silhouettes and Cityscape Background Sigmoid
00:10
HD
Cost reduction concept. Cost wording on decrease money with down arrow. Cost Management, Economy recession, low budget,4k
00:10
HD
Abstract representation of a declining financial graph with data points
00:06
HD
Business graph chart with growing business concept. Abstract decreasing business graph chart animation background.Motion graphics of concept
00:10
HD
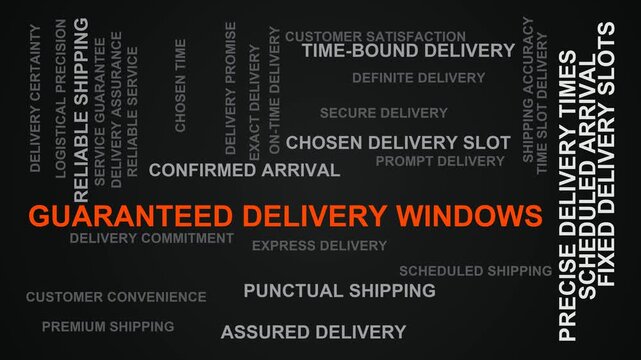
Guaranteed Delivery Windows Word Cloud
00:11
HD
Business growth concept in graph chart showing marketing sales profit increasing to future target . growing business concept. Clean Hi-tech style technology chart ,Graph animation 4k video..
00:10
HD
Business Analytics Dashboard Motion Graphic with Growth Statistics
00:10
HD
Simple bar and line chart showing business graph data trend and growth animation
00:07
HD
Zoom in and out animation the close symbol. Large black symbol in the center and four small symbols around. Seamless looped 4k animation on white background
00:12
HD
Colorful 3D bar graph with varying heights against a dark background chart data
00:05
HD
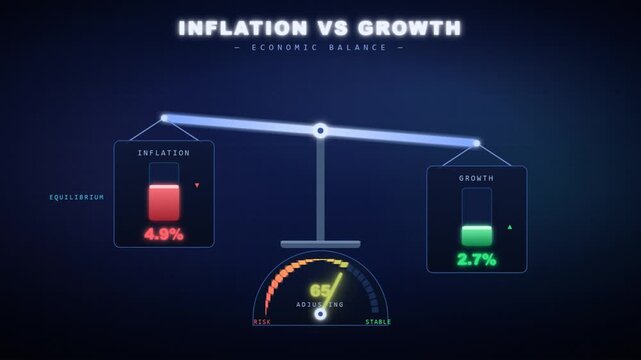
Economic balance scale animation weighing high inflation risk against low GDP growth
00:12
HD
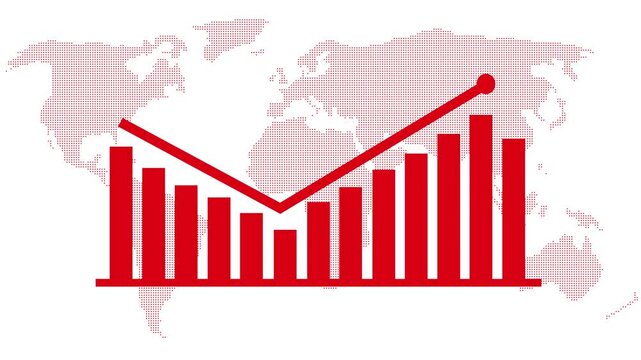
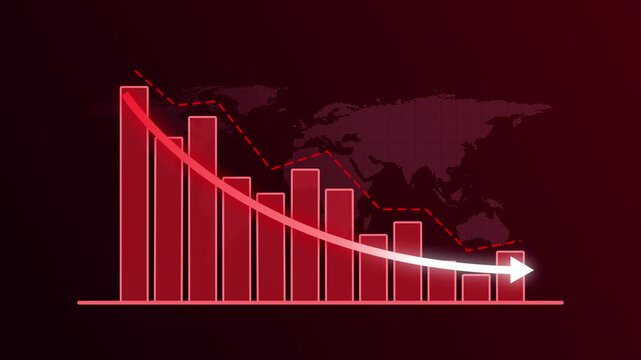
Animated Red Bar Chart with Falling Arrow and Downward Trend Line on Global World Map, Business Decline and Financial Loss Concept
00:10
HD
Cost cuts neon hud financial savings and budget reduction concept animation finance
00:08
HD
glowing green neon arrow pointing down, indicating decrease or negative trend on a dark background, perfect for business and finance data visualization and modern tech presentations.
00:07
HD
Upward arrow direction One line continuous drawing animation. animated hand- drawn banner lineart illustration design. isolated sign symbol monoline video golden outline on white background backdrop
00:10
HD
Online shopping offering discounts on merchandise and digital services, with a speedometer indicating price decrease and financial transactions moving towards customer savings
00:17
HD
Cost Reduction Business Growth Motion Graphics Line Chart Arrow Down Concept, Financial Loss Analysis, Budget Cut Optimization, Downward Arrow Graphic with Text Animation on Black Background.
00:10
HD
Animated quality and cost comparison graphic featuring opposing arrows, business concept visuals for presentations and marketing, 4K video with an alpha channel
00:10
HD
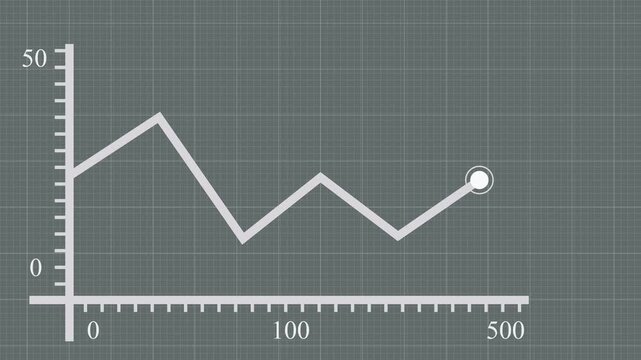
Dynamic financial graph motion graphic, animated business chart illustrating growth and decline over time
00:10
HD
Neon Celsius thermometer displayed temperature 43 degree. Digital Temperature Meter Display 43°C. That's indicates weather temperature 43 degree increase or decline.4k video.
00:10
HD
Digital illustration showcasing the balance between quality and cost in artificial intelligence with a futuristic representation of data analysis metrics Sigmoid
00:10
HD
Neon 3d Arrow Animation Displaying Quality One Hundred Percent Increase And Cost Decrease With Floating Particles Transparent Alpha Channel For Business Infographics Loop Motion Graphics
00:12
HD
Close-up trading screen with index charts, currency and sector data, stock market information. Business, trading board, computer screen, prices, trading volume, investment, financial markets.
00:10
HD
South Sudan Oil Prices Decline with Oil Barrels, Gold Coins and Downward Green Arrow, 3D Economic and Financial Market Concept
00:11
HD
Meaning And Purpose Word Cloud
00:11
HD
Budget dashboard with donut chart and rising savings, alpha channel
00:15
HD
Revenue and Profit Growth Animation for Corporate Business Reports
00:08
HD
Business graph chart with growing business concept. Abstract decreasing business graph chart animation  arrow on background.
00:10
HD
Zoom in and out animation the share arrow symbol. Large black symbol in the center and four small symbols around. Seamless looped 4k animation on white background
00:12
HD
Blue bar chart with white arrow going down on green screen chroma key background for business loss decrease overlay effect
00:08
HD
Special Offer Promotional Graphic with Big Sale Text and Up to 80 Percent Discount on Bright Green Background
00:15
HD
Animated vertical volume control slider on dark background
00:07
HD
Mobile Network Signal Strength Animation
00:15
HD
Orange sticker with black outline displaying 10 percent text
00:08
HD
Animated thermometer showing temperature rising from cold to hot on a green screen.
00:10
HD
Personal debt reduction plan the strategic process of managing financial responsibilities, involving budgeting, repayment, and time management to achieve economic freedom
00:17
HD
Increase and decrease line animation on financial business chart. Economic graph icon on white background for finance concepts and analytics.
00:10
HD
Stock Market Crash Illustration with Decreasing Graph and Arrow Going Down.. chart growth achievement digital. business growth currency stock and investment economy. Graph trending downwards.
00:10
HD
Financial Loss and Declining Monetary Performance Shown by a Red Downward Trend Line, Representing Revenue Decline, Capital Loss, Risk and Negative Growth
00:10
HD
Neon Celsius thermometer displayed temperature 30 degree. Digital Temperature Meter Display 30°C. That's indicates weather temperature 30 degree increase or decline.4k video.
00:10
HD
Net zero goals and CO2 reduction strategy driving sustainability, green energy integration, net zero emissions policies, and climate-friendly sustainability solutions for business and society. Muxer
00:16
HD
Glowing red neon percentage symbol sign pulsing on black background, for sales and, marketing promotions
00:10
HD
Business graph chart drop circle with down arrow moving animation on black background. Decreasing business graph and down arrow for business loss falling, bad economy recession concepts
00:10
HD
Bar chart animation with separate trends. Bar chart financial up and down arrows. Bar chart business statistics graphic on black background for market comparison.
00:08
HD
Pressure Regulator Word Cloud
00:11
HD
Business graph chart arrow line down white color animation on black background. growth concept white moving.
00:15
HD
Neon Modern Infographic Growth Animation with Increasing Business Metrics
00:12
HD
Animated speedometer gauge measuring oil and gas prices surges to maximum red zone creating global inflation and economic crisis, then quickly drops down indicating market stabilization.
00:40
HD
Financial bank graph with down arrow and dollar sign with up arrow suitable for finance concepts, economic downturn, stock market analysis.
00:06
HD
Bright white 3D number 2022 text animation floating against a deep black void offering a vibrant and modern visual for the year with a sense of digital energy.
00:10
HD
Vertical bar graph analytics statistics neon financial metric icon 4k video graphics
00:06
HD
Turquoise Bar Graph Declining Over Time During Digital Data Analysis
00:10
HD
Stock Market Candlestick Price Fluctuation Chart
00:07
HD
A conceptual illustrating the benefits of AI with a central glowing turquoise neon AI chip symbol, flanked by boxes showing a downward arrow next to COST and an upward arrow next to QUALI
00:10
HD
stock market red arrow upward growth graph chart animated continuous single line drawing isolated on white background, line art animation illustration design sign symbol video direction
00:10
HD
Promotional price settings concept business partners agreeing on discount strategies, managing costs, and adjusting value for effective marketing campaigns and sales growth
00:17
HD
Animated percent down line graph icon, white line chart decreasing, motion graphic footage
00:06
HD
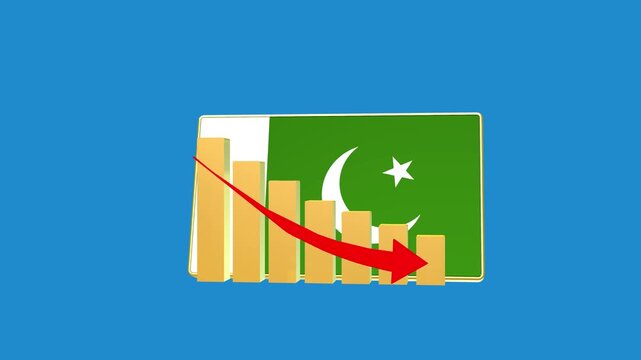
Pakistan economic bar chart graph showing decreasing downturn with national Flag 3D animation on black background.
00:16
HD
Abstract increase icon on black background. Dollar rate up looped icon. Reduce costs sign and symbol. motion video 4k quality..
00:06
HD
Cost reduction business finance concept. Businessman cost reduction icon with down arrow for budget management and cost management.4k video animation.
00:10
HD
A visually striking image featuring hands typing on a keyboard with illuminated indicators for quality and cost, symbolizing digital business analysis and strategic decision-making. Qubit
00:14
HD
Abstract background with rising and falling arrows showing growth decline data flow and business trend concepts animation
00:18
HD
Bar chart animation displays declining columns with a downward arrow on dark. Financial market loss reflects on this bar chart. Negative economic data marks chart.
00:07
HD
Moving digital Business Growth Financial Trading Chart and Stock Market Data Animation looping Seamless Motion Background. Business stock data concept
00:25
HD
3D Blue Upward Arrows Animation on Black Background, Declining Trend and Business Loss Concept
00:08
HD
Professional business growth graph chart with rising monthly revenue, glowing arrow animation, and increasing sales performance on black background illustrating financial goals
00:17
HD
Corporate Revenue Growth Dashboard Animation with Positive Trend Visualization
00:13
HD
Cost and profit bar chart, cost bars shrink as profit bars grow until trend lines cross at break even point
00:16
HD
Hand drawn white zigzag arrow moving downward and upward on a dark background. 4K horizontal video
00:06
HD
Digital transformation in business concept. Leveraging modern technologies; automation, data analytics, cloud computing and AI to increase efficiency, reduce costs and gain competitive advantage.4k
00:10
HD
Blue 3D Percent Symbol on Black Background for Finance, Discount and Business Concept
00:10
HD
Digital Volume Control Animation Increasing and Decreasing, Isolated on Green Screen
00:10
HD
Animated hand drawn arrows indicating growth and downward trends. 4K
00:52
HD
Business graph chart arrow line down red color animation on white background. growth concept red moving.
00:15
HD
Arrow continuous line 4K animation video showing downward direction on a minimal background
00:10
HD
Lean workflow mapping outlining efficient strategies for business process optimization, improving productivity, and achieving cost reduction through strategic planning
00:17
HD
Pixelated bar chart shows downward trend, illustrating financial loss, recession, data analytics, market crash
00:06
HD
Cyan animated bar graph chart business finance technology data visualization motion graphics. Financial data animated cyan bar graph business technology visualization motion graphics loop.
00:12
HD
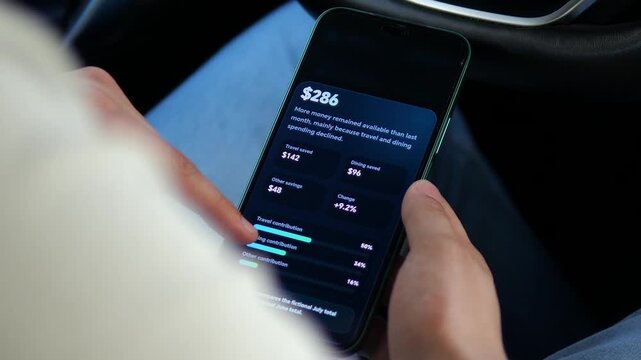
User reviews a mobile savings analysis showing higher month-over-month retention as reduced travel and dining expenses strengthen personal budgeting and financial resilience.
00:07
HD