A link to set your password has been sent to: To access your purchases in the future you will need a password.
Create without limits — unlimited downloads, plus powerful AI editing
New filters added
Sort by

876,380 results for caption in videos

200 Percent Growth Counter Animation from 0 to 200 with Up Arrow Indicator in 4K, Business Growth, Success Rate, Analytics and Progress Increase Motion Graphic, 200% Growth on Transparent Background.
00:07
HD
Stock market ticker terminal screen showing multiple live trading graphs and financial charts
00:30
HD
4K teal upward arrows with top caption and rising particles, success concept motion backdrop
00:15
HD
A detailed view of hands on a laptop and paperwork, colleagues collaborating over data charts in a fast-paced office meeting.
00:15
HD
Professional typewriter text animation featuring realistic typing and a blinking cursor with editable text. Perfect for titles, quotes, presentations, intros
00:07
HD
Futuristic Artificial Intelligence Network with Neon Data Connections, Digital AI Chip Interface, Glowing Technology Circuits and Connected Data Streams on a Dark Background
00:10
HD
Young Businessman Presenting Data Dashboard on Screen in Modern Office
00:13
HD
A young professional is examining investment data graphs and charts, analyzing financial information, and monitoring stock market trading reports.
00:38
HD
Rising Inflation and Interest Rates Financial Graph Animation
00:17
HD
Org Chart Hierarchy Tree Diagram Growing From Root With Nodes Lighting In Sequence, Seamless Loop in bright emerald tones
00:10
HD
Luxury golden happy anniversary seamlessly loopable text animation with shimmering gold particles and glitter overlay for cinematic romantic wedding milestone celebration video title opener
00:14
HD
Hand placing a bar on a chart while displaying various types of graphical representations, concepts of data analysis, financial growth, and business strategy
00:17
HD
GDP growth economic indicator chart with rising bar graphs and HUD radar
00:15
HD
Business people analyzing business growth chart and discussing company strategy
00:24
HD
Glowing blue coastlines fine light rays define Earth, leaving for text on the right. telecom promotions, global economy stories, corporate presentations, geography explainers, and broadcast graphics.
00:20
HD
Stock market candlestick chart hologram on digital world map,global financial index analysis,business economy investment.Global market analysis world map with stock market graph overlay animation
00:15
HD
soaring inflation video animation vertical concept
00:08
HD
Blue subtitle background, dynamic lighting effects, square technological background
00:10
HD
Oil Industry Growth Visualization with Graphs and Icons
00:10
HD
Man, presentation and charts with review for team at office meeting, board and explain at finance company. Person, speaker and insight with graphs, feedback and collaboration at investment agency
00:20
HD
Business team meeting at office desk analyzing charts and financial reports, hands using calculator and tablet for planning and strategy.
00:13
HD
Abstract digital project management board with interactive task cards and notifications on a dark purple background
00:10
HD
Business Stats Market And Infographics On Computer Screen
Animation of a business and market data analysis and reports with infographics layout bar stats charts and diagrams on a computer screen
00:14
HD
Elegant woman and her colleagues working in office, top-management of company. Contemporary empowered women, career in old age, active life and work, senior ladies in boardroom, female professionals
00:07
HD
Business Innovation Light Bulb with Startup and Growth Icons
00:09
HD
Data visualization animation showing digital bar charts and abstract network nodes moving across white background in dynamic business video footage
00:10
HD
Business colleagues collaborating on a financial report using a digital tablet and computer in a modern office at night
00:16
HD
Business optimization technology concept featuring intelligent process improvement, enterprise efficiency management and digital performance enhancement.
00:14
HD
Woman walking in business cafe tapping phone and activating data bars and waves, tracking metrics
00:12
HD
Software Engineer Codes and Tests a Mobile App in a Modern Office, Using Multiple Monitors With Programming Scripts, Interface, Data Charts, Digital Product Development.   Working Using Computer
00:16
HD
Animated horizontal line chart with glowing area fill showing positive business growth trajectory on dark background
00:08
HD
Depressed stock market loss and bankruptcy financial crisis recession, economic downturn, negative trading performance, investment risk crash, and business debt pressure concept
00:15
HD
Project Manager Updates Agile Task List In Office Diary
00:28
HD
Black and white printed style type of a full screen individual letter with alpha for easy drag and drop overlays. Get the full alphabet set to create captions and words with a cool stop motion printed
00:12
HD
Digital charts global map rising market curves. financial technology, market volatility, economic research, portfolio analysis, trading dashboards, global growth, corporate strategy business news.
00:20
HD
An illustration representing a digital organizational chart set in a modern office, showcasing team structure and collaboration among business professionals for strategic planning. Raster
00:20
HD
Money transfer animation between two account cards, balances update and green sent checkmark appears
00:14
HD
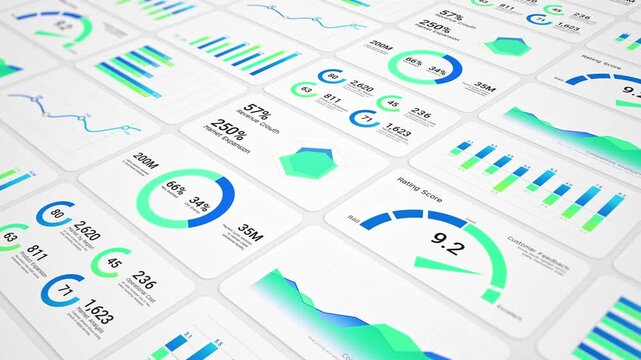
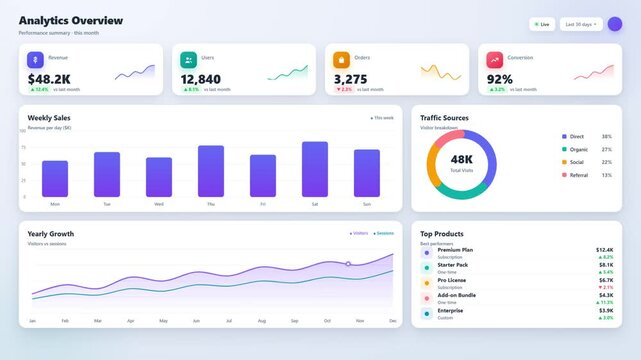
Modern Business Analytics Dashboard Animation with Multiple Data Visualization Panels like Charts, Graphs,  KPI Widgets, And Financial Statistics In A Clean Flat Design. Professional Website Metrics
00:49
HD
Vintage silent movie caption cards with old film effects and scratches. 4k video
00:10
HD
Looping animation showing a digital stock market chart with candlestick data and financial numbers
00:15
HD
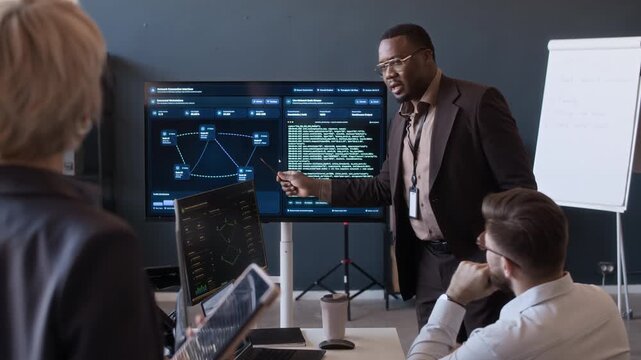
Medium long shot of young Black tech specialist presenting network data on screen to cybersecurity team while meeting in office
00:13
HD
Professional Minimalist Lower Third Graphic Animation with Customizable Text for Video Media Overlay
00:07
HD
Abstract digital candlestick chart with global financial data background, perfect for trading, forex, crypto, and investment presentations. Financial Investment Background. 3d Rendering.
00:20
HD
woman analyst uses a computer AI artificial intelligence and dashboard for data business analysis and Data Management System with KPI and metrics connected to the database for technology finance,
00:10
HD
Close-up of financial charts displaying stock market data on a digital screen. Dynamic red and green graphs represent fluctuating stock prices in a modern trading environment.
00:10
HD
Cinematic shot moves forward along stone-paved embankment, tilting up from green waters of tranquil pond. Smooth motion reveals legendary Ashima Rock standing tall as figurative centerpiece
00:20
HD
Stressed Female doctor nurse sit by laptop computer while reviewing patient medical charts at the clinic office.
00:15
HD
Business intelligence and financial performance analysis report on white background, animated infographic bar chart loop, investment data analytic graph dashboard, enterprise market statistics trend
00:14
HD
Accountant analyst in office reviewing computer data. Screen shows charts graphs and a financial report as coworkers talk nearby in a bright workspace. Simple concept of finance analysis.
00:09
HD
Smart city network showing big data communication and financial charts in downtown Chicago with futuristic digital overlay and information graphics connecting buildings
00:11
HD
Skyscrapers with upward-trending financial chart and rising arrow, symbolizing business growth, investment success and real estate asset value. Ideal for property investment, financial market concepts
00:14
HD
Financial graph chart, market report, arrow up trend chart stock exchange asset, diagram investment capital gain world money economic growth
00:20
HD
Slow Dolly-in Through a Stock Exchange Asset Management Firm, Where a Stockbroker Ceo Studies Live Charts, Weighing Banking Decisions, Strategy and Capital Growth for Corporate Career Success
00:13
HD
Finance growth chart graph stock market upward data analysis business abstract background with rising green line over bar graph showing market trend investment statistic concept digital chart
00:10
HD
Abstract financial chart with glowing digital candlestick data points moving across dark screen representing stock market volatility investment analysis business growth and economic trends.
00:10
HD
Hands typing on laptop with data charts and security icons overlay showing analysis, statistics, and technology insights in a dark modern workspace Gluon.
00:10
HD
Data flow streams converging into a live analytics dashboard with radar chart, bar graphs and system load
00:16
HD
Business growth concept in allusive graph chart showing marketing sales profit increasing to target . Excellent financial status of corporate business rise up.4k animation video graph
00:10
HD
Vintage silent movie caption card. old film effects scratches ornate frame. 4k video
00:15
HD
Seamless looped abstract visualization of financial data, price fluctuations, investment analysis and trading activity. Financial market interface with changing charts. Forex trading concept
00:10
HD
Scheme hierarchy management of corporate. Digital technology of business process and workflow automation with flowchart and processing management.
00:13
HD
Business team analyzing financial data and marketing strategy
00:20
HD
Blue animated business growth bar chart with rising trend line
00:10
HD
woman analyst uses a computer AI artificial intelligence and dashboard for data business analysis and Data Management System with KPI and metrics connected to the database for technology finance,
00:10
HD
financial statistics graph rising prices in stock market and inflation rate
00:15
HD
Animated vintage silent movie caption card with old film frame, dust, scratches, and flicker effects.
00:20
HD
Confident young female business leader woman presenting sales and expenses report on large electronic whiteboard, pointing at graphic benchmarks on screen, speaking to diverse team
00:12
HD
Neon-style bar chart showing descending bars with downward arrow animation
00:10
HD
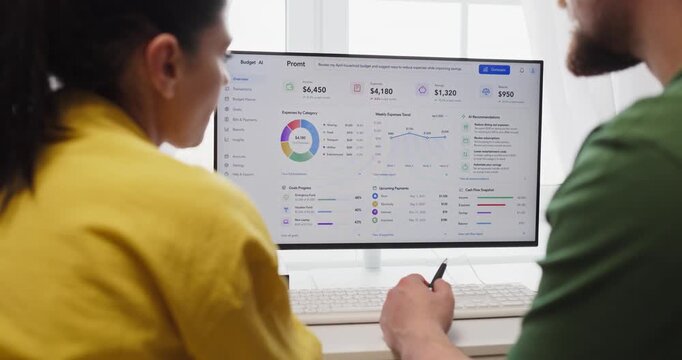
Couple budget planning on finance dashboard online. They review savings and monthly expenses on a computer at home using charts analytics for smarter choices. Clear concept of home finance teamwork
00:08
HD
Smart city skyline of Chicago showing futuristic financial data, stock market infographics, business analytics, big data visualization over urban landscape
00:06
HD
Handheld shot of businesspeople in suits discussing oil transportation contract and shaking hands during corporate meeting. Clip is ideal for energy sector and B2B partnership marketing
00:07
HD
Arrow up trend chart stock exchange asset, diagram investment capital gain world money economic growth, financial graph chart, market report
00:20
HD
Top Down View of Corporate Team Working Around Conference Table With Laptops and Documents as Linked Visualization Layer Appears, Glowing Ai Icons Represent Cloud Storage, Cybersecurity and Analytics.
00:12
HD
Business team discussing financial charts and data on a digital tablet during a meeting in a modern office corporate strategy, and teamwork.
00:19
HD
Scientist in protective hazmat suit analyzes DNA data and scientific charts on a modern computer screen in a high tech medical laboratory
00:13
HD
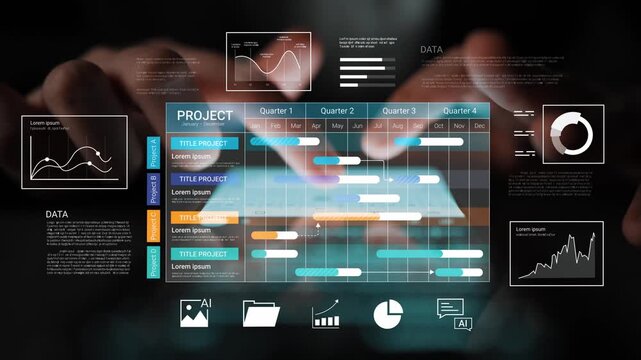
Interactive Data Visualization Dashboard with Project Management Metrics and Analytics for Business Review and Planning in Modern Office Environment Gluon.
00:10
HD
Analytics dashboard interface showing revenue charts user metrics and traffic data visualization
00:10
HD
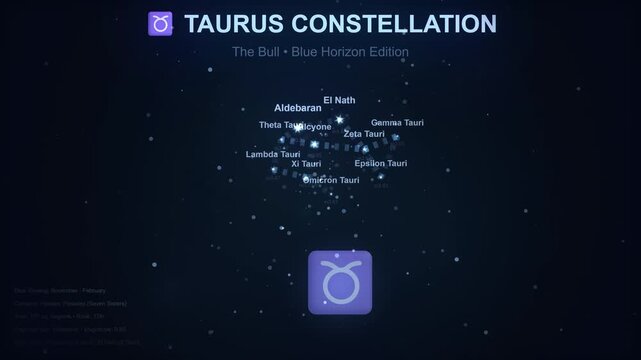
Explore the radiant beauty of the Taurus constellation, a celestial bull formed by brilliant stars, meticulously plotted against the deep, dark expanse of the universe
00:30
HD
Vintage silent movie caption cards. Set of vintage silent movie frame caption cards with old film effects and scratches. 5 sets vintage ornate frame styles. 4k video
00:50
HD
Person using a calculator and laptop, reviewing printed financial charts and reports on a desk, performing budgeting and data analysis in an office setting
00:05
HD
Declining bar chart with downward trend, Blue bar chart with falling line graph decline in business data, finance performance and analytics animation
00:07
HD
Vibrant bright white and soft grey abstract gradient loop. Clean light moving fluid background for elegant minimalist branding, corporate presentation templates, and video title sequences
00:12
HD
Minimalist Financial Growth Curve Chart on Black Background
00:10
HD
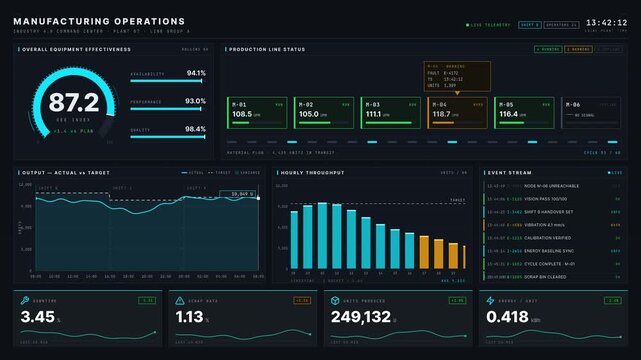
A detailed overview of a dark-mode Industry 4.0 command center dashboard featuring real-time OEE metrics, production line status, and KPI cards in a corporate environment.
00:15
HD
A researcher in a white lab coat and blue gloves types on a keyboard at a laboratory workstation, surrounded by scientific charts and equipment. The image captures innovation and technology in science
00:10
HD
Asian manager talking phone reviewing charts office. Colleague passing document.
00:24
HD
ECG monitor beating heart with a neon electrocardiogram overlay, featuring dynamic HUD elements.Abstract neon heartbeat signal icon animation on black background.
00:10
HD
Project Manager Plans Team Schedule
00:15
HD
Analysts teamwork discuss finance data and dashboard. Colleagues review charts on computer screens and printouts, aligning analytics with metrics. Concept image of collaborative office analysis.
00:11
HD
Dynamic stock market chart with candlestick patterns and real-time financial data on a digital screen ideal for illustrating investment trading and economic analysis
00:08
HD
Neon Business chart icon isolated . business chart growth concept black background right arrow icon.
00:10
HD
Data Analyst analyze Data Financial Dashboard and Touch screen Monitor.
00:13
HD
Side Profile Portrait of Stockbroker at Desk Looking at Computer Screens Showing Stock Exchange Data, Equity Charts, Investment Analytics, Asset Management, Financial Graphs to Track Market Trends
00:16
HD
Businessman analyzing financial charts, counting coins, and using a calculator to evaluate asset sales and profits.
00:23
HD
Solar Energy Investment Growth: A panoramic view of a vast solar farm under a clear sky, overlaid with dynamic charts and graphs. Depicting the rising potential of renewable energy investment.
00:10
HD
A professional analyzing business data through an interactive digital interface, showcasing various graphs and metrics in a modern workspace setting. Cipher
00:13
HD
Business overview dashboard with revenue profit sales charts and KPI metrics on dark screen
00:15
HD
ゴールドのパーティクルを使ったタイトル用アテンション キラキラ テロップ効果 背景透過
00:30
HD
A professional businesswoman working in a modern office, interacting with a holographic interface displaying financial charts, stock growth graphs, and digital market research data, floating dashboard
00:05
HD
Dramatic low key composition of a vivid glowing digital investment growth chart on a dark screen a bright target arrow milestone marker glowing at the highest data point
00:10
HD