Посилання, за допомогою якого можна встановити пароль, надіслано на цю адресу: Щоб отримати доступ до своїх покупок у майбутньому, вам буде потрібен пароль.
Отримайте 10 готових зображень у безкоштовній пробній версії
Додано нові фільтри
Сортувати за

1 476 334 результати за запитом line graph у категорії усі

55 815 результатів у категорії «Відео»
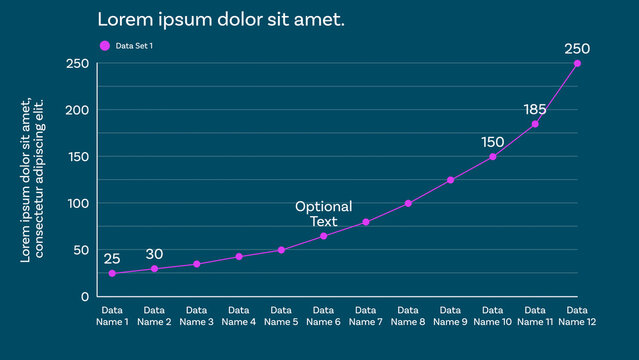
aet Line Chart Infographic Video Template
mogrt Responsive Line Graph for Clean and Modern Data Visualizations Design and Slide Presentations with up to 12 Animated Data Points and Optional Labels to show Percentages, Whole Values, and Custom Texts
Declining bar chart with downward trend, Blue bar chart with falling line graph decline in business data, finance performance and analytics animation
00:07
HD
ait Business Process Teamwork Infographic Template with Staircase Minimal Illustration
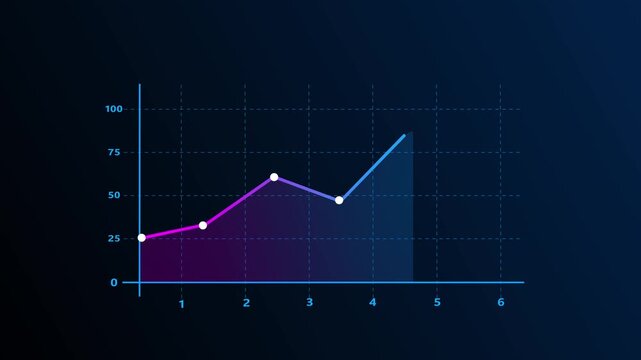
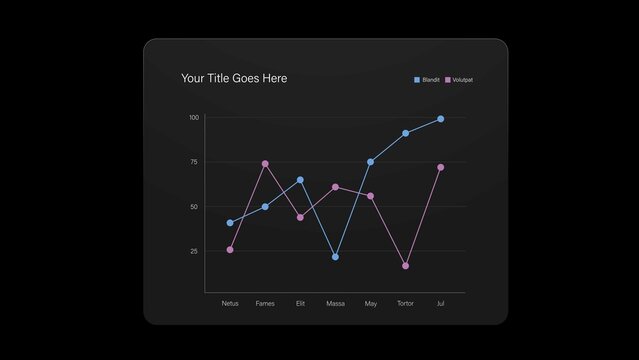
ait Line Graph Chart Infographic for Time Series in Business Presentation Layouts

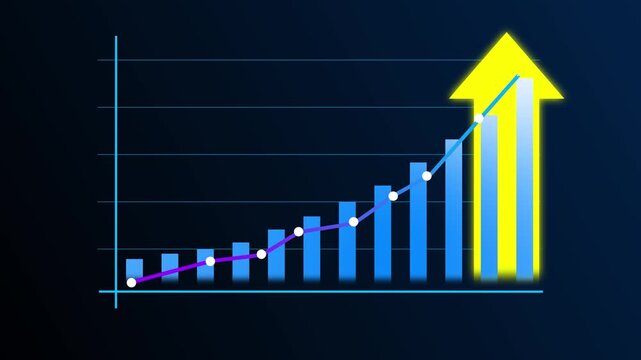
Finance growth chart graph stock market upward data analysis business abstract background with rising green line over bar graph showing market trend investment statistic concept digital chart
00:10
HD
dynamic graph chart line rising on green screen
00:29
HD
Glowing neon line market Recovery Concept. Successful growth trend red line graph going Up. Abstract neon line arrow business graph on dark background.
00:10
HD
Digital line graph tracks upward moving corporate revenue. Interactive line graph demonstrates successful financial forecasting. Economic growth concept with corporate line graph.
00:10
HD
Growing line graph animation in neon red and green against dark background concept for financial growth and progress
00:10
HD
Glowing red neon downward graph with arrow indicating decline, loss, and negative trends on a dark, abstract background, perfect for conveying risk, crisis animation.Right-directional arrow loop.4k
00:10
HD
Glowing neon line market Recovery Concept. Successful growth trend red line graph going Up. Abstract neon line arrow. animation
00:10
HD
Digital line graph tracks upward moving corporate revenue. Interactive line graph demonstrates successful financial forecasting. Economic growth concept with corporate line graph.
00:08
HD