Посилання, за допомогою якого можна встановити пароль, надіслано на цю адресу: Щоб отримати доступ до своїх покупок у майбутньому, вам буде потрібен пароль.
Отримайте 3 відео або 25 зображень у безкоштовній пробній версії
Додано нові фільтри
Сортувати за

19 770 результатів за запитом increase and decrease у категорії відео
Sweden Oil Price Falling with Oil Barrels Downward Green Arrow and 3D Financial Data Visualization Graphs for Economy and Business Concept
00:11
HD
Business professionals collaborating on AI optimization strategies to enhance quality and reduce costs with gear graphics in a modern office setting Gluon.
00:15
HD
Hand drawn plus and minus sign sketch animation loop.
00:10
HD
Down business arrow decline investment and trading loss economic recession video.
00:07
HD
Japan economic bar chart graph showing decreasing downturn with national Flag 3D animation on black background.
00:16
HD
Green energy and carbon neutral concept, plant growing with eco icons and CO2 text, environmental sustainability concept
00:10
HD
Carbon Footprint Reduction and Tree Growth Cycle Motion Graphics
00:13
HD
Success trend animation with green arrow moving upward step by step, with video animation.
00:10
HD
White dollar sign graph showing a downward trend. money financial loss and economic downturn shown.
00:10
HD
Operational expense chart visualizing financial analysis, budgeting, and cost management with rising expenses, risks, and careful monitoring for business strategy and success
00:17
HD
Temperature level indicator scale. Low Normal High meter infographic animation on black background. Animation showing high temperature level color gauge indicator for weather and climate monitoring.
00:10
HD
threat index level indicator scale.Low normal high meter infographic animation on black background. Showing high pressure level color gauge indicator for health monitoring and safety analysis.4k
00:10
HD
Bad Economy Recession Graph Chart Animation 2d Animation with Alpha Matte
00:16
HD
Neon purple and white jagged line graph with arrow pointing up on black background Keywords.A arrow pointing downwards with a white visual impact effect on a black background.
00:12
HD
Luminous blue neon bar chart with clear downward trend line indicating financial decline
00:10
HD
Interactive plus minus counter button ui for web and mobile app animation 4k interface
00:10
HD
Animated Glowing Green Arrows Appearing and Growing Upwards, Followed By Glowing Red Arrows Appearing and Growing Downwards On a Black Background, Suitable for Stock Market, Business, Finance
00:07
HD
A glowing blue neon graphic featuring a percentage sign (%). It is flanked by a upward-pointing arrow on the left and a downward-pointing arrow on the right against a dark background.
00:10
HD
POV of a user reviewing their 30 day meditation streak on a mobile app. The interface displays 1,260 minutes meditated and a perfect consistency score. Ideal for illustrating personal growth
00:12
HD
Business growth concept in graph chart showing marketing sales profit increasing to future target . growing business concept animation on black background. 4k video
00:10
HD
Tunisia Oil Price Falling with Oil Barrels Downward Green Arrow and 3D Financial Data Visualization Graphs for Economy and Business Concept
00:11
HD
A dynamic representation of hands working together with gears, symbolizing collaboration towards achieving net zero CO2 emissions and promoting sustainable practices in various sectors. Raster
00:15
HD
Glowing neon line graph downwards against black background animation. Stock market losses and descending trading graph and downward arrows recession
00:10
HD
Glowing neon green animated line graph illustrating a downward market trend on black background. 4K Video motion graphic animation
00:10
HD
Norepinephrine Level Gauge Increasing and Decreasing, Alertness and Stress Response 2D Motion Graphic
00:19
HD
Animated gauge meter with changing numbers on green screen
00:05
HD
Price drop animation from 1299 to 849 with 35 percent sale discount
00:10
HD
Calculator App Icon with Changing Numbers on Green Screen
00:07
HD
3D blue descending bar chart visualizing financial decline data metrics and economic market trends for professional business analysis presentation
00:10
HD
Product pricing operations reflecting competitive price strategy, discount calculations, sale promotion, and online e commerce management on a white background
00:17
HD
White fluffy mycelium threads fill a mold around a small object, creating soft packaging that later breaks down into dark soil
00:15
HD
market sentiment level indicator scale. Low normal high meter infographic animation on black background. Showing high pressure level color gauge indicator.4k animation video
00:10
HD
Digital stock market trading data grid animation with moving financial numbers and price charts for business presentation and background loop
00:20
HD
Red arrows falling downward motion graphics for economic loss and financial failure concept loop.
00:17
HD
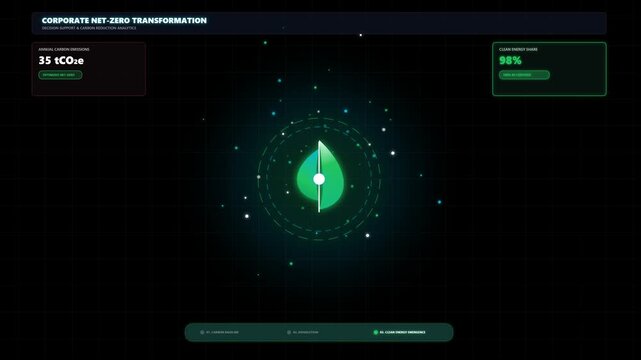
Corporate Net Zero Transformation: Footprint Reduction Animation, CO2 Emission Data Visualization
00:06
HD
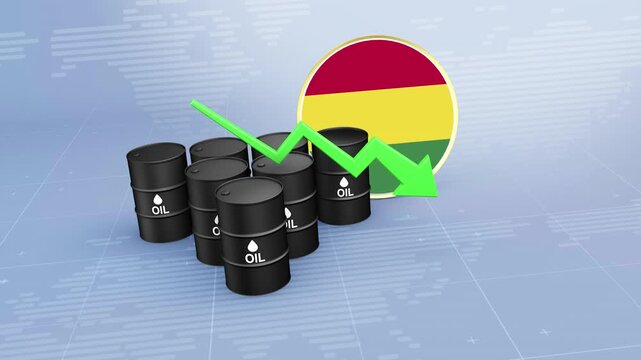
Bolivia Crude Oil Price Decline with Oil Barrels and Downward Green Arrow
00:11
HD
Bar chart animation displays declining columns with a downward arrow on dark. Financial market loss reflects on this bar chart. Negative economic data marks chart.
00:07
HD
Panoramic wide graphic animation of red arrows pointing down on black background screen with letterbox borders showing failure and loss.
00:10
HD
Futuristic Headphone Audio Volume Control Slider HUD Animation
00:10
HD
Yellow chrysanthemums cluster on the right against a softly blurred autumn garden background as the focal length decreases.
00:15
HD
Animated Medical Infographic Daily Cholesterol Management Data
00:05
HD
Net zero goals and CO2 reduction strategy driving sustainability, green energy integration, net zero emissions policies, and climate-friendly sustainability solutions for business and society. Muxer
00:18
HD
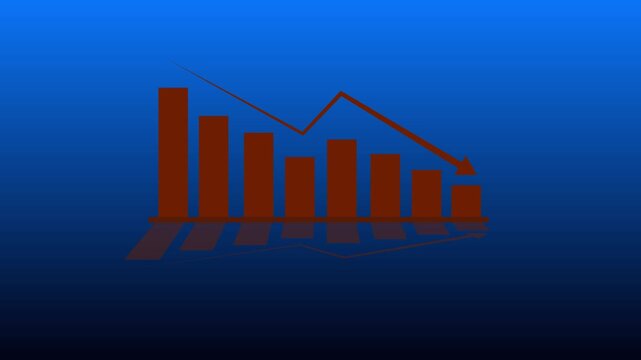
Business decline bar chart animation with falling line graph and shadow effects on transparent background. Indicate revenue decline, financial loss, negative growth
00:06
HD
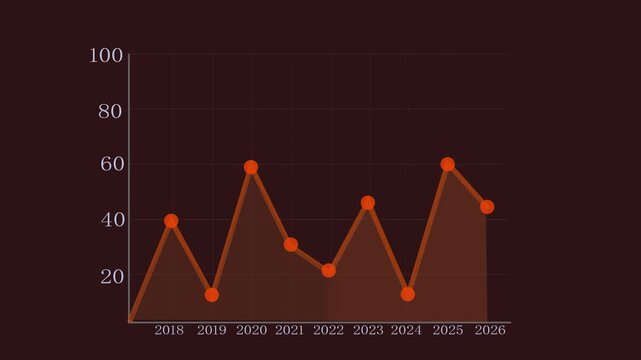
Line graph models track chronological statistics updates across the year 2026. Financial market analytics software modules look crisp across this grid. Timeliness grow.
00:05
HD
Animated business bar chart showing a positive upward trend before a sudden economic crisis causes the market to crash, representing financial recession, bankruptcy, and investment failure
00:10
HD
Zoom in and out animation the power button symbol. Large black symbol in the center and four small symbols around. Seamless looped 4k animation on white background
00:12
HD
Animated down graph icon designed in flat icon style, business or finance concept icon graph against a black background
00:10
HD
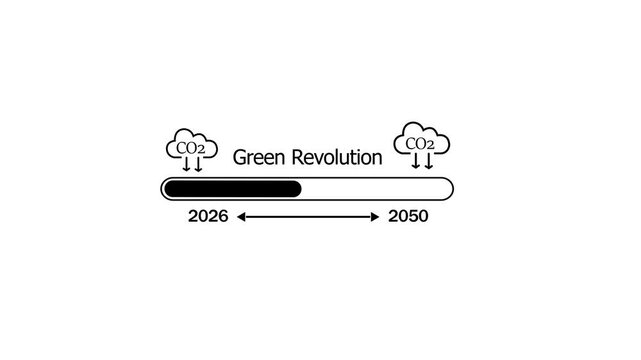
Animated green revolution progress bar illustrating carbon dioxide co2 emission reduction targets and climate change mitigation goals from the year 2026 to the future milestone of 2050 sustainability
00:10
HD
Blue down and pink up neon arrows glowing on a black background
00:08
HD
Business analytics visualizes financial accounting, profit and revenue analysis, cost reduction strategies, and budget planning for economic management
00:17
HD
Cryptocurrency trading. Bitcoin stock graphic. Bitcoin mining and Finance banking management concept, oil and Money trading, Digital trade platform. Profit and loss graph. Online trading
00:16
HD
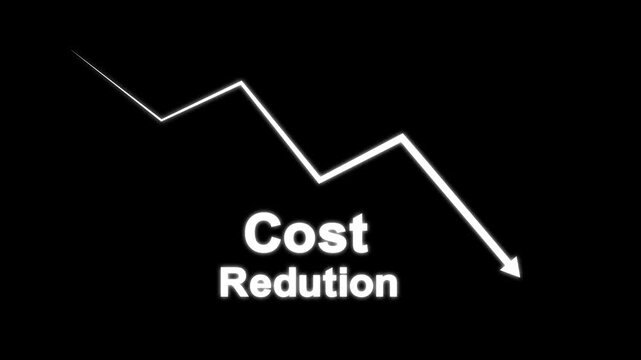
Neon Cost Reduction Dollar Icon Animation, Falling Stock Market Graph and Financial Crisis Concept, 4K
00:10
HD
Glowing quality and cost control concept on transparent background. Successful organization strategy and management quality control. Percentage icon of quality with up arrow and cost with down arrow
00:10
HD
Currency fluctuation icon featuring money with upward and downward arrows. Visual representation of exchange rate movement and financial market changes.
00:10
HD
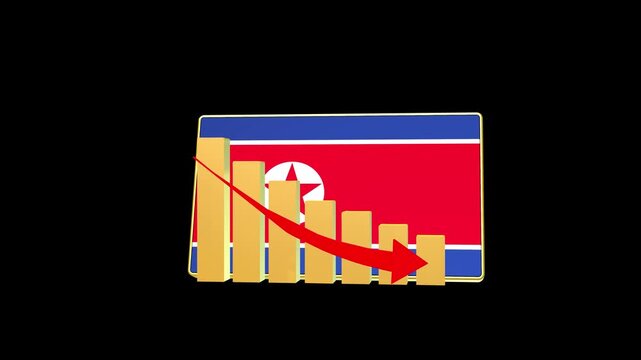
North Korea economic bar chart graph showing decreasing downturn with national Flag 3D animation on black background.
00:16
HD
Bangladesh Oil Prices Decline with Oil Barrels, Gold Coins and Downward Green Arrow, 3D Economic and Financial Market Concept
00:11
HD
Down curve arrow animation, Falling prices concept arrow animation.
00:15
HD
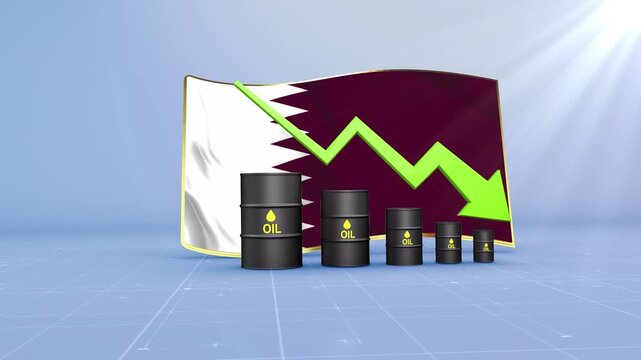
Qatar Oil Price Falling with Oil Barrels Downward Green Arrow and 3D Financial Data Visualization Graphs for Economy and Business Concept
00:11
HD
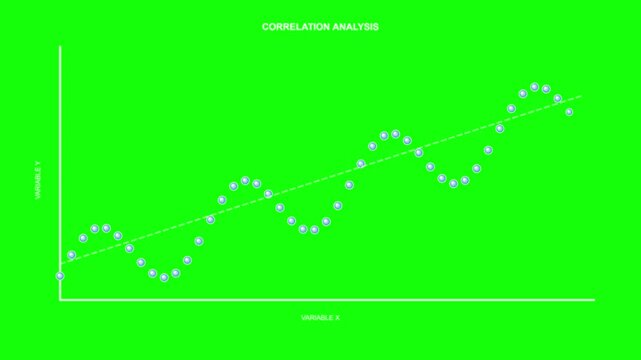
Animated Line Graph Data Visualization on Green Screen for Business and Technology Concepts.
00:08
HD
Simple Line Graph Showing Decline.
00:07
HD
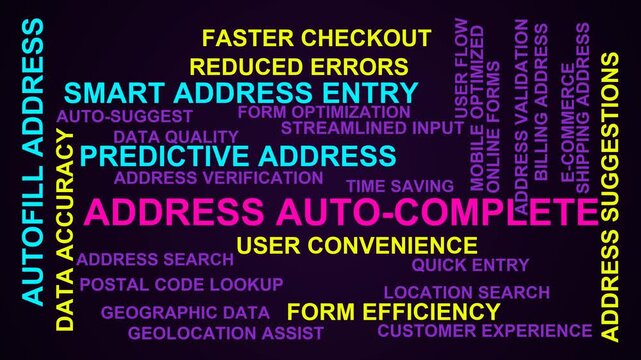
Address Auto-Complete Word Cloud
00:11
HD
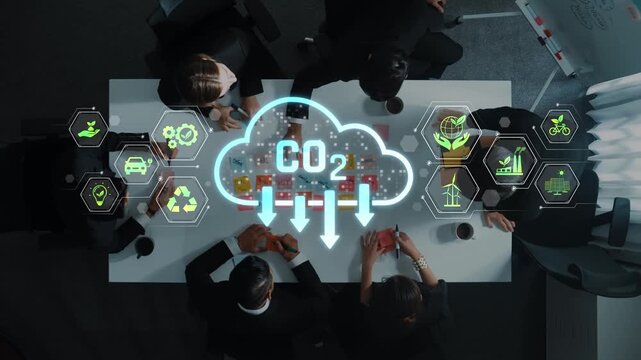
A top view of a business meeting displaying professionals engaged in discussions on sustainability, accompanied by digital infographic elements on carbon emissions. Raster
00:20
HD
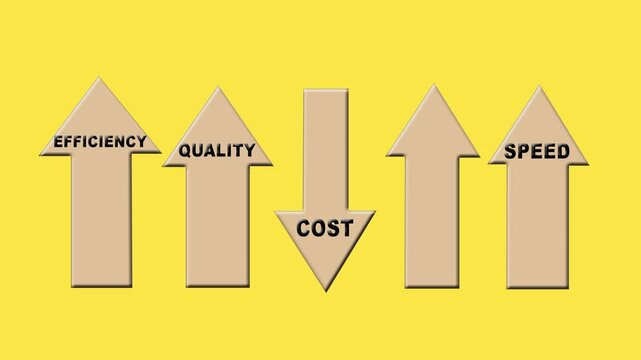
Business optimization concept. increasing efficiency, and speed while reducing costs
00:08
HD
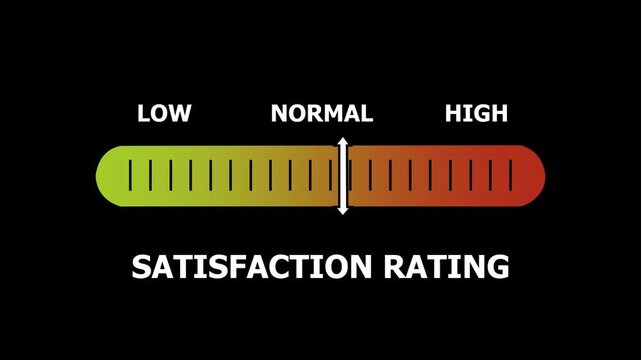
satisfaction rating level indicator scale. Low normal & high meter infographic animation. Showing high satisfaction rating level color gauge indicator. on a black background 4k animation video
00:10
HD
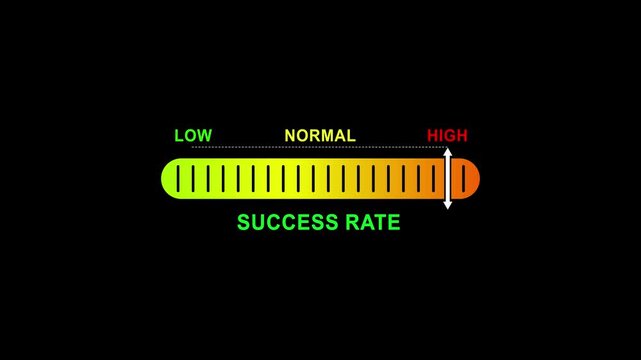
success rate level indicator scale. Low normal high meter infographic animation on black background. Showing high pressure level color gauge indicator.4k quality animation video
00:10
HD
Zoom in and out animation the folder symbol. Large black symbol in the center and four small symbols around. Seamless looped 4k animation on white background
00:12
HD
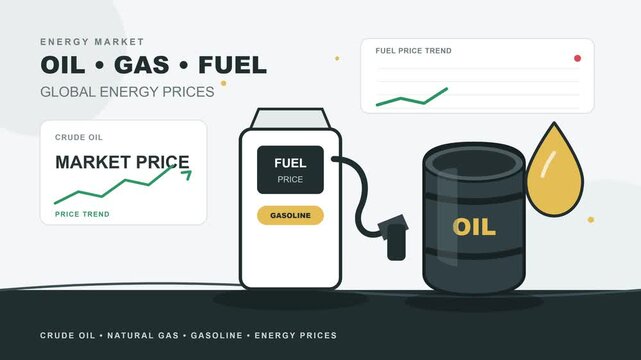
Global energy market price analysis with fuel station pump animation showing fluctuating oil cost chart data
00:09
HD
Red, arrow, pointing, down, with, black, outline, motion, graphic, on, Alpha channel, isolated, directional, indicator, downward, trend, decrease, negative, growth, download, icon.
00:07
HD
Weight level indicator scale. Low normal & high meter infographic animation on black background. Showing high weight level color gauge indicator for body weight and health monitoring.
00:10
HD
Vector depicting the concept of effective financial management and optimizing costs by actively monitoring diverse subscription services and reducing unnecessary monthly payments
00:17
HD
Bar graph rises and falls illustrating market fluctuations on a white background
00:10
HD
Animated Speedometer Sign Low to High Risk level Indicator icon, Cartoon animation on alpha channel black  background
00:10
HD
Small red percent symbol button centered on warm gradient
00:05
HD
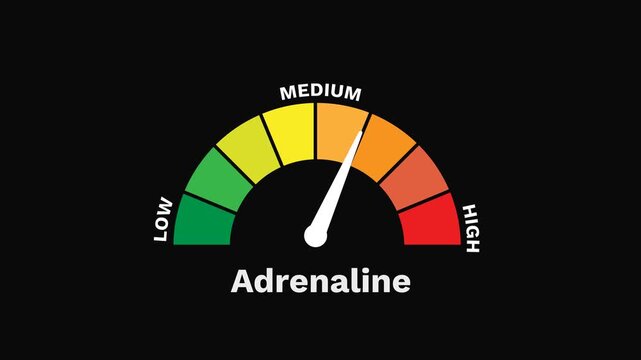
Adrenaline Level Gauge Increasing and Decreasing Indicating Excitement, Tension, Anxiety, and Emotional Response 2D Motion Graphic
00:19
HD
Minimalist downward trend arrow line motion abstract visual stock symbol financial decline data analytics
00:10
HD
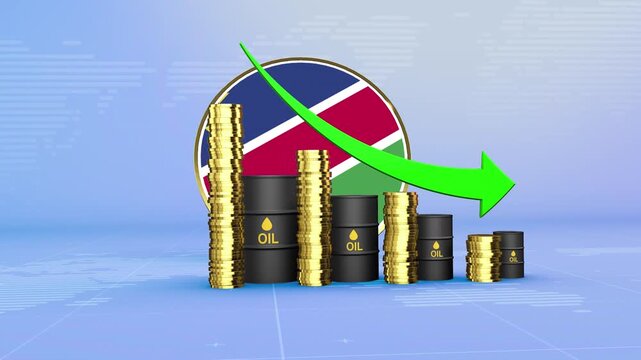
Namibia Oil Prices Decline with Oil Barrels, Gold Coins and Downward Green Arrow, 3D Economic and Financial Market Concept
00:11
HD
Money increases icon, dollar rate increase stretching arrow up icon .Glowing up arrow with dollar sign. Glowing neon line of dollar sign icon and up arrow isolated on transparent.Business growth
00:10
HD
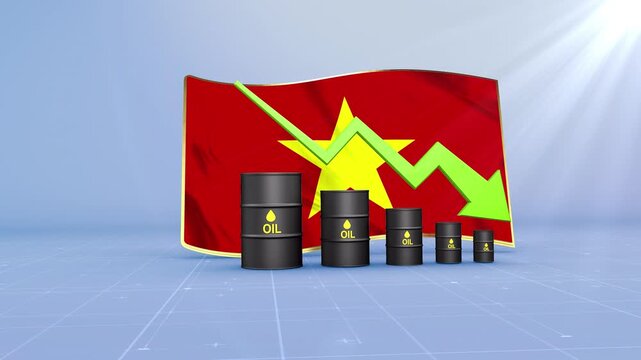
Vietnam Oil Price Falling with Oil Barrels Downward Green Arrow and 3D Financial Data Visualization Graphs for Economy and Business Concept
00:11
HD
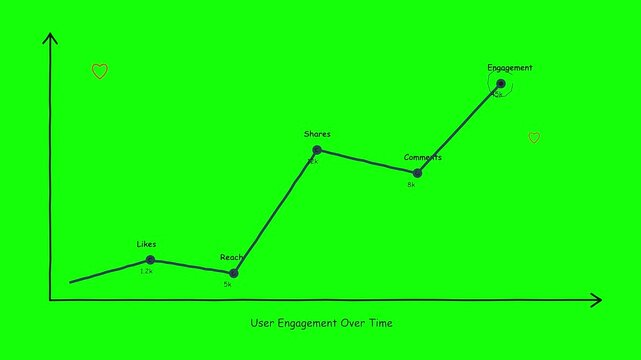
Visualizing User Engagement Progression Over Time on a Dynamic Line Graph.
00:08
HD
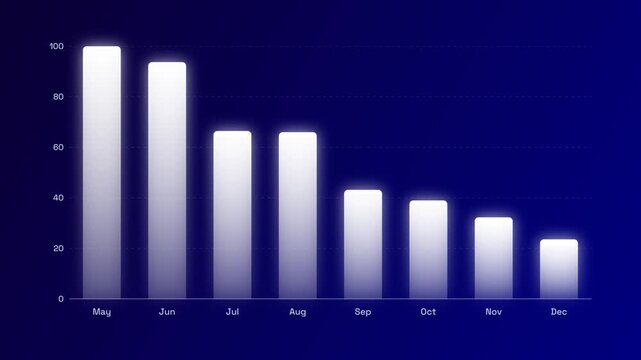
Glowing white data bar chart showing declining monthly performance metrics
00:07
HD
Business executives collaborating on environmental sustainability strategy utilizing renewable energy solutions to achieve net zero targets in corporate meeting.
00:12
HD
AI supports net zero goals via virtual assistant insights, AI-based green strategies, and artificial intelligence for climate-aware business planning. Kernel
00:14
HD
Concept of decreasing cost, stacks of coins gradually getting smaller, wooden blocks spelling COST arranged next to them, clean minimal studio background, soft even lighting, subtle shadows
00:08
HD
business graph chat icon animation video. Business growth concept in graph chart showing marketing sales profit increasing to future target.
00:09
HD
Heart rate Meter Animation.Measuring Heart rate from Low to High Levels.Increasing and Decreasing Gauge from low to high Levels, Comparison Indicator for Data Visualization, perfomance, and Motion
00:10
HD
15% Pie Chart Modern Animation
00:16
HD
Dynamic 3d Minimalist Volume Slider User Interface Animation
00:10
HD
Zoom in and out animation the frog symbol. Large black symbol in the center and four small symbols around. Seamless looped 4k animation on white background
00:12
HD
Green Document Icon with Downward Arrow Growing in Size with Smooth Cinematic Motion Isolated on white background
00:05
HD
Person experiencing minimal affect and digital detox, with less screen time leading to increased well being and a peaceful state of mind, emphasizing the concept of less is more
00:17
HD
40 Percent Decline Animation. Animated video 4K
00:06
HD
A glowing red graph line plummets downwards, symbolizing financial crisis, economic recession, or a sharp decline in market value. ..Created with Generative AI, not depicting real subjects.
00:10
HD
Neon green color GDP Growth Animation with Rising Arrow Graph 4k video
00:10
HD
Libido Level Gauge Increasing and Decreasing Indicating Desire and Hormonal Response Animation
00:19
HD
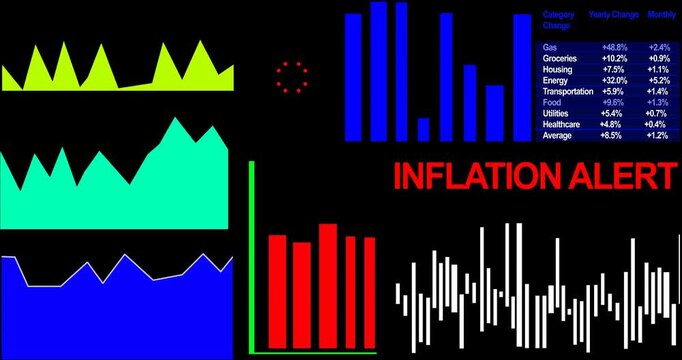
Animated financial dashboard showing rising inflation rates and CPI data with alert indicators. The video presents increasing cost of living metrics, including categories such as energy, food, and hou
00:09
HD
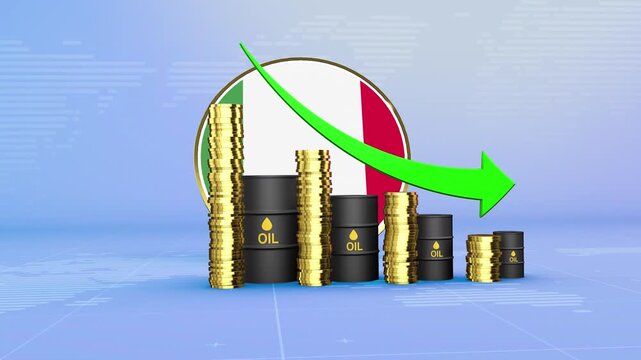
Italy Oil Prices Decline with Oil Barrels, Gold Coins and Downward Green Arrow, 3D Economic and Financial Market Concept
00:11
HD
Animation of speaker volume with alpha channel, Speaker volume animation with transparent background
00:08
HD
Monaco Oil Price Falling with Oil Barrels Downward Green Arrow and 3D Financial Data Visualization Graphs for Economy and Business Concept
00:11
HD
Animated Percentage Growth Chart, Percent Symbol Motion Graphics, Business Data Infographic Animation 4K
00:05
HD
pressure level indicator scale. Low normal & high meter infographic animation. Showing high pressure level color gauge indicator. on a black background 4k animation video
00:10
HD