Посилання, за допомогою якого можна встановити пароль, надіслано на цю адресу: Щоб отримати доступ до своїх покупок у майбутньому, вам буде потрібен пароль.
Отримайте 3 відео або 25 зображень у безкоштовній пробній версії

Додано нові фільтри
Сортувати за

19 768 результатів за запитом increase and decrease у категорії відео
Historical cost Animation
00:06
HD
Green rising zigzag arrow on black background showing stock market recovery, with video animation.
00:10
HD
Kuwait Oil Prices Decline with Oil Barrels, Gold Coins and Downward Green Arrow, 3D Economic and Financial Market Concept
00:11
HD
Businessman Holding House Icon with Percentage Sign Indicating Decrease in Values, Financial Growth and Real Estate Decline Concept Sigmoid
00:10
HD
Cyan bar chart with downward trend line graph. Cyan bar chart for business loss or warning. Digital cyan bar chart animation for economic report.
00:12
HD
Glowing Neon Percentage Growth and Decline Icon Animation with Up and Down Arrows on Black Background, Financial Business Statistics, 4K Motion Graphics Loop..
00:10
HD
Currency fluctuation icon featuring money with upward and downward arrows. Visual representation of exchange rate movement and financial market changes.
00:10
HD
Bright white 3D number 2017 text animation floating against a deep black void offering a vibrant and modern visual for the year with a sense of digital energy.
00:10
HD
3D flat motion graphic animation of a colourful speedometer performance gauge meter increasing and decreasing percentage value isolated on green screen chroma key background for measurement technology
00:08
HD
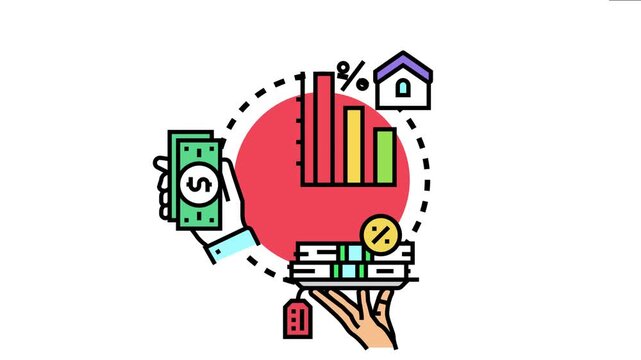
Hand holding money and another hand presenting financial services with a low interest tag. Connecting to a house icon and a rising bar chart. Symbolizing reduced loan expenses and better credit terms
00:17
HD
Liechtenstein Oil Price Falling with Oil Barrels Downward Green Arrow and 3D Financial Data Visualization Graphs for Economy and Business Concept
00:11
HD
Zoom in and out animation the clipboard symbol. Large black symbol in the center and four small symbols around. Seamless looped 4k animation on white background
00:12
HD
Orange sticker with black outline displaying 10 percent text
00:08
HD
Minimalist bar chart animation showing declining business trends
00:10
HD
Cryptocurrency trading. Bitcoin stock graphic. Bitcoin mining and Finance banking management concept, oil and Money trading, Digital trade platform. Profit and loss graph. Online trading
00:12
HD
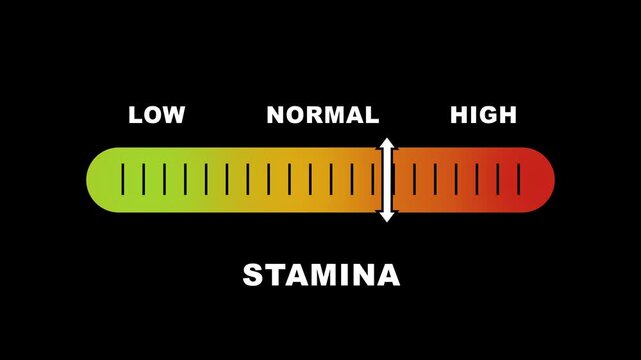
Stamina level indicator scale. Low Normal High meter infographic animation on black background. Animation showing high stamina level color gauge indicator for fitness and endurance monitoring.
00:10
HD
Glowing neon line graph downwards against black background animation. Stock market losses and descending trading graph and downward arrows recession
00:10
HD
Blue neon Up and down arrow icon representing bidirectional movement, data transfer, upload and download, exchange, navigation, switching, workflow, financial transactions, and directional change.
00:10
HD
Vibrant 3D graphic illustration of '11
00:08
HD
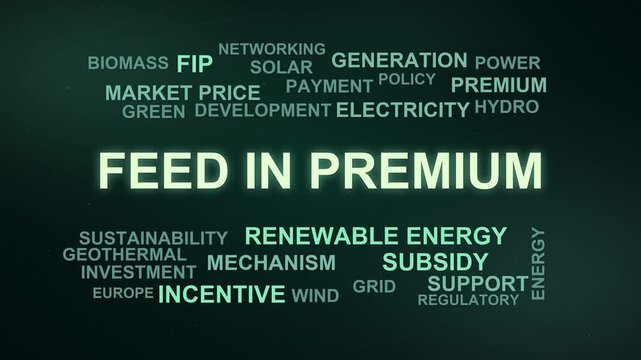
Feed In Premium Word Cloud
00:09
HD
Health Bar
00:06
HD
Modern line graph displays falling investment market trends. Technical line graph monitors negative corporate revenue data. Financial crisis concept with digital line graph.
00:10
HD
Barbados Oil Prices Decline with Oil Barrels, Gold Coins and Downward Green Arrow, 3D Economic and Financial Market Concept
00:11
HD
Business professional analyzing data on smartphone with AI technology interface showcasing quality and cost metrics against a city skyline backdrop Sigmoid
00:10
HD
graph chart up down business statistics
00:07
HD
Zigzag line with a downward arrow falling trend loss decline and negative business direction animation
00:06
HD
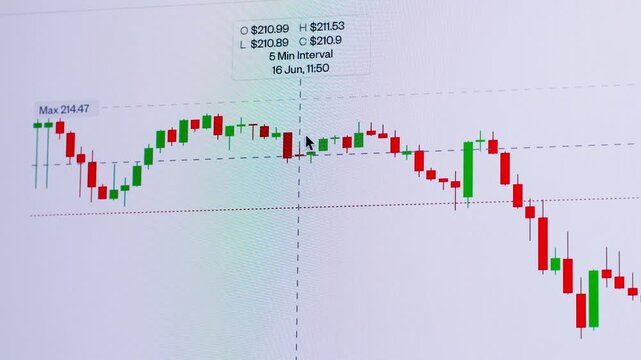
Stock Market Candlestick Chart Animation Showing Bullish Trend Rise Followed by Bearish Trend Fall, Financial Trading, Forex, Crypto Investment Analysis Graph on Dark Grid Background Loop
00:09
HD
Bright white 3D number 2031 text animation floating against a deep black void offering a vibrant and modern visual for the year with a sense of digital energy.
00:10
HD
Young woman do yoga sitting green lawn, man meditating sunset, relaxing outdoors, girl relaxing sunset, yoga meditation, positive mental health, emotional balance practice, introspective quiet moment
00:10
HD
Property condition evaluation involves analyzing building structure. Asset value like a car in a garage with a price tag. And market trends represented by a chart and magnifying glass
00:17
HD
Italy Oil Price Falling with Oil Barrels Downward Green Arrow and 3D Financial Data Visualization Graphs for Economy and Business Concept
00:11
HD
Shopping cart filled with falling percentage symbols, concept for discounts
00:10
HD
Minus and plus buttons press alternately inside a rounded ivory control on a sage background in a seamless eight second loop.
00:08
HD
Seamless loop digital finance counter. Muted red and off-white colors with a forward zoom impact at $0 and $1000. Condensed typography on green screen.
00:12
HD
Graph displays AI traffic data with numbers for visitors and pageviews. The design has a blue background with a simple line showing trends.
00:10
HD
White arrows rise upward, flanked by percentage symbols
00:10
HD
word LOSS dips letter by letter as a red downward graph line draws beneath it and ends in a descending arrow. Useful for financial loss with a transparent alpha channel for compositing
00:08
HD
Neon percentage icon animation with glowing blue up and down arrows for financial market, interest rate and business analytics.
00:10
HD
Global business line animation. Abstract glowing neon line business graph growth arrow to down arrow.  loss, and negative trends on a dark, abstract background
00:10
HD
Personal Expense Word Cloud
00:11
HD
Illicit trade of Opioids tramadol and oxycodone or oxy is significant public health danger. Supplies contaminated with potent synthetic fentanyl. Counterfeit pills increases risk of fatal overdose.
00:20
HD
Red arrow pointing down animation. Continuous Bouncing Motion Graphic for Directions and Download.
00:10
HD
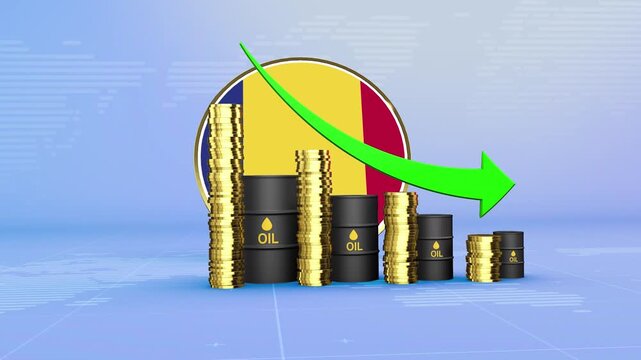
Romania Oil Prices Decline with Oil Barrels, Gold Coins and Downward Green Arrow, 3D Economic and Financial Market Concept
00:11
HD
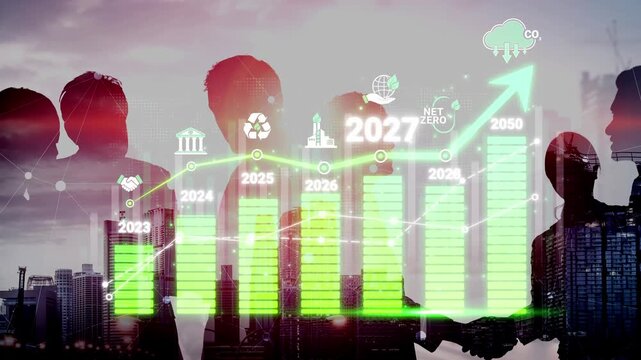
Business Growth and Sustainability Strategy with Graph and People Silhouette Representing Future Goals and Net Zero Commitment in Urban Environment Sigmoid
00:10
HD
neon simple $ icon animation video
00:10
HD
reuse level indicator scale. Low normal & high meter infographic animation. Showing high reuse level color gauge indicator. on a black background 4k animation video
00:10
HD
Dynamic danger gauge meter animation with moving needle indicating increasing risk levels from low to on a black background, for industrial safety, monitoring, risk assessment, and data visualization
00:10
HD
Bright white 3D number 2050 text animation floating against a deep black void offering a vibrant and modern visual for the year with a sense of digital energy.
00:10
HD
Purple bar chart showing downward trend with arrow graph. Financial loss chart for corporate performance failure metrics. Digital bar chart animation for network alert.
00:12
HD
Financial consultant helping clients with personal debt reduction plans. Managing budgets. And calculating interest rates for loan payments and mortgage planning. Depicted as a comprehensive strategy
00:17
HD
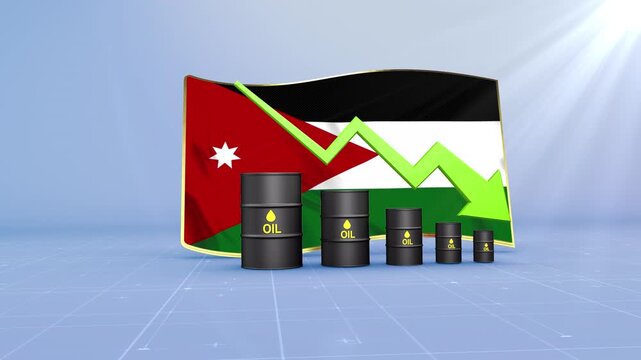
Jordan Oil Price Falling with Oil Barrels Downward Green Arrow and 3D Financial Data Visualization Graphs for Economy and Business Concept
00:11
HD
Vitality level indicator scale. Low normal & high meter infographic animation on black background. Showing high vitality level color gauge indicator for energy, health, and wellness monitoring
00:10
HD
demand level indicator scale. Low normal high meter infographic animation on black background. Showing high pressure level color gauge indicator.4k animation video
00:10
HD
Cost 2026business finance concept. Businessman cost reduction icon with down arrow for budget management and 4k Animation video
00:10
HD
Digital Graph Animation Abstract Motion Data Visualization
00:10
HD
fat level indicator scale. Low normal & high meter infographic animation. Showing high fat level color gauge indicator. on a white background 4k animation video
00:10
HD
Futuristic CO2 Reduction Goal Tracker with Leaf Icon
00:12
HD
Business Loss Shown Through a Red Declining Graph, Highlighting Reduced Revenue, Falling Profitability, Financial Pressure, Market Challenges and Negative Growth
00:10
HD
Brightness slider level control animation isolated on black background, slider level adjust 0 to 100, simple brightness contrast icon animated.
00:06
HD
Red chart background glows with financial data. White and orange candlesticks show market movements. Green and yellow lines track rising and falling trends
00:10
HD
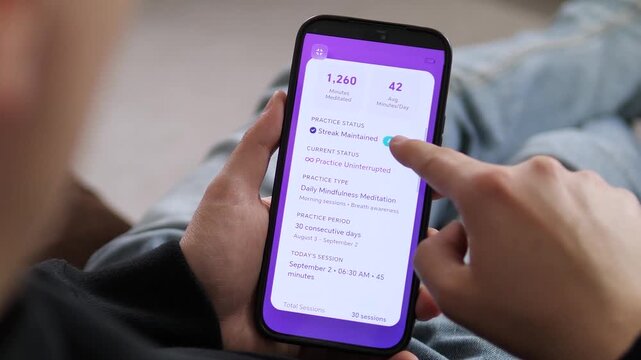
a user reviewing their mindfulness progress on a mobile device. The screen displays a 30 day streak, 1,260 minutes meditated, and a Streak Maintained status. Ideal for illustrating personal growth
00:12
HD
Wellness Word Cloud
00:11
HD
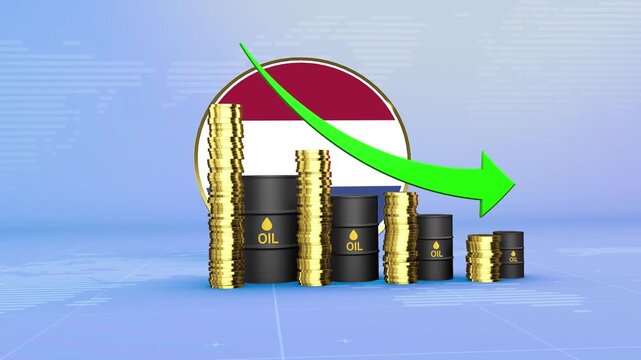
Netherlands Oil Prices Decline with Oil Barrels, Gold Coins and Downward Green Arrow, 3D Economic and Financial Market Concept
00:11
HD
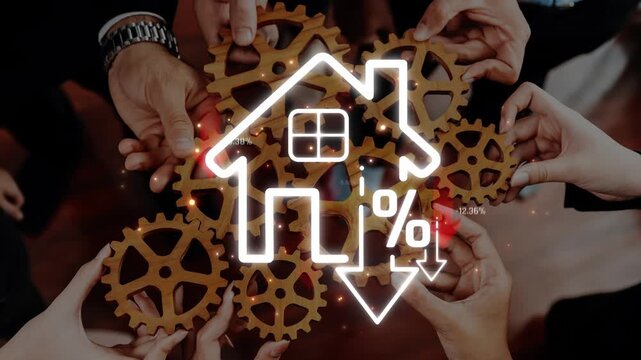
Hands Collaborating with Gears and a House Icon Representing Real Estate Market Dynamics and Economic Trends in Property Valuation and Investment Opportunities Sigmoid
00:15
HD
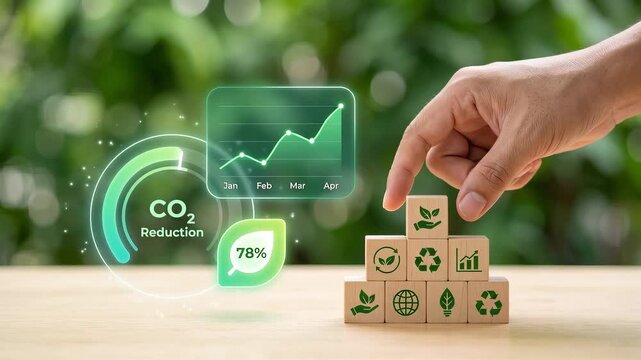
Hand Stacks Wooden Blocks with Green Icons on Desk to Promote Carbon Reduction, Track Environmental Goals, Support Recycling Efforts, Monitor Sustainability, and Protect Nature
00:05
HD
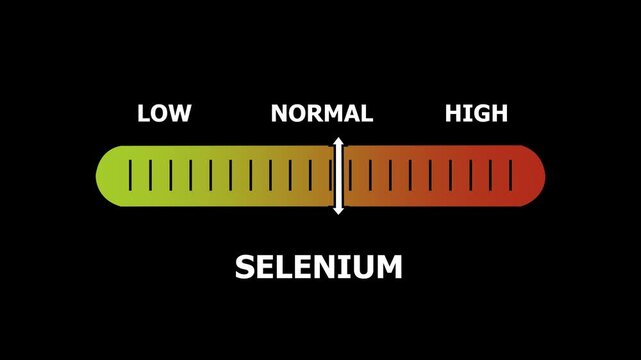
Selenium level indicator scale. Low normal & high meter infographic animation. Showing high selenium level color gauge indicator. on a black background 4k animation video
00:10
HD
Red Downward Arrow Icon Animation with Blue Gradient Background and Subtle Glow
00:05
HD
Bright white 3D number 2040 text animation floating against a deep black void offering a vibrant and modern visual for the year with a sense of digital energy.
00:10
HD
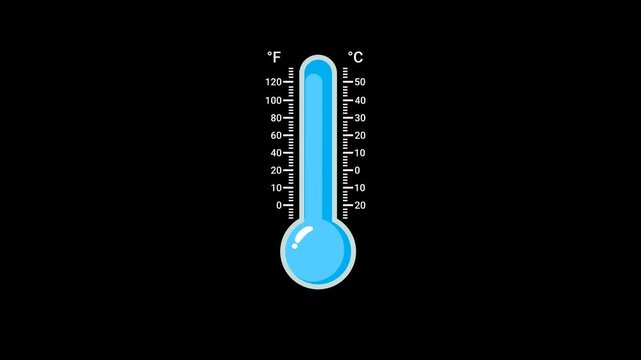
Thermometer Temperature Increase and Decrease Animation Clinic and Weather Alpha Channel 4K Resolution
00:06
HD
System implementing performance calibration adjustment, analyzing feedback, making improvements, and optimizing settings for enhanced efficiency and quality outcomes in various operational contexts
00:17
HD
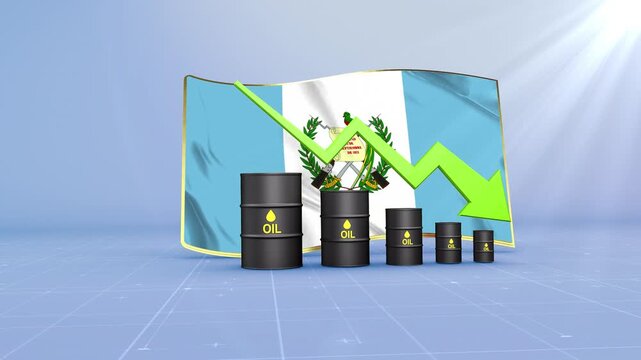
Guatemala Oil Price Falling with Oil Barrels Downward Green Arrow and 3D Financial Data Visualization Graphs for Economy and Business Concept
00:11
HD
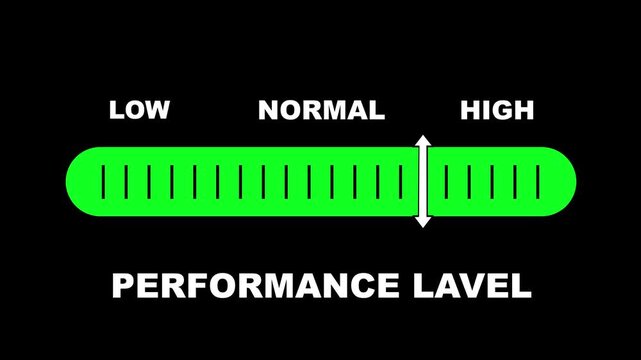
Performance level indicator scale. Low normal & high meter infographic animation on bblackbackground. Showing high performance level color gauge indicator for business productivity efficiency and work
00:10
HD
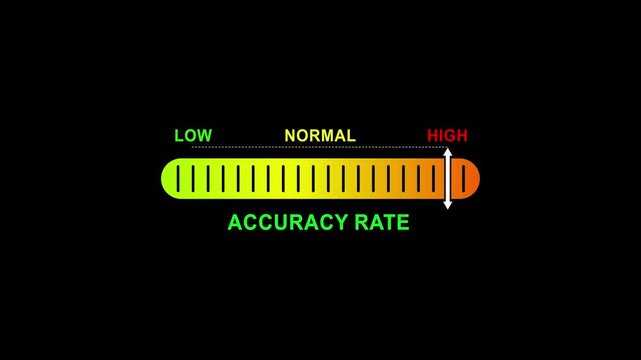
accuracy rate level indicator scale.Low normal high meter infographic animation on black background. Showing high pressure level color gauge indicator for health monitoring and safety analysis.4k
00:10
HD
Inverse relationship chart animation scales on grids. Corporate inverse relationship chart animation tracks inverse links. Modern inverse relationship chart animation details paths.
00:08
HD
Hand made arrows pointing.
00:09
HD
calcium level indicator scale. Low normal & high meter infographic animation. Showing high calcium level color gauge indicator. on a white background 4k animation video
00:10
HD
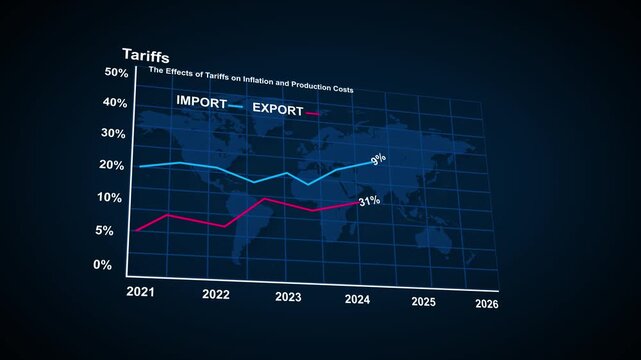
Economic graph showing tariffs impact on import and export costs from 2021 to 2025 with rising and falling trend lines, ideal for finance, trade, and global economy topics. Financial data analysis .
00:10
HD
Financial Market Decline and Economic Downturn Falling Dollar Value, Decreasing Wealth, Shrinking Investment Returns, Lower Asset Prices, and Increasing Financial Risk
00:10
HD
Increasing counting number 0 to 100k for price like views figures or amount concepts .4k motion graphics video animation
00:10
HD
Animated Brightness Slider UI Moving from Low to High
00:09
HD
Animated business infographic chart showing decrease in profits and financial decline. 4k financial diagram with appearing animated descending arrow, bar stats, lines and digital effects. Business
00:05
HD
Blue Glass Percentage Sign on White Background, 3D Render.
00:08
HD
Macedonia Oil Prices Decline with Oil Barrels, Gold Coins and Downward Green Arrow, 3D Economic and Financial Market Concept
00:11
HD
Digital Concept of Real Estate Market with Keyboard and Percentage Sign, Showing Trends in Housing Prices and Economic Data Analysis Sigmoid
00:10
HD
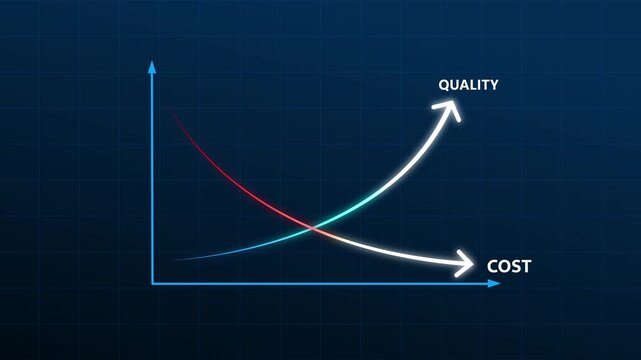
Glowing quality and cost control concept on transparent background. Successful organization strategy and management quality control. Percentage icon of quality with up arrow and cost with down arrow
00:10
HD
Price drop announcement with original and sale price displayed on a modern interface with red background and radial
00:10
HD
Three word kinetic typography sequence displaying Unmissable Event Today with sequential letter spacing reduction and sharp zoom transition
00:12
HD
Bright white 3D number 2030 text animation floating against a deep black void offering a vibrant and modern visual for the year with a sense of digital energy.
00:10
HD
Cyan Bar Graph with Reflection Showing Downward Trend on Black Background chart rising
00:10
HD
Comparing financial profit and cost using graphs, charts, and icons of income, expenditure, analysis, and investment for strategic business planning and budget management
00:17
HD
Kazakhstan Oil Price Falling with Oil Barrels Downward Green Arrow and 3D Financial Data Visualization Graphs for Economy and Business Concept
00:11
HD
Difficulty level indicator scale. Low normal high meter infographic animation on black background. Showing high difficulty level color gauge indicator for skill assessment and performance monitoring.
00:10
HD
cyber threat level indicator scale. Low normal high meter infographic animation on black background. Showing high pressure level color gauge indicator.4k animation video
00:10
HD
Glowing up and down arrows animation displays download metrics. Fast broadband internet speeds track with the up and down arrows. Digital data transfer rates drive these up and down arrows.
00:10
HD
Business planning for speed and productivity concept on the transparent background. Management strategy, focusing on cost control, quality improvement, performance efficiency. 4k video animation.
00:15
HD
sulful dioxide level indicator scale. Low normal & high meter infographic animation. Showing high sulful dioxide level color gauge indicator. on a white background 4k animation video
00:10
HD
Business graph and bar chart, Business Financial Growing Business Income and Earnings. business growth target graph bar animation on a cyan background.
00:08
HD
Business finance bar graph animation decrease trend yellow green colors motion graphics. Minimalist bar graph animation falling data chart abstract finance statistics background.
00:10
HD
Industrial chimney with green foliage emitting smoke, Carbon dioxide. Carbon reduction with bright green plants. Industry and environmental
00:05
HD
A colorful semi-circular gauge a needle pointing towards the MIDIUM" section indicating a moderate level of happiness against a stark.  happy level text or word low and medium to high meter concept.
00:10
HD