Посилання, за допомогою якого можна встановити пароль, надіслано на цю адресу: Щоб отримати доступ до своїх покупок у майбутньому, вам буде потрібен пароль.
Отримайте 3 відео або 25 зображень у безкоштовній пробній версії
Додано нові фільтри
Сортувати за

19 768 результатів за запитом increase and decrease у категорії відео
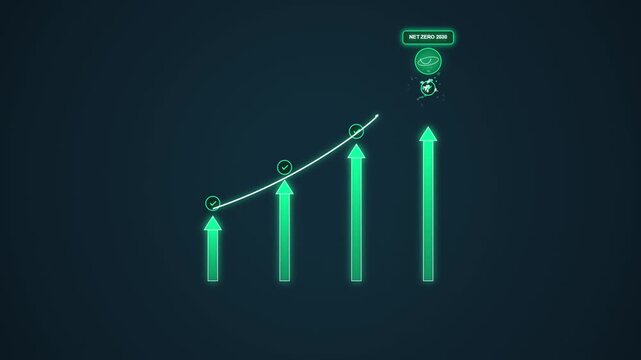
Green business net zero eco growth 3000 carbon footprint reduction animation sustainability
00:10
HD
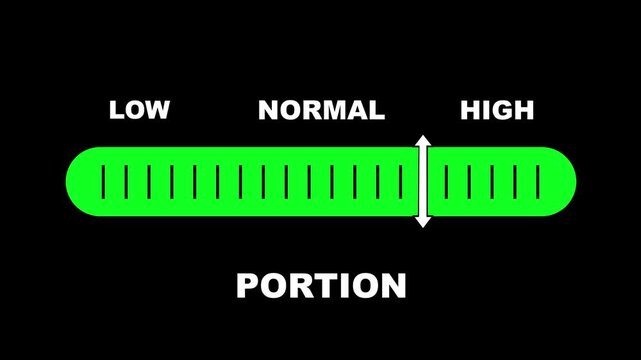
Portion level indicator scale. Low Normal High meter infographic animation on black background. Showing high portion level color gauge indicator for healthy eating and nutrition monitoring
00:10
HD
Financial Growth Trend Animation with Positive Revenue Indicators
00:09
HD
Business Growth Analysis with Graphs and Data Projections for Sustainable Development and Net Zero Progress from 2023 to 2030 Sigmoid
00:10
HD
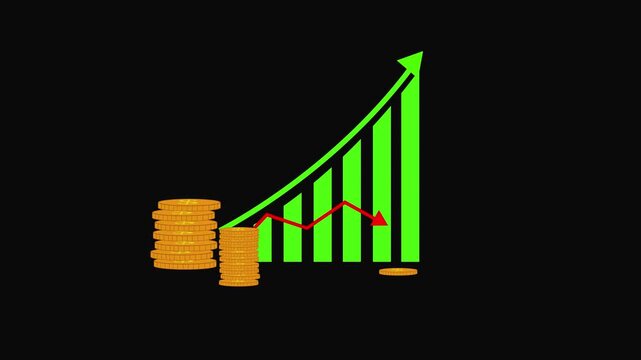
Growing Bar Chart With Stacked Gold Coins And Upward Green Arrow And Downward Red Arrow. Economic visualization showing stacked gold coins, growing bars, and green up/red down arrows for finance.
00:09
HD
Vertical adjustment bar animation with orange and yellow gradient level indicator on transparent background
00:08
HD
Net Zero 2030 Sustainability Infographic Animation with Rising Green Growth Bar Charts and Eco Friendly Progress Concept
00:10
HD
Business graph chart drop circle with down arrow moving animation on white background. Decreasing business graph and down arrow for business loss falling, bad economy recession concepts
00:10
HD
Two facing Semicircle Shapes Film Matte Overlay increasing and decreasing size Animation. Orange Segment elements Film Frame. Geometric design symbol border. 4K Seamless loop.
00:08
HD
Animated minimalist black line cylinder bar chart presenting a downward decreasing trend on a white background. Loopable video for financial loss and market decline metrics.
00:10
HD
business graph chart and success arrow indicating profit profit and loss business plan motion graphics.
00:10
HD
glowing neon Global business analyzing concept with trade. Financial figures and charts showing a downward trend, business crash and economic collapse 4k video animation.
00:10
HD
Animated star of black dots pulsing on white. Minimalist stipple style star expanding and contracting, motion graphics
00:05
HD
Retro 8-Bit Pixel Art Style Audio Volume Level Bar Animation with Speaker Icon on Dark Background
00:10
HD
Satisfaction rating level indicator scale. Low normal & high meter infographic animation on black background. Showing high satisfaction level color gauge indicator for customer feedback and experience
00:10
HD
Bright white 3D number 2034 text animation floating against a deep black void offering a vibrant and modern visual for the year with a sense of digital energy.
00:10
HD
Neon blue financial graph icon with dollar sign and scissors cutting line symbolizing cost
00:08
HD
Abstract Motion Graphics of red glowing bar chart data on a dark brick wall background loop.
00:10
HD
Commerce concept digital marketing strategies for driving sales, showing various methods of offering price reductions and special deals to attract customers online and in retail
00:17
HD
Carbon emissions tracker dashboard for co2 reduction tree planting statistics, for environmental impact analysis, green energy transition, corporate sustainability ecological data progress
00:20
HD
Tanzania Oil Prices Decline with Oil Barrels, Gold Coins and Downward Green Arrow, 3D Economic and Financial Market Concept
00:11
HD
Threat level indicator scale. Low normal & high meter infographic animation on black background. Showing high threat level color gauge indicator for safety and risk monitoring
00:10
HD
Neon glowing percentage discount arrow symbol animation for sales, marketing, and e-commerce promotions
00:10
HD
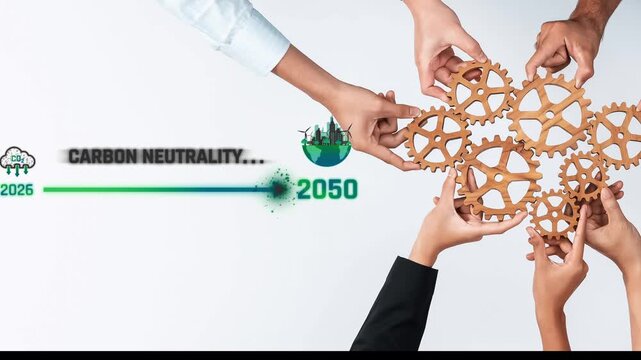
Hands join together with gears symbolizing a united approach toward achieving carbon neutrality from 2026 to 2050, highlighting the urgency for collaboration in sustainability. Raster
00:15
HD
Business graph crash down with red arrow. Motion graphics of down business arrow on a white background  4k video
00:10
HD
Corporate Earnings Growth Graph Animation with Financial Data Visualization
00:09
HD
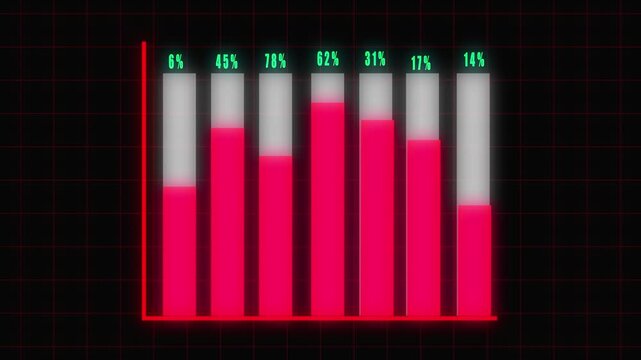
Neon Red and Pink Bar Chart with Percentage Labels on Dark Grid animation Background graph data. Vibrant neon red and pink bar graph animation with percentage indicators on dark grid display.
00:08
HD
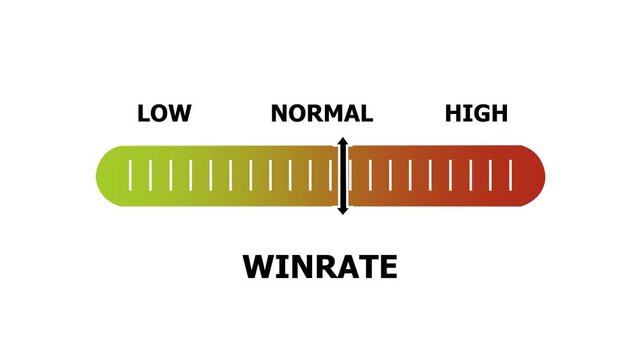
winrate level indicator scale. Low normal & high meter infographic animation. Showing high winrate level color gauge indicator. on a white background 4k animation video
00:10
HD
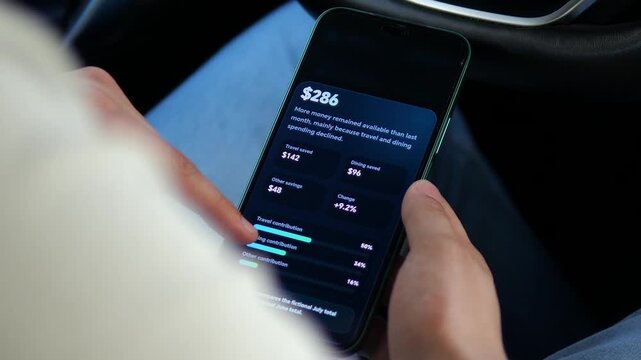
User reviews a mobile savings analysis showing higher month-over-month retention as reduced travel and dining expenses strengthen personal budgeting and financial resilience.
00:07
HD
Trading screen East Europe market index chart up, stock market and currency data. Sector data, business, financial market, prices, trading board, investment strategy, market research.
00:10
HD
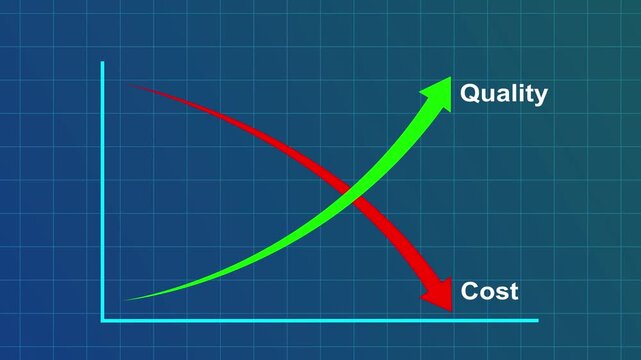
Business chart illustrating improving quality and cost reduction with green upward and red downward arrows.Motion graphics of concept
00:07
HD
Two yellow circle icons showing a smartphone with a minus and a plus sign, ideal for adding or removing devices, apps, users and device management
00:10
HD
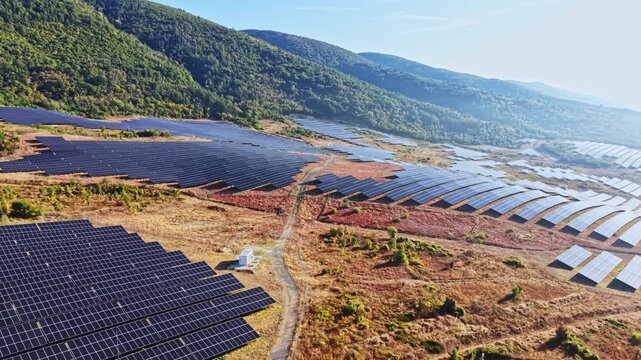
Large fields of solar panels spread across hills under bright daylight. The site is part of a renewable energy project aimed at harnessing solar energy.
00:18
HD
European Union economic bar chart graph showing decreasing downturn with national Flag 3D animation on black background.
00:16
HD
Financial Earnings Decline 125 Percent Graph on Green Screen
00:15
HD
Bright white 3D number 2014 text animation floating against a deep black void offering a vibrant and modern visual for the year with a sense of digital energy.
00:10
HD
Animated fire icon with percentage progress bar on dark background.
00:07
HD
Declining Business Performance and Financial Market Downtrend Illustrated by Falling Red Bar Chart with Downward Arrow and Negative Growth Trend
00:10
HD
Upward arrow direction One line continuous drawing animation. animated hand- drawn banner lineart illustration design. isolated sign symbol monoline video green screen background stock market business
00:10
HD
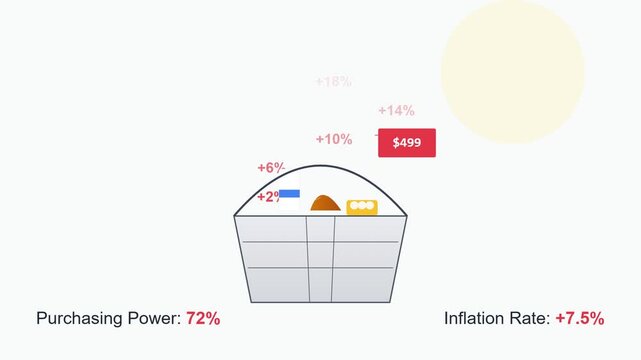
Inflation and Purchasing Power Concept Illustration with Grocery Basket
00:10
HD
Switzerland Oil Prices Decline with Oil Barrels, Gold Coins and Downward Green Arrow, 3D Economic and Financial Market Concept
00:11
HD
Energy level indicator scale. Low Normal High meter infographic animation on black background. Animation showing high energy level color gauge indicator for power and performance monitoring.
00:10
HD
Salt Spray Word Cloud
00:09
HD
Digital Illustration of Real Estate Market Decline with House Icon and Percentage Symbol Overlaid on Keyboard Imagery Sigmoid
00:10
HD
Focal length decreases as autumn leaves fill the right side against soft green bokeh.
00:15
HD
Two curved arrows pointing in opposite directions minimal animation
00:06
HD
Vibrant neon glowing arrow animation transition effect dynamic digital motion futuristic u i symbol
00:10
HD
Glowing Downward Arrows Stock Market Crash and Loss Concept Motion Graphic video...
00:10
HD
Dynamic Vertical Bar Chart Animation with Up and Down Arrows for Market Analysis on Green Screen
00:10
HD
Pituitary gland problems affecting hormone regulation, causing symptoms and indicating a need for endocrine system healthcare and treatment
00:17
HD
Hand Drawn Animated Up and Down Arrow Graph Green Screen Chroma Key
00:10
HD
Down curve arrow animation, Falling prices concept arrow animation.
00:15
HD
Solar panels are arranged in neat rows on open land next to green hills and trees. The clear sky shows signs of early morning or late afternoon light.
00:15
HD
Bangladesh economic bar chart graph showing decreasing downturn with national Flag 3D animation on black background.
00:16
HD
changes level indicator scale. Low normal & high meter infographic animation. Showing high changes level color gauge indicator. on a white background 4k animation video
00:10
HD
Bright white 3D number 2048  text animation floating against a deep black void offering a vibrant and modern visual for the year with a sense of digital energy.
00:10
HD
graph chart up down business statistics
00:10
HD
Sustainable Energy Infinite Recycling Loop Animation
00:15
HD
Minimalist animated line chart with a smooth up and down movement
00:06
HD
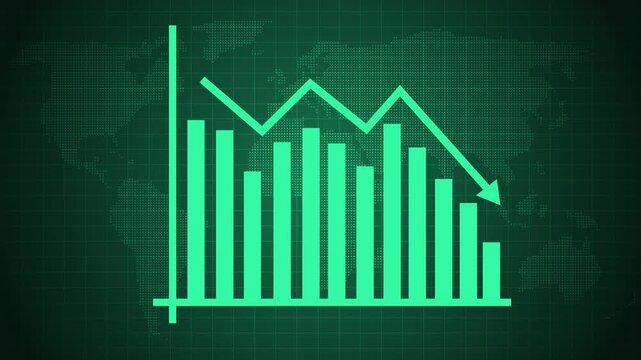
Bar chart animation displays declining columns with a falling trend line. Corporate business financial losses reflect on bar chart. Economic downturn marks the chart.
00:08
HD
South Africa Oil Prices Decline with Oil Barrels, Gold Coins and Downward Green Arrow, 3D Economic and Financial Market Concept
00:11
HD
Declining bar chart with downward trend, Blue bar chart with falling line graph decline in business data, finance performance and analytics animation
00:07
HD
Cognitive Reframing Word Cloud
00:11
HD
Collaborative Teamwork and Partnership in Real Estate Market with House Icon and Financial Indicators Representing Decrease in Property Values Sigmoid
00:15
HD
Mobile Network Signal Strength Animation
00:05
HD
Stopwatch animation showing time progression against a dark background with subtle lighting effects
00:05
HD
Red financial line chart showing market decline
00:08
HD
Stock Market Crash Illustration with Decreasing Graph and Arrow Going Down.. chart growth achievement digital. business growth currency stock and investment economy. Graph trending downwards.
00:10
HD
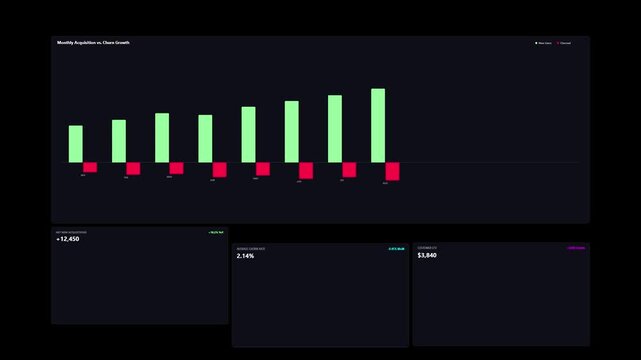
Colorful bar chart displayed on a dark dashboard interface.
00:10
HD
Mortgage interest rate concept, fluctuating financial markets, real estate investment, home ownership costing, and credit growth trends
00:17
HD
Digital counter animation with rapidly changing numbers on black background, for data and, statistics
00:08
HD
Volume control motion graphic user interface, increasing and decreasing sound levels with smooth bar movement.4K video.
00:06
HD
Digital E-commerce Promotion Banner Featuring Online Shopping Cart Graphics and Seasonal Discount Savings Offers
00:10
HD
Scotland economic bar chart graph showing decreasing downturn with national Flag 3D animation on black background.
00:16
HD
Digital animation showing a falling stock market with a bearish candlestick chart and line graph, representing financial recession, economic crisis, investment loss, and market volatility concepts
00:10
HD
Bright white 3D number 2028 text animation floating against a deep black void offering a vibrant and modern visual for the year with a sense of digital energy.
00:10
HD
Glowing Downward Arrows Stock Market Crash and Loss Concept Motion Graphic video...
00:10
HD
Pink 3D Descending Bar Chart Showing Decrease on Magenta Studio Background
00:05
HD
Digital piggy bank saving money by hand  symbolizes fintech innovation and digital savings.
00:15
HD
Food additive level indicator scale. Low normal high meter infographic animation on white background. Showing high food additive level color gauge indicator for nutrition and food safety monitoring.
00:10
HD
Seychelles Oil Prices Decline with Oil Barrels, Gold Coins and Downward Green Arrow, 3D Economic and Financial Market Concept
00:11
HD
Declining bar chart with downward trend, Blue bar chart with falling line graph decline in business data, finance performance and analytics animation
00:08
HD
Animated chart video showing data visualization with bar and line. Perfect for business, finance, analytics, and infographic presentations.
00:05
HD
Net zero goals and CO2 reduction strategy driving sustainability, green energy integration, net zero emissions policies, and climate-friendly sustainability solutions for business and society. Muxer
00:15
HD
Mobile Network Signal Strength Animation
00:05
HD
Zoom in and out animation the thermometer symbol. Large black symbol in the center and four small symbols around. Seamless looped 4k animation on white background
00:12
HD
33 percent symbol glowing on black background for business and finance concepts
00:06
HD
Blur color gradient. Wavy shade. Texture scratch. Variable abstract background art damage glare. Flow color change slow motion. Growth reduction spot flare.
00:24
HD
Business efficiency concept, how much a company or organization can produce as it relates to time, cost and quality. Glowing neon line of resources allocation icon isolated on transparent background.
00:15
HD
Optimizing logistics, inventory, and supply chain processes to decrease costs, improve efficiency, and enhance financial performance with data analytics and structured management
00:17
HD
Refund rate KPI dashboard card with return percentage, decrease indicator and trend chart. Animated motion graphics interface for ecommerce reports, customer service, retail analytics and payment
00:10
HD
Water Pressure Control Animation Showing Flow Dynamics
00:09
HD
Business user interface showing stock market graph chart with rising and falling indicators, financial data visualization 4k video
00:10
HD
glowing neon arrow direction on black background, neon arrow sign animation.
00:10
HD
A magnifying glass moves to clearly show the words revenue versus spam on a white surface at an office desk, symbolizing business analysis
00:06
HD
Bright white 3D number 2045 text animation floating against a deep black void offering a vibrant and modern visual for the year with a sense of digital energy.
00:10
HD
Animated concept showing cost reduction and quality improvement using blue down arrow and green up arrow on transparent background. Ideal for business, efficiency and quality improvement themes.
00:10
HD
Interest rate increase concept. Businessman use a Neon up arrow with percentage symbols and upward arrows, symbolizing rising interest rates. financial growth, dividend yield,
00:10
HD
Falling Chart with Arrow Animation, Animated Financial Crisis Chart with Trend Line Graph, Down business graph icon animation on black background.footage of Graph showing fluctuate downward trend.4k
00:10
HD
Icon representing a dollar coin with a downward arrow indicating a decrease in value
00:07
HD