Посилання, за допомогою якого можна встановити пароль, надіслано на цю адресу: Щоб отримати доступ до своїх покупок у майбутньому, вам буде потрібен пароль.
Отримайте 3 відео або 25 зображень у безкоштовній пробній версії
Додано нові фільтри
Сортувати за

19 605 результатів за запитом increase and decrease у категорії відео
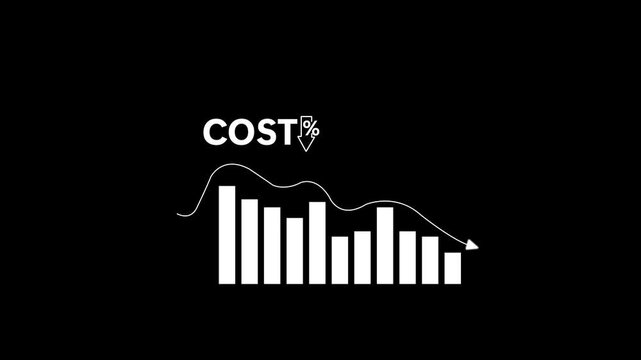
Cost reduction and cost saving through digital transformation, business cost optimization, operational cost reduction, financial savings, and resource 4k video animation.
00:06
HD
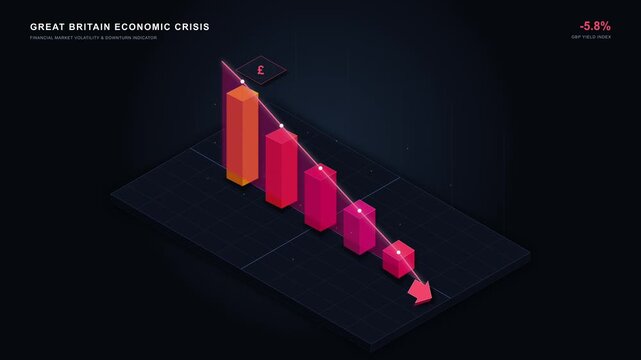
Downtrend Line Chart Animation, Declining Stock Market Graph, Falling Business Performance, Financial Loss, Bear Market, Negative Growth, Revenue Decrease, Economic Downturn Motion Graphic
00:10
HD
Animated neon Downward Arrow Chart Line for Stock Market Crash
00:10
HD
Digital gauge showing progress from 1 percent to 97 percent and then slightly down to 95 percent with an upward arrow indicating growth
00:10
HD
Cost reduction and cost saving through digital transformation, business cost optimization, operational cost reduction, financial savings, and resource efficiency strategies for business success. Spire
00:20
HD
Large black dirham symbol zooms in and out at the center, surrounded by four small copies. Seamless looped 4k animation on white background
00:12
HD
Abstract Bar Chart Animation Data Visualization Growth and Trends
00:08
HD
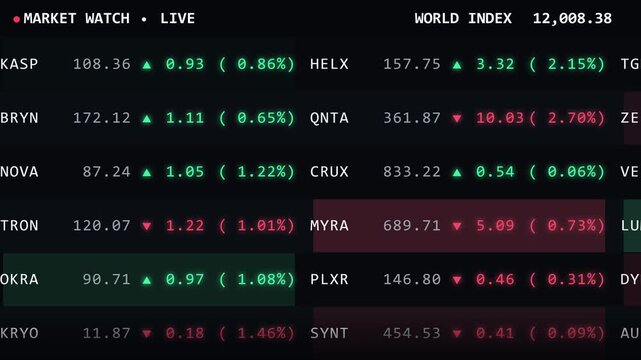
Stock market tickers with green and red fluctuating numbers, digital display of financial data, trading analytics, economic trends, global index overview
00:06
HD
Business graph. loss graph direction. damage business graph. down business graph icon. business or finance concept icon animation.
00:07
HD
Upward arrow direction One line continuous drawing animation. animated hand- drawn banner lineart illustration design. isolated sign symbol monoline video golden outline on white background backdrop
00:10
HD
Neon Celsius thermometer displayed temperature 32 degree. Digital Temperature Meter Display 32°C. That's indicates weather temperature 32 degree increase or decline.4k video.
00:10
HD
Cost reduction business finance concept. Businessman cost reduction icon with down arrow for budget management and cost management.4k video animation.
00:10
HD
4k Resolution Video: Market Volatility Concept. Animating Green Upward And Red Downward Arrows Show Mixed Financial Trends On White Background With Alpha Matte
00:20
HD
Declining Bar Chart With Downward Arrow Animated Icon With Alpha Channel. Economic Downturn, Financial Loss, And Market Decline Motion Graphic. On Transparent Background
00:07
HD
Animated graphic showing 10% reduction with arrows and wavy line
00:07
HD
Business graph chart arrow line down red color animation on white background. growth concept red moving.
00:13
HD
Animated Downward Financial Trend Chart Green Screen
00:10
HD
Glowing neon red animated line graph illustrating a downward market trend on black background. 4K Video motion graphic animation
00:10
HD
Graph displaying white bar chart with up ward arrow on green background. Suitable for finance, business, stock market concepts. Bright and impactful.
00:07
HD
Business Growth Chart with Up and Down Arrows Animation.Motion graphics of concept
00:10
HD
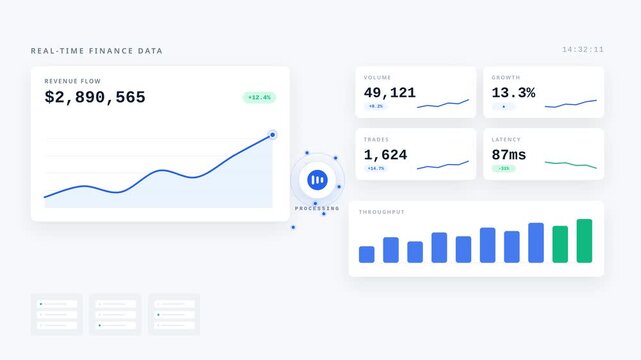
Modern Fintech Digital Dashboard Real Time Financial Data Updates Revenue Growth Upward Trends Latency Decrease
00:05
HD
Bar chart animation displays financial market decline with negative data. Corporate business losses track on this active bar chart. Economic downturn marks the chart.
00:08
HD
Fuel gas gauge meter decreasing and increasing with alpha channel. Full gas fuel gauge dial 2d animation black screen
00:10
HD
Pixelated bar graph animation showing downward trend, representing financial decline, recession, or negative growth
00:06
HD
Cost reduction and cost saving through digital transformation, business cost optimization, operational cost reduction, financial savings, and resource efficiency strategy for business success. Funnel
00:15
HD
Bar Chart, Profit Down, financial decline trend line chart, Economic crisis, recession, inflation, decrease graph. Bar chart Profit down. Concept of economic crisis, recession, inflation.
00:10
HD
Dynamic Bar Graph Animation Showing Data Trends Over Time.
00:07
HD
Up and down arrow icon set, glowing neon upload download symbol on black background
00:10
HD
Bar graph data decreasing over time on a digital display with a green neon glow
00:10
HD
Red graph depicting declining values progresses across a black background
00:10
HD
Neon Celsius thermometer displayed temperature 35 degree. Digital Temperature Meter Display 35°C. That's indicates weather temperature 35 degree increase or decline.4k video.
00:10
HD
Abstract Blue Data Visualization Bar Chart Animation with Line Graph
00:05
HD
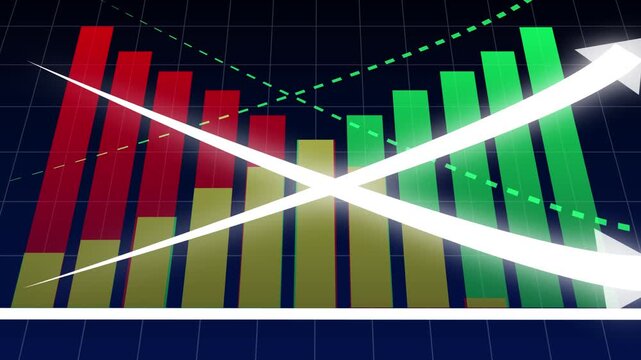
Financial Market Comparison Showing a Shift from Declining Red Performance to Rising Green Growth with Crossing Arrows, Recovery Trends, and Business Transformation
00:10
HD
Animation of speaker volume with alpha channel, Speaker volume animation. sound up down icon
00:06
HD
Abstract decrease icon on green background. Reduce cost concept with dollar and down arrow animation.
00:10
HD
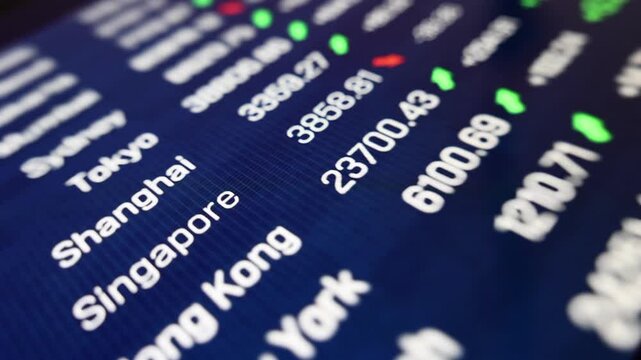
Close-up screen financial markets dashboard, global stock index data, trading board. Investment, stock exchange data, price, risk, strategy, analyzing, business.
00:11
HD
Business bar chart representing financial decrease and stock market loss shown in blue neon glowing lines on dark grid background with downward arrow animation for economic data visualization.
00:06
HD
A declining grey line passing through a central ring to emerge as an ascending green growth arrow, symbolizing B2B customer retention models, churn reduction analytics, SaaS business growth strategy.
00:06
HD
Blue Declining Bar Chart Representing Falling Statistics
00:10
HD
Business graph chart with growing business concept. Abstract decreasing business graph chart animation background.Motion graphics of concept
00:10
HD
graph chart up down business statistics
00:06
HD
Downward Trend Arrow Icon Isolated on White Background.Business Performance Decline Arrow Isolated Vector Icon.
00:06
HD
Animated down graph icon designed in flat icon style. Finance, Business Info graphic animation, Bar down graph Animated down graph icon, business or finance, down graph bar,4k video
00:10
HD
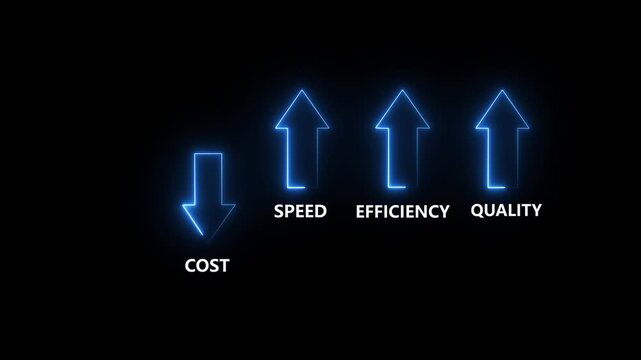
neon arrows showing business growth, speed, efficiency, quality and cost comparison on a black background.4k
00:10
HD
Cost reduction and cost saving through digital transformation, business cost optimization, operational cost reduction, financial savings, and resource efficiency strategies for business success. Spire
00:20
HD
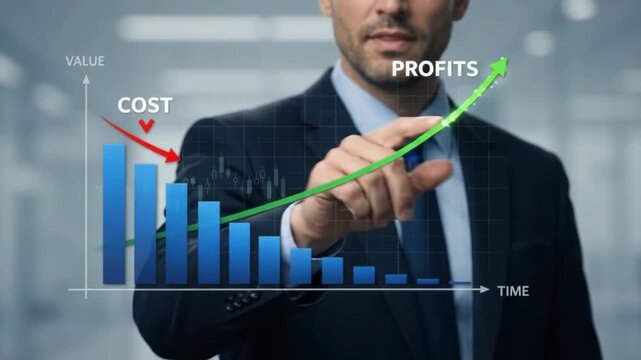
Businessman pointing at financial performance graph illustrating rising profits and reduced operating costs
00:10
HD
Circular Economy Word Cloud Concept with Sustainability Keywords on a
00:14
HD
Neon style decrease income animation featuring hands and dollar currency on a black background
00:08
HD
Abstract bar graph animation with glowing purple neon lines on a black background
00:10
HD
Animated graph with bouncing red icons across a wave line on blue gradient background
00:05
HD
Neon Celsius thermometer displayed temperature 37 degree. Digital Temperature Meter Display 37°C. That's indicates weather temperature 37 degree increase or decline.4k video.
00:10
HD
Decrease icon for Reduce cost sign concept with dollar and down arrow animation on a black background. Dollar rate up to down looped sign and symbol icon animation concept
00:08
HD
Financial chart with bars and upward arrow growth decline and recovery animation
00:10
HD
Animation of speaker volume with alpha channel, Speaker volume animation. sound up down icon
00:06
HD
Animated bar and line graphs showing financial market trends and business growth, 4K UHD footage cinematic animation, fit for corporate data dashboard and financial reporting presentations.
00:07
HD
  Quality improvement and cost reduction concept. in allusive graph chart showing marketing sales profit increasing to future target.
00:10
HD
Green progress bars with glowing white numbers indicating growth and decline in business finance
00:05
HD
Business finance graph chart animation featuring increasing monthly sales, glowing upward profit trend, and smooth revenue growth on black background for success concepts
00:17
HD
Temperature management screen, user drags the slider to change the temperature
00:13
HD
Reduction concept with glowing 3D bar graph, business cost reduction strategy, decreasing financial chart with holographic arrow and text
00:05
HD
Restrictions gauge rises into high-risk red zone, then falls toward low levels, presenting changing limits, pressure, control, recovery, and performance metrics. Copy space
00:40
HD
Downward Trend Arrow Icon Isolated on White Background.Business Performance Decline Arrow Isolated Vector Icon.
00:06
HD
Business Data Fluctuation Curve - Ups and Downs, Change, Increase, Decrease of ROI concept - minimal motion graphics clip, Green Screen, foreground color 7.5% gray
00:15
HD
neon arrows showing business growth, speed, efficiency, quality and cost comparison on a black background.4k
00:10
HD
Cost reduction and cost saving through digital transformation, business cost optimization, operational cost reduction, financial savings, and resource efficiency strategies for business success. Spire
00:20
HD
4k .Cost reduction concept. Cost wording on decrease money with down arrow. Cost Management, Economy recession, low budget, Effective business,
00:10
HD
Animated green line graph dynamically moves across a minimalist grid background, visualizing data changes.
00:05
HD
Financial chart with fluctuating glass bars and an upward trend line on transparent background
00:10
HD
Green up arrow and red down arrow motion animation comparing growth and decline, success and failure concepts on clean minimalist background
00:16
HD
Pinpointing areas for improvement involves evaluating business processes, identifying weak points, optimizing workflow, and developing strategies for organizational growth and enhanced productivity
00:17
HD
Battery charging animation loop, showing power level increasing and decreasing with a lightning bolt symbol on a dark background. This digital interface icon represents device power status.
00:10
HD
Financial chart with rising and falling bars and trend line
00:12
HD
Minimalist neon blue bar chart with downward trend arrow animation for financial data analysis and business performance reporting
00:06
HD
Falling bar chart with a downward line and rising arrows animation, Business chart with rising arrows decline
00:09
HD
Simple bar and line chart showing business graph data trend and growth animation
00:07
HD
Digital transformation in business concept. Leveraging modern technologies; automation, data analytics, cloud computing and AI to increase efficiency, reduce costs and gain competitive advantage.
00:12
HD
Stress level meter increasing and decreasing animation
00:32
HD
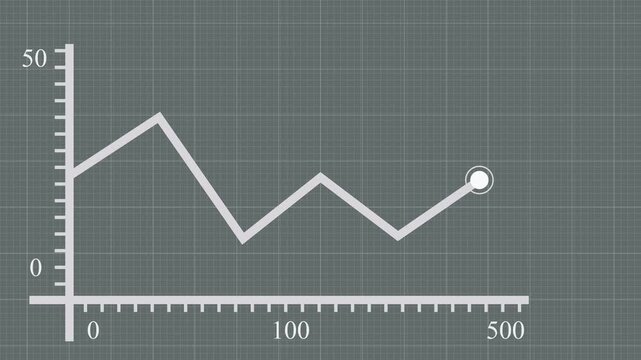
Dynamic Line Graph Animation
00:36
HD
Cost reduction and cost saving through digital transformation, business cost optimization, operational cost reduction, financial savings, and resource 4k video animation.
00:06
HD
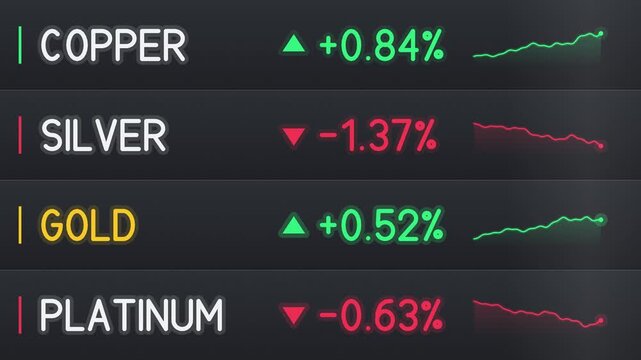
Stock market prices for copper silver gold and platinum displayed with charts
00:06
HD
graph chart up down business statistics
00:08
HD
Up and Down Arrow Chevron Icon Set with Gradient Levels on Black Background. Ideal for Navigation, Direction, UI, Interface, and Motion Graphics.
00:10
HD
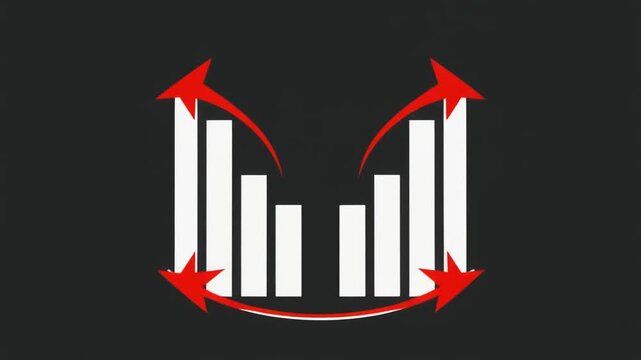
Dynamic bar graph animation with recursive red arrows, representing growth, analysis cycles, and feedback loops, for business data visualization and financial reporting.
00:05
HD
Colorful 3D bar graph with varying heights against a dark background chart data
00:05
HD
Cost reduction and cost saving through digital transformation, business cost optimization, operational cost reduction, financial savings, and resource efficiency strategies for business success. Elide
00:14
HD
Profit high growth percent icon, stocks, financial, Interest rate and dividend concept. Glowing neon line animated graph and chart with percentage icon on a black background,4K Animation...
00:10
HD
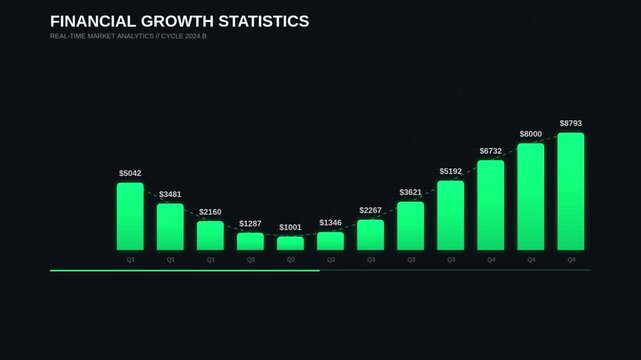
Green Bar Chart Financial Growth Statistics Animation on Dark Background
00:08
HD
Financial Stock Market Crash and Downward Economic Trend Chart
00:14
HD
Business graph chart with growing business concept. white colors Abstract decreasing business graph chart animation business chart, icon, decreasing graph, motion graphic animation..
00:10
HD
Animated volume control slider bar with speaker icon isolated on green screen chroma key background, digital audio adjustment interface element for video editing and multimedia projects
00:10
HD
Colorful bar chart, line graph, and data visualization with glowing effect for financial analysis, business growth, digital statistics, economic trend, futuristic technology, investment
00:08
HD
Candlestick chart trading in the stock market
00:10
HD
A plant is growing on top of a pile of coins. The coins are arranged in a pyramid shape, ESG Environmental, social, and governance, carbon reduction net zero and climate change
00:10
HD
Smart Eco rooftop passive AI solar Save the planet earth in Net zero ESG SDGs plant go green world global low CO2 emission. Future growth Panels cells roof grid sun light electric power supply panel.
00:10
HD
Neon glowing medical thermometer icon animation. That's indicates weather temperature 34 degree increase or decline. Thermometer equipment showing hot or cold weather.
00:10
HD
Glowing blue business bar chart with downward arrow and declining line curve. Symbolizing revenue drop, financial loss, negative growth, market downturn 4K
00:07
HD
Animated decrease icon
00:06
HD
Simple arrow icon representing direction, navigation, movement, and progress.
00:10
HD
Awareness level gauge meter animation: measuring low to progress and status indicator
00:10
HD
Global humanitarian aid facing challenges with decreased financial support and increased needs due to crisis, impacting vulnerable populations and international assistance efforts
00:17
HD