Посилання, за допомогою якого можна встановити пароль, надіслано на цю адресу:
Щоб отримати доступ до своїх покупок у майбутньому, вам буде потрібен пароль.
Знайти подібні.
Перетягніть зображення
або
Зображення завантажується…
Творіть без обмежень — необмежені завантаження й потужні інструменти редагування на базі ШІ


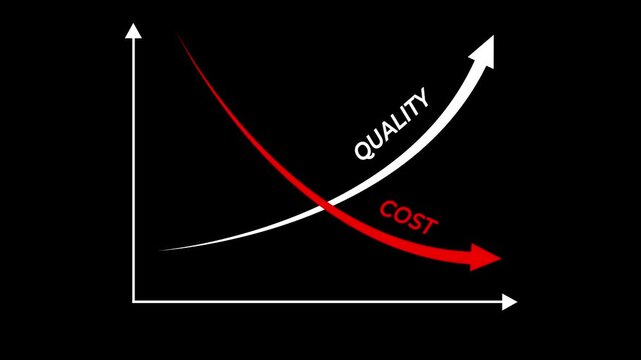
![Business Growth Analysis: Cost Optimization & Quality Improvement with Data Analytics & Tech [108 chars]](https://t3.ftcdn.net/jpg/15/52/30/58/360_F_1552305824_t7XxKQgqhwLdg82a43cG3QwM4vKYEZiy.jpg)