Посилання, за допомогою якого можна встановити пароль, надіслано на цю адресу: Щоб отримати доступ до своїх покупок у майбутньому, вам буде потрібен пароль.
Отримайте 3 відео або 25 зображень у безкоштовній пробній версії
Додано нові фільтри
Сортувати за

95 001 результат за запитом chart , digital , plot у категорії відео
Blue arrow graph rising through digital bar chart during economic growth with dark background
00:05
HD
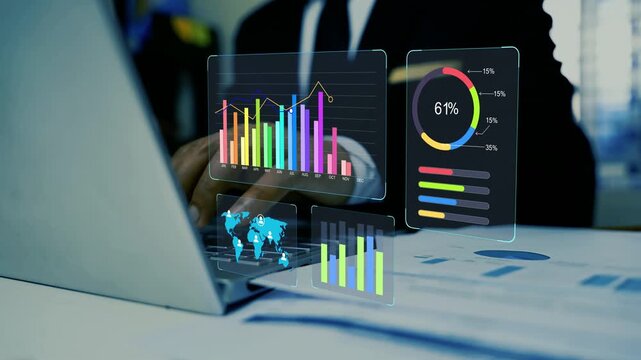
Businessman reviewing holographic financial charts on a laptop and documents with a glowing digital graph overlay, Business analyzing financial charts at office desk
00:11
HD
Business analytics dashboard with laptop in office, Business person using a laptop with holographic floating digital charts and data dashboards on a desk
00:10
HD
An illustration representing a digital organizational chart set in a modern office, showcasing team structure and collaboration among business professionals for strategic planning. Raster
00:20
HD
Glowing digital business growth chart showing positive trend and upward progress video
00:06
HD
Businessperson using a laptop with a digital hologram finance dashboard, Holographic financial planning dashboard with growth chart animation
00:09
HD
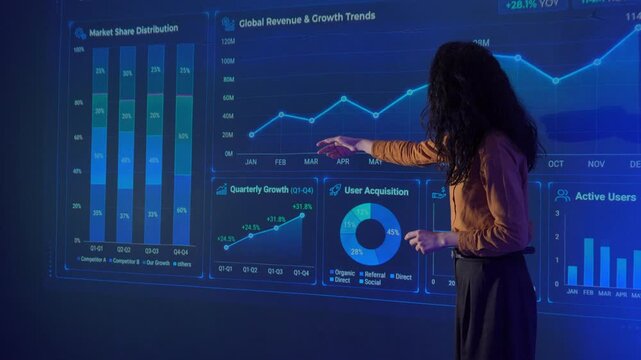
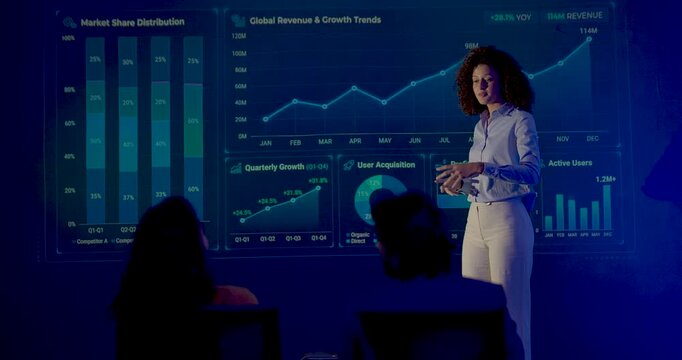
Businesswomen analyzing global market trends and revenue data during a corporate presentation, teamwork, data analytics, financial strategy, and technology-driven decision making in a modern office.
00:17
HD
Neon digital growth chart transitioning from 2026 to 2027: business strategy and financial planning concept
00:10
HD
Abstract digital project management board with interactive task cards and notifications on a dark purple background
00:10
HD
Hands, tablet and person writing in notebook for planning, agenda or financial report. Accountant, notes and digital bookkeeping with to do, data analytics or tasks for business audit and summary
00:06
HD
Businesswoman analyzing financial reports and accounting data, using a calculator and digital tablet for strategic planning and economic success in the modern office
00:11
HD
Abstract Gantt chart project management dashboard showing task schedules, progress bars and monthly timelines on digital background, illustrating workflow planning and project tracking.
00:12
HD
Abstract digital arrow pointing upwards, representing growth and progress in the future
00:08
HD
Business growth roi increase with ai integration system development reduce cost improve efficiency successful corporate strategy innovation project management strategic planning corporate progress
00:05
HD
Adult female business presenter speaks beside digital performance dashboard, using expressive gestures while explaining growth analytics to seated audience during corporate intelligence presentation.
00:13
HD
Side Profile Portrait of Stockbroker at Desk Looking at Computer Screens Showing Stock Exchange Data, Equity Charts, Investment Analytics, Asset Management, Financial Graphs to Track Market Trends
00:16
HD
A young professional is examining investment data graphs and charts, analyzing financial information, and monitoring stock market trading reports.
00:38
HD
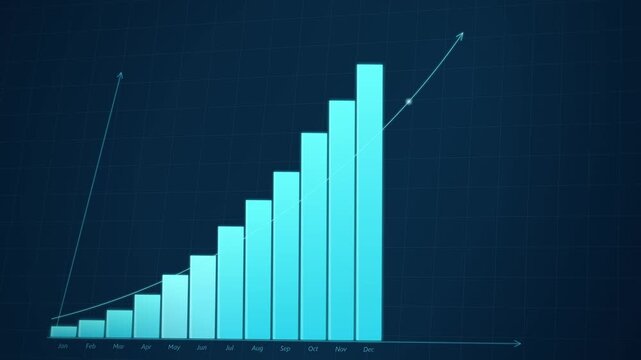
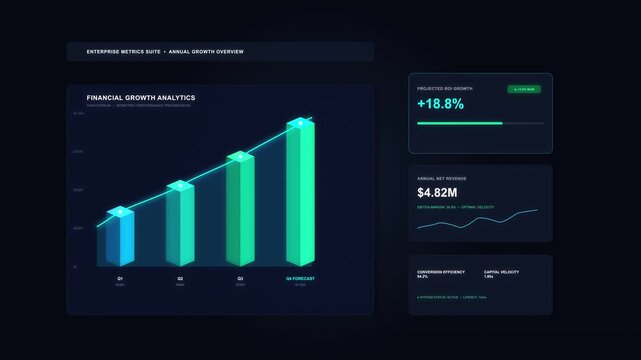
Financial growth bar chart with rising trend line, digital business analytics and market performance visualization
00:15
HD
Businessman touching on hologram digital dashboard overlay showing graph charts, map and growth data animation, Holographic modern business analytics, finance planning and market performance
00:10
HD
Hand typing on laptop keyboard with digital hologram financial chart gear for enterprise technology data analytics performance optimization business revenue growth investment strategy success profit
00:10
HD
Businessman touching a futuristic digital control panel with big data graphs, charts and key performance indicators, concept of data analysis, business intelligence and IoT management
00:07
HD
Doctors show teamwork at computer for records consultation. Two physicians review charts on dual monitors, coordinating diagnosis and updating files. Concept of digital healthcare teamwork.
00:07
HD
Hormuz Two-Way Lanes Navigation Visualization, Maritime Traffic Flow, Geospatial Mapping Animation, Oceanic Route Planning, Digital Topography, Seamless Loop, Modern Navigation Graphics
00:12
HD
Interactive Data Visualization Dashboard with Project Management Metrics and Analytics for Business Review and Planning in Modern Office Environment Gluon.
00:10
HD
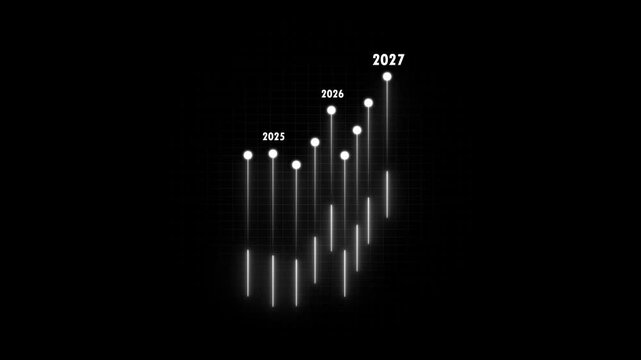
Animated financial growth bar chart with future projections 2025-2027, glowing digital data visualization for business analytics and market trends
00:10
HD
Senior insurance advisor showing financial charts and data on a tablet to a young female client during a professional office consultation.
00:12
HD
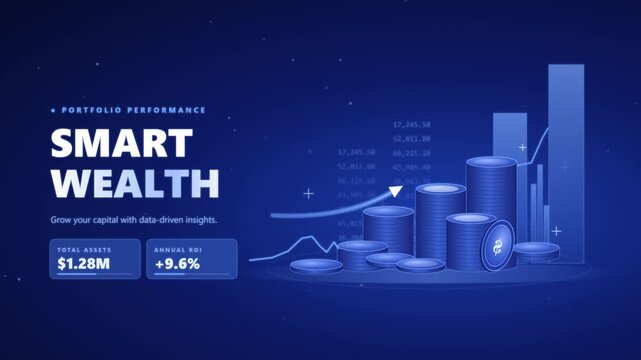
Financial growth concept with blue digital interface showing animated rising bar charts and coin stacks for wealth management and investment planning
00:08
HD
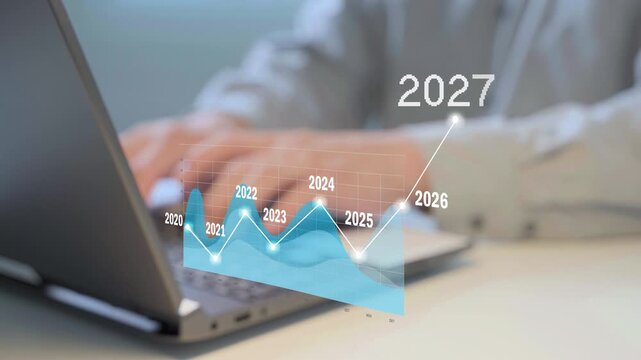
Person types on laptop, digital growth chart hovers above keyboard, showing years 2020 to 2027. Fingers press keys, glowing line graph rises steadily
00:15
HD
Golden 3D bar graph chart illustrating financial success and business growth with rising arrow, positioned over a blue digital global map, representing investment planning, wealth management, 4K video
00:05
HD
Hand placing a bar on a chart while displaying various types of graphical representations, concepts of data analysis, financial growth, and business strategy
00:17
HD
 Futuristic digital interface illustration depicting automated workflows corporate  Business market animation featuring financial growth  chart ,using ,team ,icons
00:08
HD
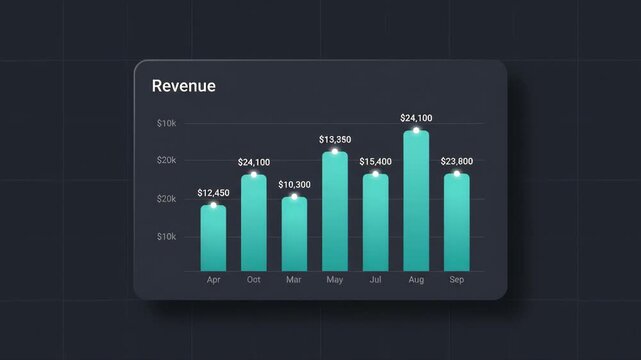
digital bar chart display showing monthly revenue fluctuations with glowing teal bars on dark interface background representing financial data analytics statistics and business growth tracking
00:06
HD
Abstract digital growth chart with glowing light trails representing financial success and data analysis trends in a modern corporate environment
00:10
HD
Profit growth business chart with digital revenue development shown on a modern dashboard screen interface for corporate financial success strategy
00:10
HD
Gantt chart planned by an AI agent robot, then tracked through plan, build and test phases on a calendar
00:15
HD
Hands working on a smartphone while graphs and icons are displayed on a screen representing data and analytics in business settings
00:10
HD
Growing bar chart motion graphic shows positive financial trend on dark digital background.
00:10
HD
Financial growth bar chart with rising arrow animation, business success and market analysis concept, digital data visualization background
00:15
HD
Workflow process optimization interface displaying business methodology layout and corporate data analytics.
00:14
HD
Glowing bar and line chart on digital background showing market growth animation, Financial growth chart with bar and line graph
00:10
HD
Blue business bar chart growing upwards against a dark digital background representing financial growth, success, data analytics, and modern corporate strategy concepts
00:10
HD
Dynamic financial growth bar chart animation with rising trend line and glowing success arrow for corporate business presentations, stock market analysis, economic forecasting, and data visualization
00:10
HD
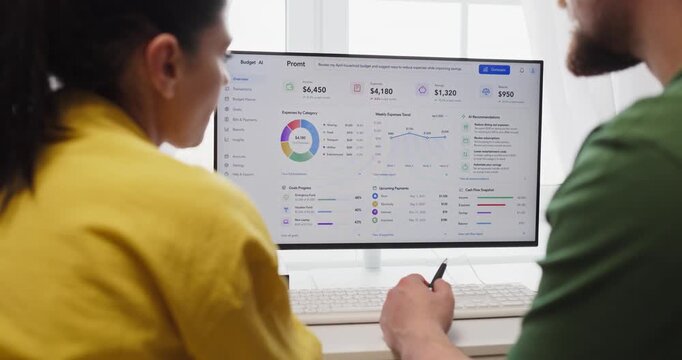
Couple budget planning on finance dashboard online. They review savings and monthly expenses on a computer at home using charts analytics for smarter choices. Clear concept of home finance teamwork
00:08
HD
A sleek laptop showcases a bright ERP concept with glowing icons symbolizing business processes and analytics, illustrating the essence of modern technology in the workplace. Salient
00:12
HD
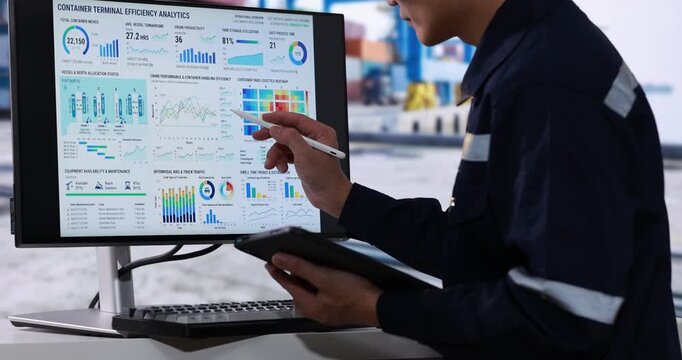
Industrial worker using a tablet beside a monitor energy efficiency charts and factory data in a modern control room.
00:26
HD
Business person using a laptop with hologram glowing charts and rising arrows animation on the screen, Business data growth, finance planning, market analysis and digital business success
00:08
HD
Digital Document Download Illustration Featuring Analytical Business Charts and Reports
00:10
HD
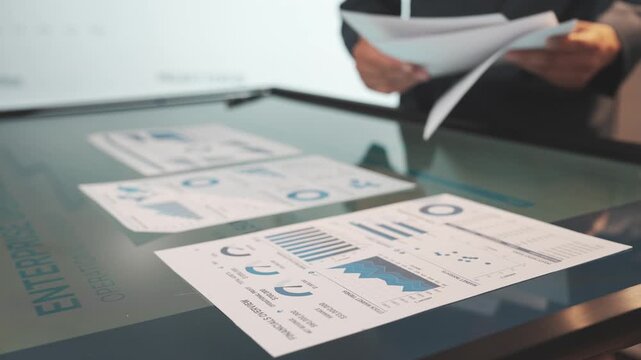
Two business professionals analyze financial documents and digital data charts on an interactive table screen using a pen and calculator during a corporate strategic planning meeting.
00:08
HD
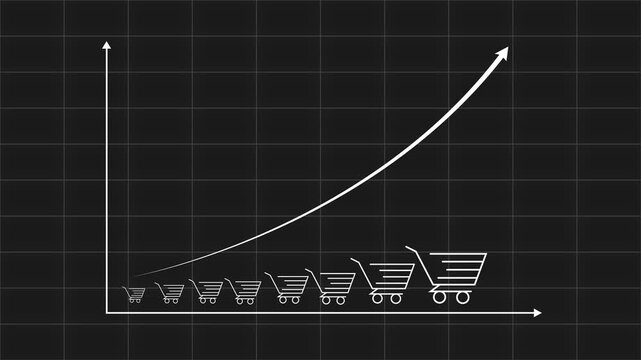
E-commerce growth concept showing shopping cart rise and an upward arrow chart for increasing digital retail sales
00:10
HD
Growing financial bar chart with upward trending arrow, showing business growth and positive investment, digital abstract background
00:08
HD
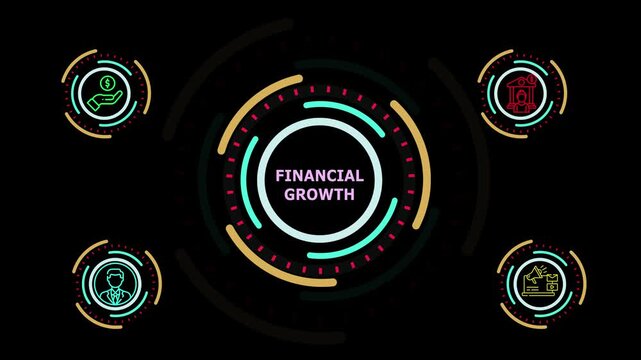
 Futuristic digital interface illustration depicting automated workflows corporate  Financial Growth chart ,using ,team ,icons, banking institution symbol, and corporate manager.
00:08
HD
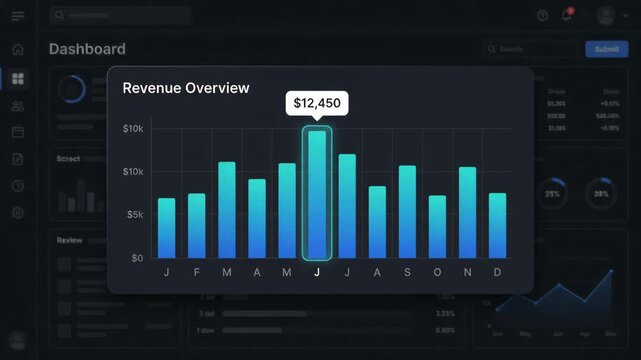
digital revenue overview bar chart displaying monthly financial data centered over blurred business management dashboard interface showing various analytical graphs and performance metrics
00:06
HD
Businessman hands typing on a laptop with a glowing hologram bar chart animation on the screen, Holographic online business growth data analysis and financial progress in a dark office
00:06
HD
Businessperson presents rising digital bar chart and interacts with data. Business growth and financial analytics. Technology, investment and success concept. Corporate office.
00:07
HD
Glowing digital globe with network lines and a financial chart rising toward the year 2027 in a vibrant abstract space. Futuristic technology visualization of global market growth and connectivity.
00:05
HD
animated stock market line chart and bar graph digital data trend
00:06
HD
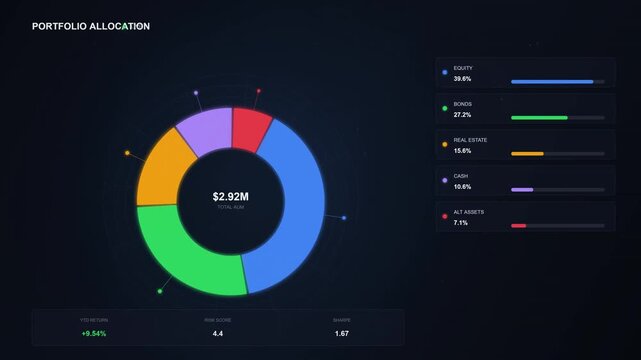
Cutting-edge digital interface showcasing dynamic financial portfolio allocation with an interactive donut chart and detailed investment insights, rendered in a sleek, modern visual display
00:10
HD
AI payroll system interface showing employee salary data, budgeting graphs, and monthly calendar used on laptop for digital finance management and automated compensation planning in business setup, 4k
00:12
HD
Neon growth chart with upward trend during dark digital background showing successful business progress
00:05
HD
A person types on a laptop in a dimly lit setting. Green digital images of charts and graphs appear in a layout on the screen, suggesting data analysis or financial planning.
00:10
HD
Business person touching a digital holographic financial chart with glowing bars and data icons animation, Hologram market analysis growth strategy and modern technology
00:10
HD
Businessman analyzing glowing green financial stock market chart with upward growth trends in this high quality digital motion video clip
00:05
HD
Business implementation strategy concept with digital icons, global network and financial growth charts
00:10
HD
Explore a modern workspace showcasing advanced data analytics and cognitive technology with digital dashboards. Perfect for illustrating business strategy and innovation. Raster
00:20
HD
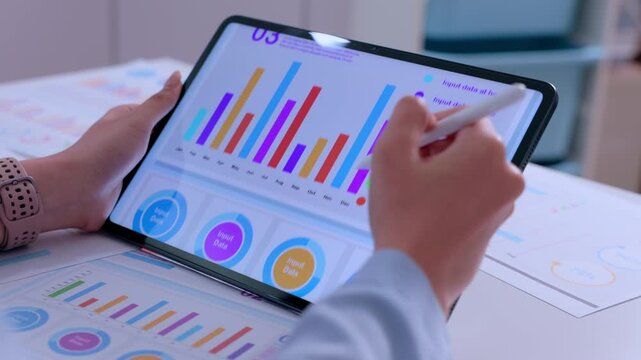
Tablet chart graph data analysis hand stylus report business digital dashboard colorful analytics screen finance planning office workspace reviewing document growth insights
00:10
HD
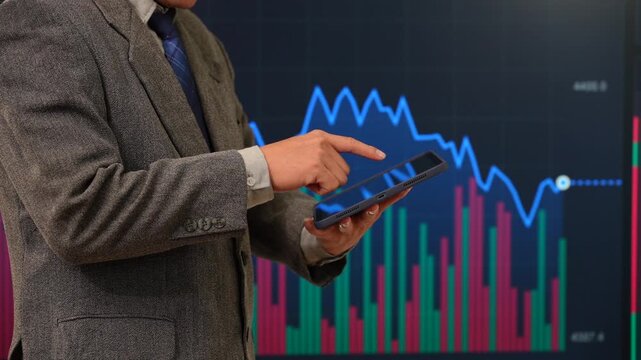
Businessman using a tablet in front of a digital stock market chart with blue price lines and colorful trading bars.
00:11
HD
Glowing blue neon line graph moving upward on dark background, financial success concept, business growth chart animation, digital marketing analytics, economic progress and corporate profitability
00:10
HD
A professional businessman holds a glowing digital growth chart
00:08
HD
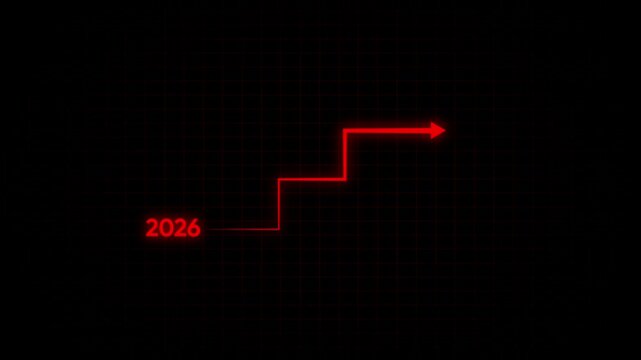
Financial growth chart 2026 to 2027: red neon step graph showing business progress and economic success on digital grid background
00:10
HD
digital chart showing positive trend growth with bar graph and line graph elements on a dark blue background with subtle digital pattern, ideal for finance concepts
00:06
HD
 Futuristic digital interface illustration depicting automated workflows corporate Banking concept  financial growth chart , team icons, checklist symbols to represent Banking efficiency .
00:08
HD
Growing blue neon bar chart animation with upward arrow during dark night background concept for financial success
00:05
HD
Futuristic project management dashboard display with glowing digital data charts and interactive financial analytics interface on a dark high tech background loop
00:15
HD
Animated AI project timeline dashboard automatically generating Gantt chart schedule for roadmap
00:12
HD
Animated white bar chart graph with rising trend arrow on a clean black background, representing financial growth, business success, data, analysis, market expansion, and positive economic progress
00:10
HD
Animated business data visualization: bar chart and scatter plot comparison on digital screens analytics
00:10
HD
Rising blue bar chart with upward arrow trend line digital animation growth success concept finance market progress data visualization motion clip.
00:10
HD
Animated bar chart with rising trend arrow showing business growth and financial success
00:05
HD
futuristic interactive screen with digital data infographic project management dashboard display charts and interactive financial analytics interface
00:20
HD
Understanding risk levels in finance using a digital display during a business meeting in an office.
00:10
HD
Businessman using laptop with rising digital chart steps and 2026 to 2027, 2026 to 2027 business growth, financial planning, technology, and future success.
00:09
HD
Social media analyst monitoring performance metrics on dashboard interface. Audience engagement tracking, digital marketing campaign analysis, data visualization, and content strategy optimization.
00:10
HD
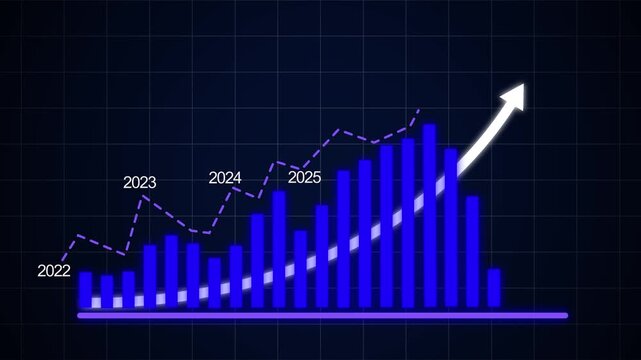
Dynamic financial growth bar chart animation featuring rising green columns and upward trending arrow representing annual business success and economic development projections from 2022 to 2027 period
00:10
HD
A hand presenting a virtual bar chart illustrates increasing growth with digital lines and a futuristic backdrop, symbolizing financial success and analytics. Copula
00:10
HD
Digital infographic with rising bar chart growth, financial data displays, and positive analytics, blue and green neon glow
00:06
HD
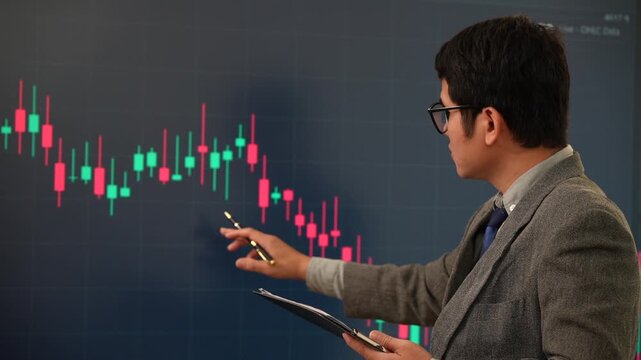
Businessman in glasses points at a falling stock market candlestick chart on a large digital screen, showing financial analysis and investment risk.
00:12
HD
Businessman using a laptop with hologram digital charts and growth icons  , Business growth chart and data analysis on laptop
00:08
HD
Dynamic financial bar chart animation representing annual business growth and market success from 2022 to 2027 with rising trend arrows and data visualization for corporate economic presentations
00:10
HD
Businessman touches a glowing digital hologram chart with rising bars, arrows and data lines, showing financial growth, investment planning and market analysis.
00:09
HD
Data visualization animation showing digital bar charts and abstract network nodes moving across white background in dynamic business video footage
00:10
HD
Business professionals analyzing stock market financial growth charts on digital screens.
00:07
HD
Abstract financial growth chart with glowing lines and numbers on a digital blue background
00:10
HD
Tablet screen, graphs and planning hands of man for statistics, charts or data analytics, writing and financial growth report. Business, digital marketing and man with profit, sales and pie chart
00:09
HD
AI SEO assistant data, Financial growth stock market business chart green arrow success investment profit digital graph upward trend economy business growth chart financial
00:08
HD
Business growth chart target goal hand holding digital graph upward arrow people icons increasing success audience engagement timeline 2021 to 2026 blue glow dark background
00:08
HD
Top View of a Business Meeting With Interactive Holographic Data Visualizations. Professionals Analyze Charts, Graphs, and Percentages Projected. AI Technology in Modern Corporate Revenue Growth
00:13
HD
Abstract digital network data background, 3D rendering
00:30
HD
Bussineswoman using a digital tablet with stats and graphics
00:09
HD
Reviewing business report on digital tablet
00:14
HD
A person in a blue shirt holds cupped hands beneath floating chart icons and light effects in a dark setting, suggesting business data or digital technology.
00:10
HD