


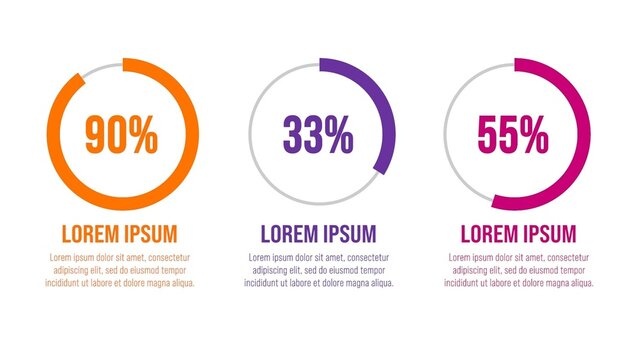
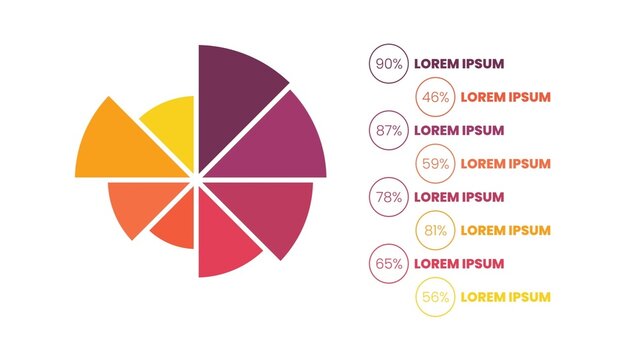
Modern Pie Style Circle Graph Chart With Percentages and Details Infographic


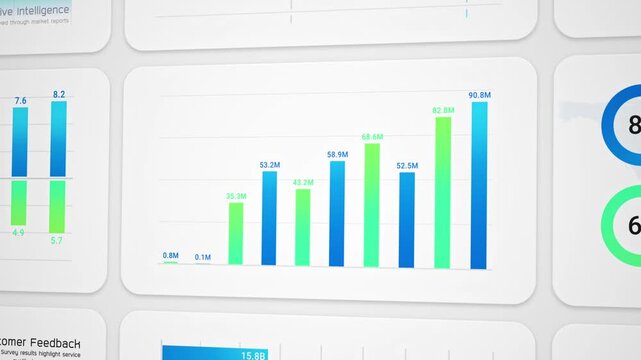
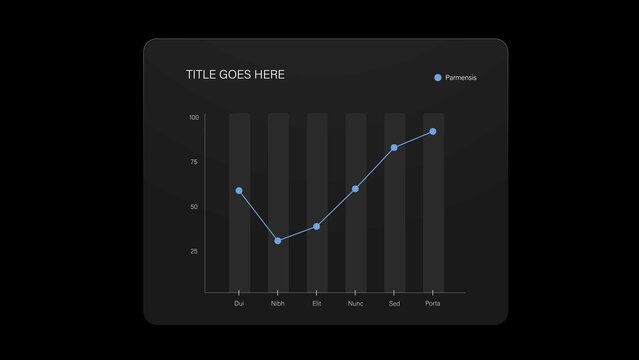
Line Chart Infographic Video Template

Stat Infographic with Increase and Decrease
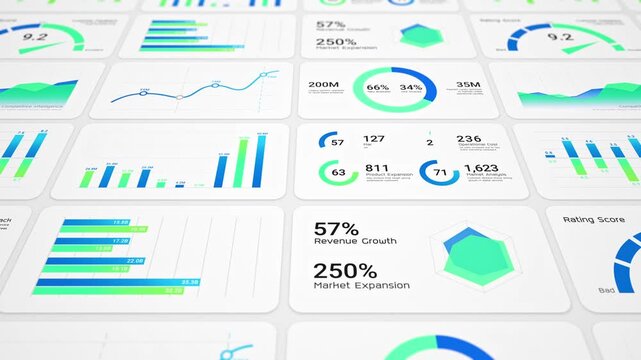
Modern Design Infographic Data Visualiser Graph
HUD Neon Icon Graph Puzzle
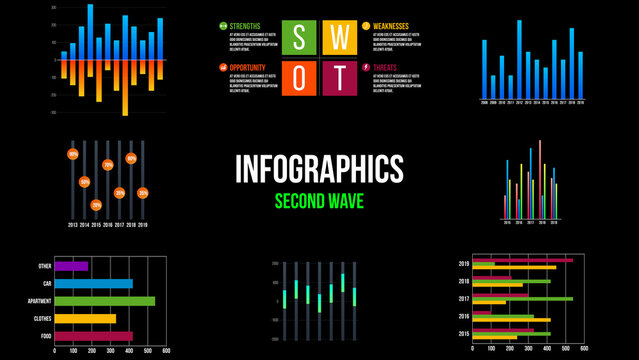
8 Infographics Elements