設定密碼的連結已經傳送至: 日後若要存取您的購買項目,您將需要使用密碼。
免費試用:取得 10 張素材庫影像,並使用 AI 編輯工具
已新增篩選器
排序方式:

在全部中找到 38,312 個「bar chart data text」的結果

檢視 bar chart data text影片中 (4136)
Abstract pie chart with 60 percent progress bar animation on pink background . Pie chart business and finance visual data representation for sales and statistics .4k animated video .
00:09
aet 
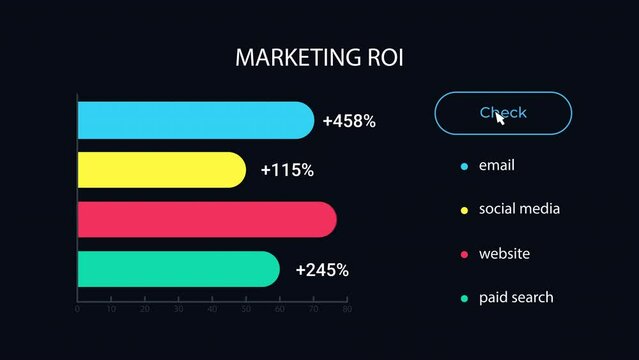
Corporate Glass Bar Chart
Abstract pie chart with 50 percent progress bar animation on black background . Pie chart business and finance visual data representation for sales and statistics .4k
00:09
mogrt 
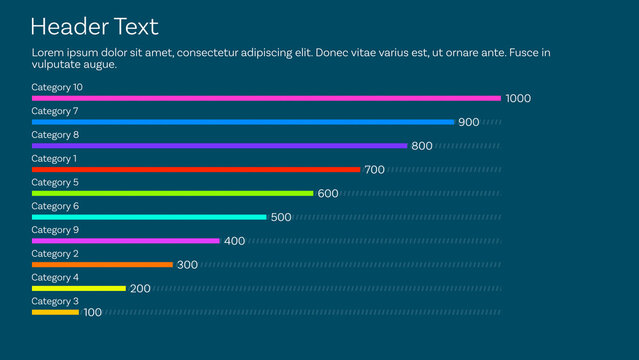
Horizontal Bar Chart for Design and Data Visualization Design and Slide Presentation and with 10 Animated Data Points + Responsive Custom Text + Color with Ordering Options and 3 Options for Bar Width
Abstract pie chart with 100 percent progress bar animation on black background . Pie chart business and finance visual data representation for sales and statistics .
00:09
Bar chart animation with cyan text grid. Bar chart market analysis data. Bar chart business statistics graphic on black.
00:12
aet 
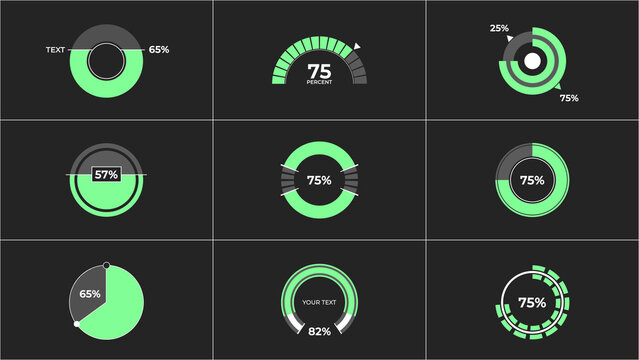
Circle Ring Infographic
mogrt 
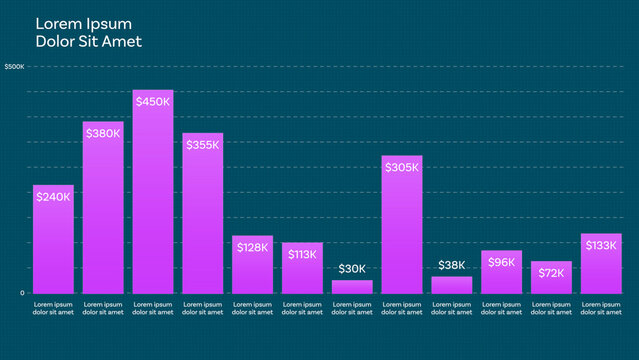
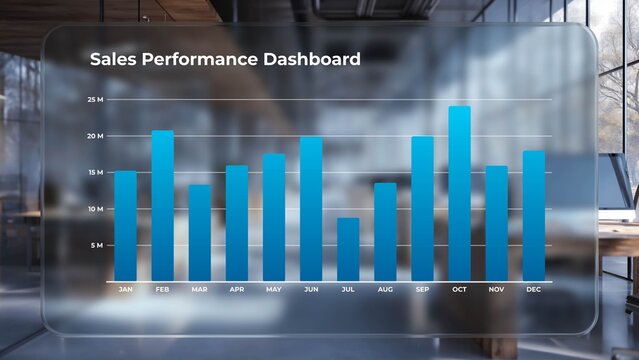
Responsive Vertical Bar Chart for Design and Data Visualization Design and Slide Presentation and with 12 Animated Data Points + Custom Text + Color with Dual Bar Graph Mode and Dynamic Auto-width Bar
Abstract pie chart with 90 percent progress bar animation on white background . Pie chart business and finance visual data representation for sales and statistics .4k animated video .
00:09
Animated ROI bar chart UI element. Return on marketing investment. Looped 4K video template with alpha channel transparency. Data visualization. Dashboard component animation for dark theme
00:07
Template for text with hand drawn chalk infographics.
00:25
aet 
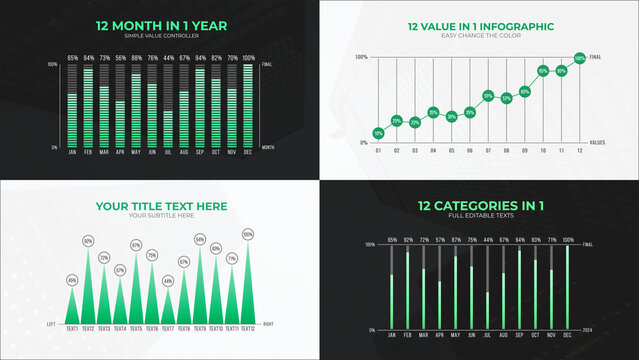
12 Value in 1 Infographic Charts
Abstract pie chart with 80 percent progress bar animation on green background . Pie chart business and finance visual data representation for sales and statistics .4k animated video .
00:09
ait Colorful Vertical Infographic Design template with six horizontal stripe elements
A stark blue bar chart shows decreasing quality, contrasted with the prominent red text 'COST' on a dark, smoky background.
00:08