設定密碼的連結已經傳送至: 日後若要存取您的購買項目,您將需要使用密碼。
免費試用即可取得 3 部影片或 25 張影像
已新增篩選器
排序方式:

在影片中找到 10,109 個「sequence chart」的結果

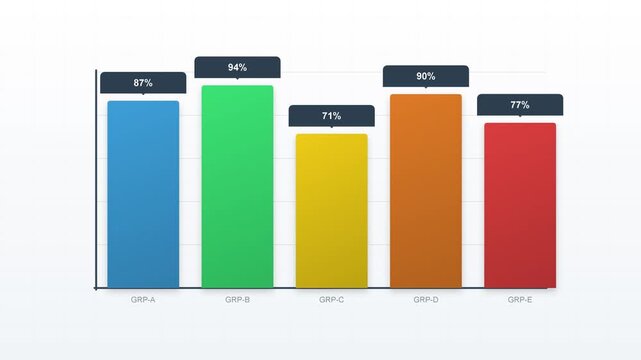
Dynamic motion of colorful bar chart animation illustrating data visualization trends in motion.
00:10
HD
Digital financial analytics display showing positive growth trajectory with fluctuating bar chart trends and data points in a modern software interface
00:08
HD
4K Animated Financial Bar Chart Growth with Colorful Columns on Dark Background
00:05
HD
Org Chart Hierarchy Tree Diagram Growing From Root With Nodes Lighting In Sequence, Seamless Loop in bright emerald tones
00:10
HD
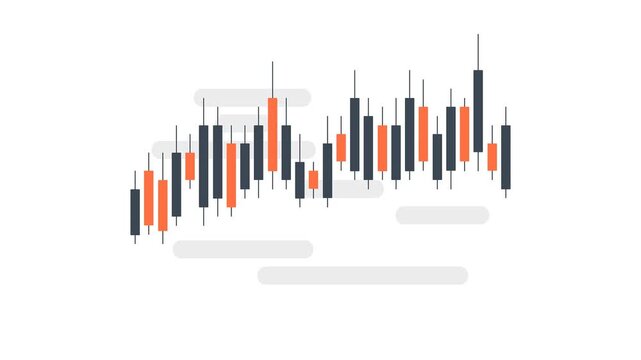
Animated stock market candlestick chart on white background showing financial data trading fluctuations. High quality motion graphics for business and investment concepts.
00:11
HD
Guidance infographic 3 steps template animation. Information screen. Sequence options 4k video. Animated blank diagram visualization. Process layout empty design element. Motion graphics
00:12
HD
Infographic showing business growth bar chart and target achievement
00:10
HD
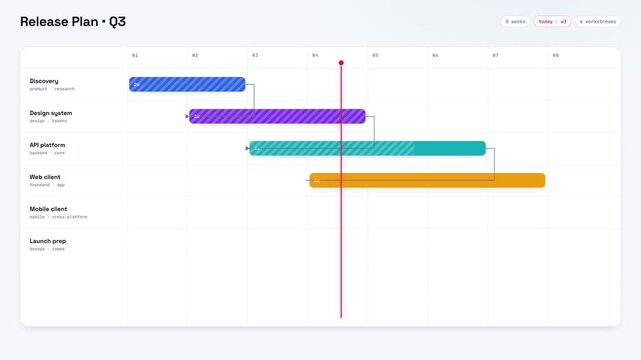
Modern light UI dashboard infographic displaying an animated software release plan Gantt chart with project management phases from discovery and design to API development and launch preparation
00:11
HD
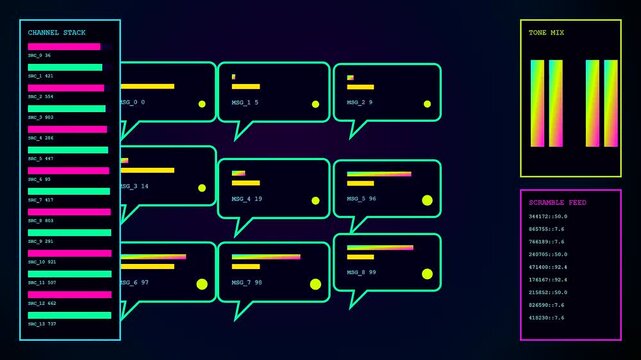
Digital displays showing sentiment analytics as dynamic graphic charts with glowing neon lines and colorful chat bubbles moving across three separate panels in a sequence
00:06
HD
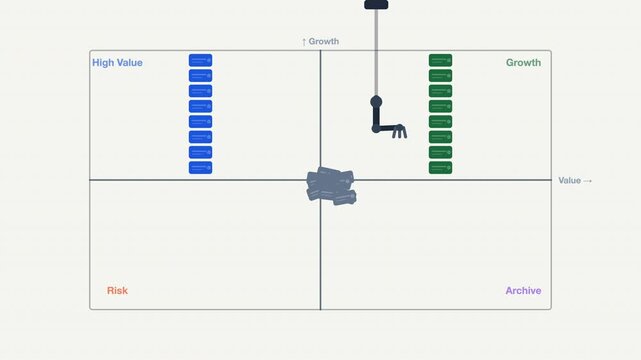
Blue and green blocks arranged in a quadrant chart layout with a mechanical arm motion sequence for analysis or industrial concepts. Suitable for tech or engineering designs.
00:09
HD
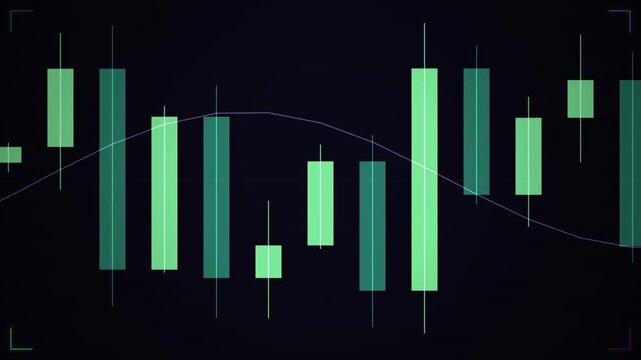
Digital candlestick chart with green bars and moving average line looping on a dark background.
00:15
HD
Scientists in a laboratory examine a sample vial while viewing dna sequence data and genetic charts on computer screens.
00:16
HD
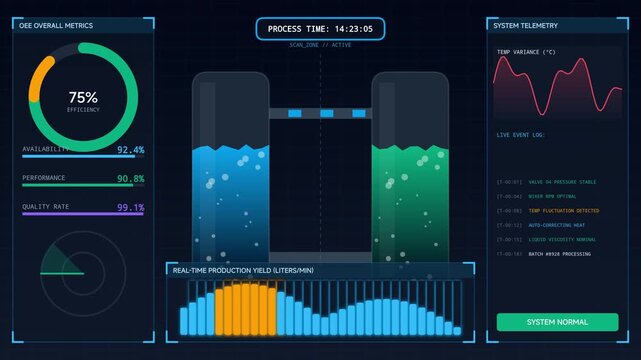
High-tech industrial dashboard interface displaying automated production metrics, chemical tank levels, and system analytics for smart factory monitoring
00:10
HD
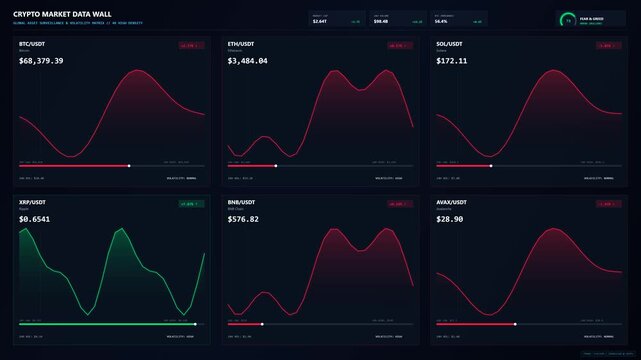
Multiple financial charts displaying real time market fluctuations
00:08
HD
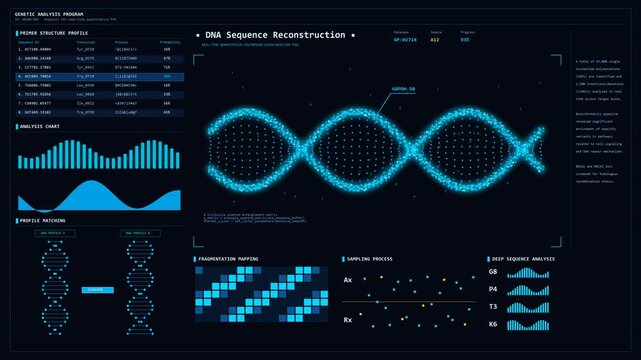
Bioinformatics HUD screen with 3D DNA sequence and PCR charts
00:24
HD
Colorful vertical bars progress across a black background illustrating data visualization gradient progression visualization graphic chart
00:10
HD
Digital bar graph chart animation displaying fluctuating blue and white vertical metrics representing statistical data growth in motion loop video footage
00:09
HD
Minimalist financial candlestick chart animation showing market fluctuations and trading data trends
00:07
HD
Bright white neon dollar signs arranged in a descending bar chart sequence on a solid black background representing financial loss and market decline
00:10
HD
Displaying vibrant engagement analytics dashboard screens showing line charts with rising neon arrows and changing numerical data values in a dark digital interface graphic style sequence
00:06
HD
The glowing chart loops continuously in a seamless pattern against a dark background.
00:30
HD
Pie chart infographic animated red circle segments forming target sequence 4k white background
00:10
HD
Digital displays showing cloud orchestration in a dynamic interface with moving bar graphs and glowing neon linear charts presented as a three part video sequence
00:06
HD
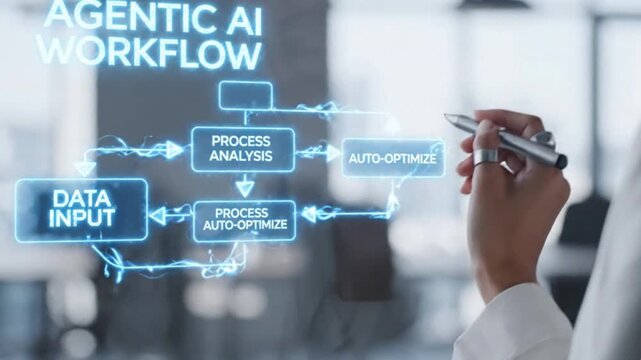
Agentic ai multi agent collaboration workflow diagram with data input process analysis and auto optimize concept for future technology modern office
00:08
HD
Blue bar chart growth animation displays neon columns on black. Bar chart graph marketing graphics include rising arrow icons. Growth animation sequence loops cleanly.
00:06
HD
Green signal bars rising in sequence across dark screen
00:05
HD
A sequence of frames showcasing a growing bar chart and upward-pointing arrow.
00:05
HD
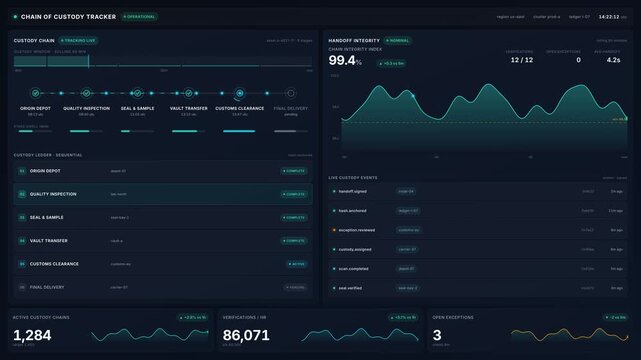
Chain custody tracker dashboard with supply chain monitoring, sequence verification, integrity index graphs, delivery logs for logistics asset tracking in 4k
00:20
HD
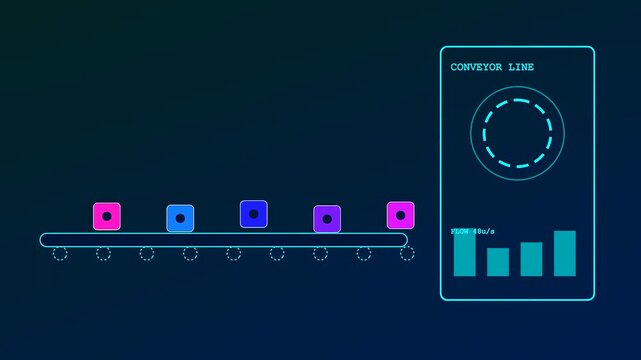
A modular assembly line flows with colorful cubes passing digital monitoring screens showing fluctuating bar charts in this smooth animated sequence of automated industrial logistics systems
00:06
HD
Dynamic bar chart growth sequence video.
00:15
HD
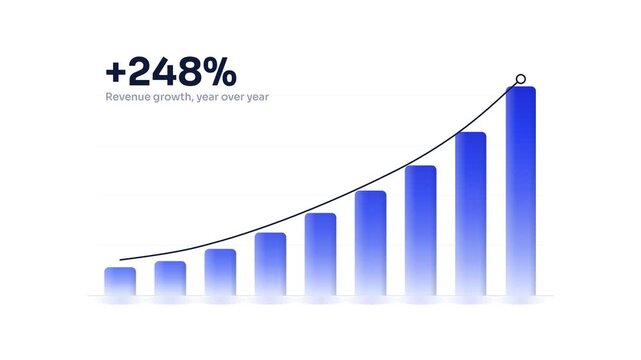
Animated bar chart sequence showing revenue growth rising from zero to 248 percent with blue gradient bars and upward trend line
00:10
HD
Seated man leaning forward after spotting blue pie chart on laptop while comparing papers at table
00:13
HD
Biotechnology DNA sequencing animation of rotating colorful double helix with glowing molecular bonds and scientific HUD data chart on dark background for genetics and bioinformatics research
00:15
HD
Stock market candlestick chart animation displays financial analytics. Market candlestick chart layout tracks corporate investment metrics. Chart sequence is sleek.
00:12
HD
Digital staffing allocation interface showing multiple colorful radar charts and data points on a dark screen as the glowing lines flicker in a rhythmic sequence
00:06
HD
Data updating causing green chart animating, markers peaking at 500, rising to 1000, showing trends
00:12
HD
A sequence showing metric telemetry data displays evolving in a dark digital space with glowing circular loading indicators and fluctuating vertical bar charts on screen
00:06
HD
Minimalist pink animated data graph chart loop for business analytics and financial presentations
00:10
HD
Infrastructure code scripting dashboard displays evolving system status updates across multiple server slots shown in a sequence of frames representing active digital network operations and monitoring
00:06
HD
Dynamic motion depicting increasing bar chart data visualization for business growth analysis in a modern digital environment.
00:10
HD
Row of Wooden Blocks Decreasing in Height Like a Descending Bar Chart, Business Decline and Economic Recession Concept
00:05
HD
Process Flow Diagram with Arrows and Boxes Minimal Icon. Work flow Chart Symbol with Connected Steps. Flowchart Icon with Directional Arrows and Blocks .4K Motion Graphics.
00:10
HD
Cloud orchestration interface displays data metrics with glowing neon charts and holographic circular monitors pulsing through sequence shifts in this dark digital system user portal view
00:06
HD
Isometric infographic template with four colorful database layers and numbered text boxes for business presentation workflow steps
00:08
HD
Domino effect with red 3D candlesticks toppling in a chain that forms a falling chart line
00:14
HD
Blue bar chart data statistics animation shows line dashboards. Bar chart electronic tracking layout features network grid frames. Data statistics sequence loops cleanly.
00:05
HD
Growing bar chart animation sequence for financial business data
00:10
HD
a colorful bioinformatics interface featuring rotating circular neural network models and evolving bar charts presented as a three part sequence in a digital software display
00:06
HD
Vitals monitoring interface displayed as a futuristic digital dashboard showing glowing data charts and temperature gauge metrics during a complex sequence of scientific computer analysis
00:06
HD
Colorful vertical bar chart loop against a dark reflective background.
00:30
HD
Metallic arrows rising in gold and teal forming bar chart on reflective base, AI-generated
00:05
HD
Three trend lines drawing in sequence for multi series comparison
00:12
HD
Animated bar chart showing data fluctuations on a digital interface for business analytics report
00:10
HD
Animated sequence of bar chart frames showcasing data evolution and growth metrics.
00:15
HD
Displaying a stream commerce digital interface showing network node data processing in a repetitive sequence of three similar motion graphic screens on dark background
00:06
HD
Animated bar chart sequence showcasing data evolution and growth metrics
00:15
HD
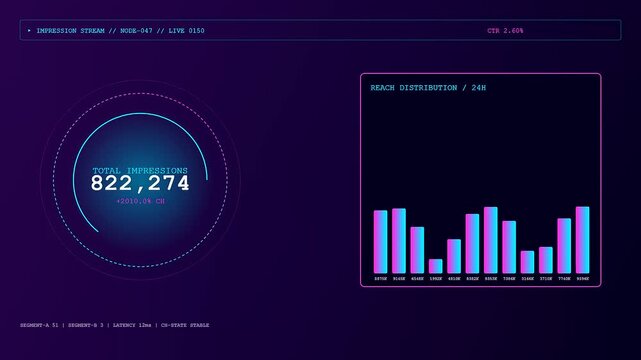
Digital impression data flows across a sequence of monitoring screens displaying glowing neon bar charts and metrics that illuminate the dark screen for analytic observation
00:06
HD
Strategic navigation glass bar chart blue growth data finance analysis rising column display for business planning and progress
00:05
HD
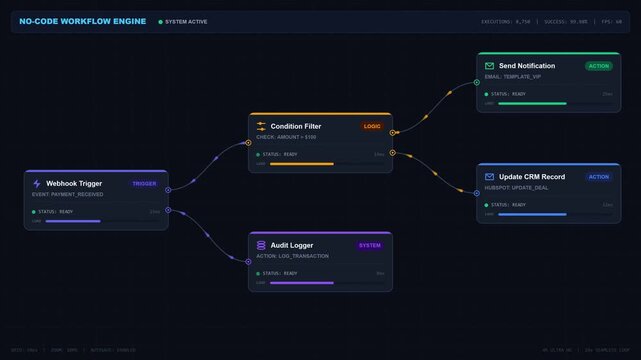
Automated workflow engine interface with digital logic flow and visual node programming builder
00:20
HD
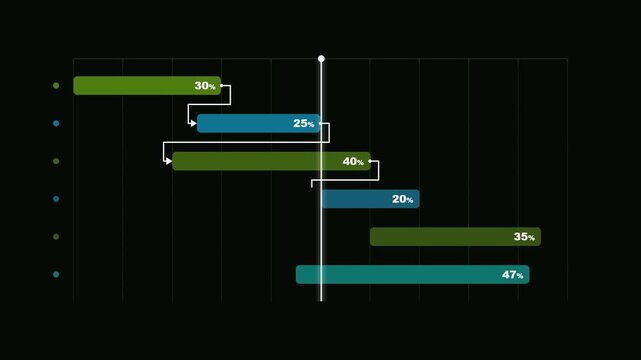
Olive and teal gantt chart with dependency arrows linking tasks
00:10
HD
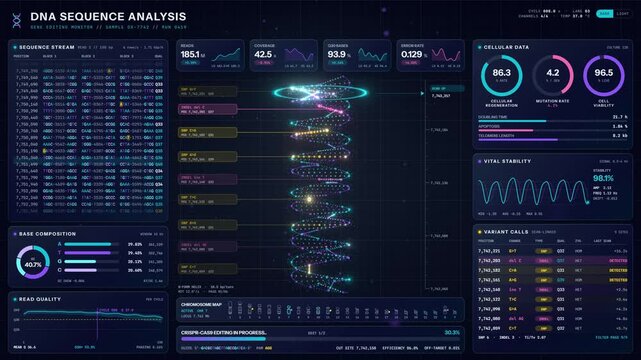
Futuristic DNA sequence analysis user interface with data charts
00:20
HD
Animated colorful bar chart displaying statistical data growth
00:10
HD
Animated 4 step infographic process timeline design. 4K Video
00:10
HD
Rising bar chart and upward arrow revealed in a business graphic. Increasing columns illustrate growth, improved performance and financial progress through a clear ascending visual sequence.
00:12
HD
Animated bar chart with glowing gradient columns filling upward in ascending growth sequence
00:15
HD
Blue bar chart growth animation displays neon columns on black. Bar chart graph marketing graphics include rising arrow icons. Growth animation sequence loops cleanly.
00:06
HD
A sequence showing probability modeling metrics changing in three distinct analytical phases with glowing neon curves and bar charts inside a dark digital display system interface
00:06
HD
A digital dmx controller display interface showing shifting waveform patterns plus oscillating sound bar charts in a continuous looping motion sequence across a darkened computer monitor
00:06
HD
Dynamic glowing blue bar graph animation sequence with grid background for data visualization
00:07
HD
Animated five step timeline infographic with light blue circles and teal line on white background for business project presentation
00:10
HD
Laptop receiving business metrics input and generating 3D bar chart line graphs arrow code panel
00:10
HD
Dynamic candlestick chart sequence video frame.
00:10
HD
A digital vitals monitoring display screen shows changing thermal bar charts and fluctuating numeric sensor levels in a glowing sequence of three separate color cycles
00:06
HD
Progressive bar chart growth with upward arrow on black background
00:10
HD
Neon virtual showroom interface elements displayed on a digital grid monitor showing colorful waveform graphs and clock faces with analytical bar charts for monitoring system metrics
00:06
HD
Modern data visualization bar chart with fluctuating trends
00:10
HD
Digital servers telemetry monitoring interface with neon glowing bar charts and circular data nodes showing abstract network traffic patterns in a dark fluid motion sequence
00:06
HD
Minimalist diagonal line chart with glowing blue nodes on a dark background
00:10
HD
Minimalist black and white bar graph animation sequence
00:06
HD
Vertical sequence of green arrows pointing upwards on a black background representing growth progress success and upward movement in data charts
00:10
HD
A digital diploma screen showing dynamic neon wave patterns and data bar charts in a glowing futuristic interface presented within a three panel video sequence
00:06
HD
Dynamic motion of colorful bar chart visualization in digital data analysis video.
00:10
HD
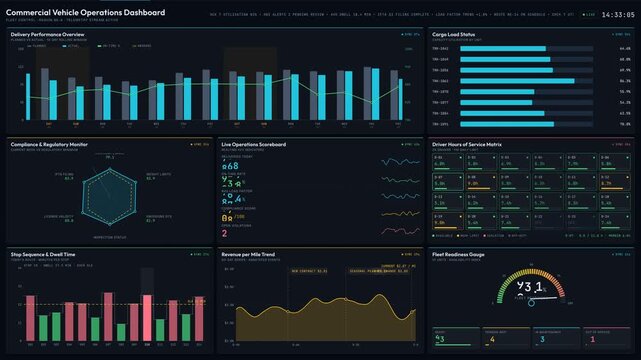
Explore a detailed commercial vehicle operations dashboard featuring a vibrant, information-rich interface with animated charts and KPIs for efficient fleet management and monitoring.
00:15
HD
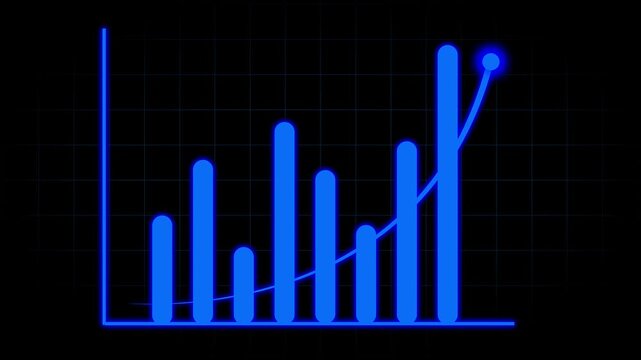
Glowing cyan bar chart rising. Animated 3D financial growth graph on dark background.
00:05
HD
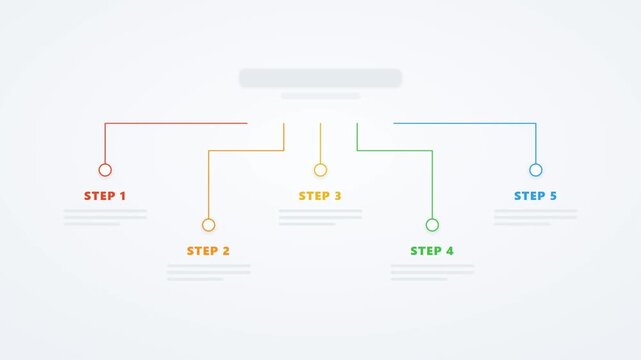
Five step process infographic with animated connecting lines and options presentation template
00:05
HD
Blue bar chart data statistics animation shows line dashboards. Bar chart electronic tracking layout features network grid frames. Data statistics sequence loops cleanly.
00:05
HD
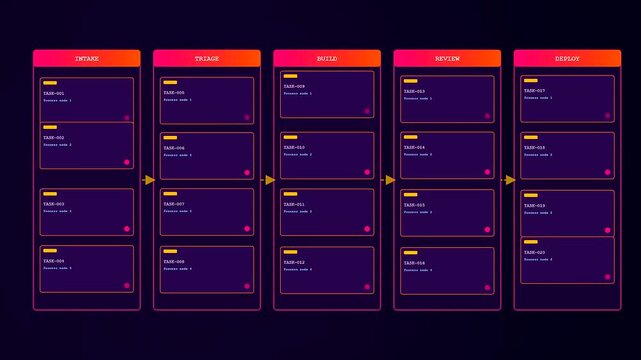
A digital workflow map displaying complex administrative task progression in multiple sections with illuminated rectangular frames and neon glowing accents against a deep dark purple environment
00:06
HD
a colorful skill matrix is displayed across three glowing panels showing a digital pyramid chart with dynamic audio bars and wave patterns in dark space
00:06
HD
Financial candlestick chart showing stock market price movement
00:08
HD
A digital display featuring crisp genome editing software shows neon glowing gene sequences and colorful data charts to visualize complex molecular biology research through screen interfaces
00:06
HD
Blue hexagon infographic 3 steps template animation, sequence options HD video, process layout empty design element, animated blank diagram visualization motion graphics on transparent background
00:08
HD
Dynamic animated blue cyan bar chart sequence, symbolizing financial growth, data analysis and progress.
00:20
HD
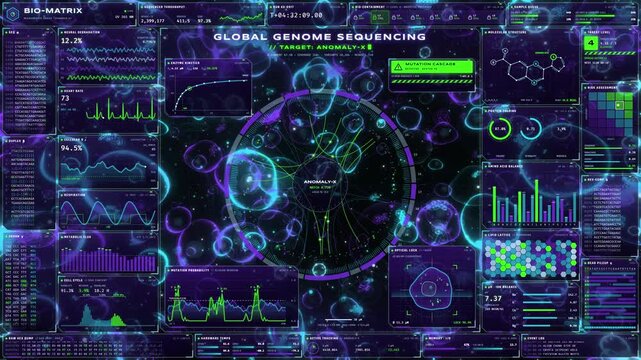
Futuristic bio matrix user interface with genome sequencing charts
00:20
HD
Fiery Phoenix rising from ethereal flames, symbolizing rebirth, transformation, and resilience in dynamic video sequence
00:07
HD
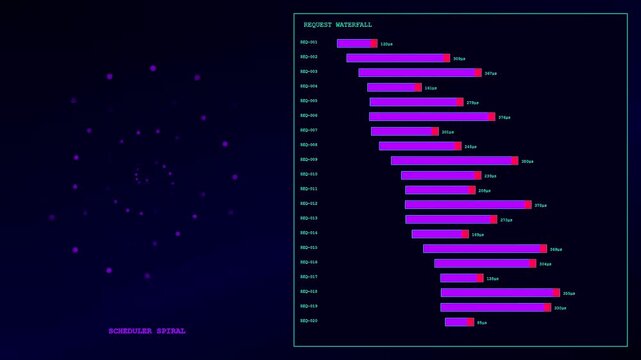
Monitoring system analytics with compute latency metrics presented in a dynamic glowing spiral interface with scrolling horizontal bar charts during a digital data processing sequence
00:06
HD
At sequence start design team reviewing blueprints, chart overlays fading in, driving decision
00:12
HD
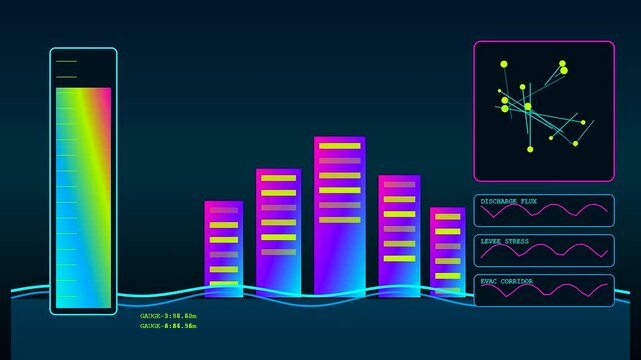
Digital catastrophe mapping displays showing changing urban flow metrics and rising water gauges as fluctuating wave patterns shift across dark blue interface screens in motion sequence
00:06
HD
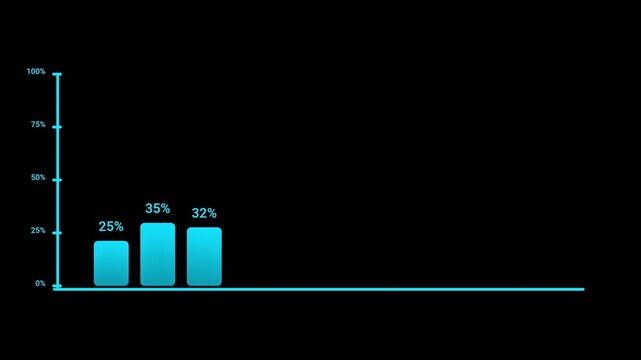
Animated bar chart showing fluctuating data over months on black background
00:15
HD
loading icon animation green color 74% circle. dark cyan color storage pie chart on dark black background.
00:12
HD
Futuristic AI system logs UI overlay displaying data diagnostics and boot sequence motion graphic
00:06
HD