販售
價格
設定密碼的連結已經傳送至:
日後若要存取您的購買項目,您將需要使用密碼。
全部
影像
影片
音訊
範本
3D
免費
進階
尋找類似內容:
系列:
模型:
文件:
我的資料庫
尋找類似內容。
將影像拖曳至此處
或
瀏覽
正在上傳您的影像…
創作無極限 — 無限下載內容,並使用強大 AI 編輯功能
開始免費試用
免費試用即可取得 3 部影片或 25 張影像
開始免費試用
隱藏面板
檢視面板
已新增篩選器
排序方式:
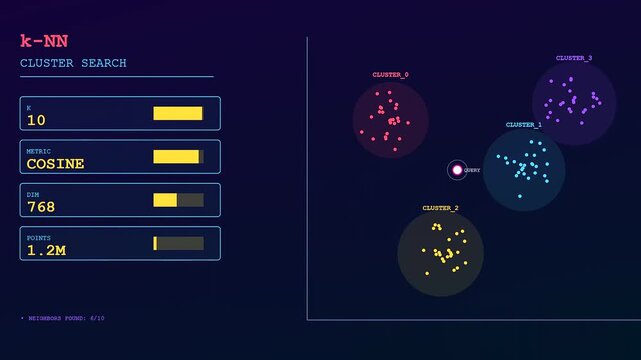
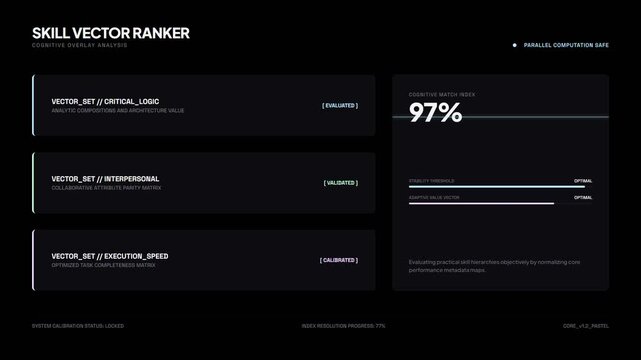
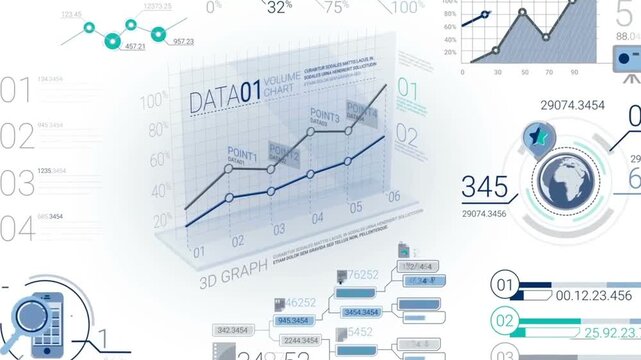
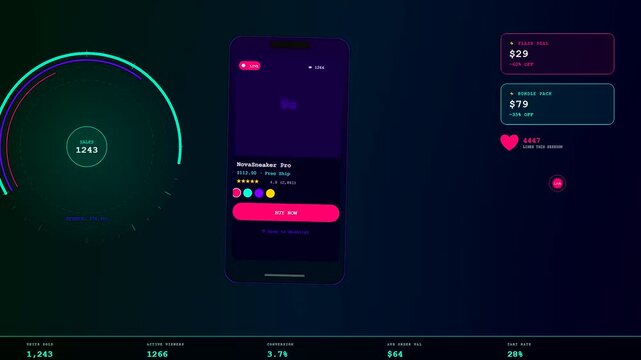
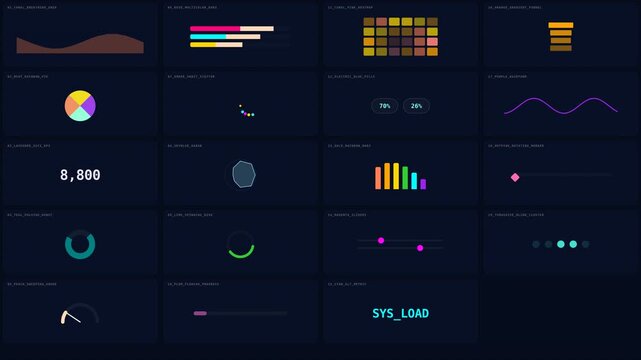
在影片中找到 2,430 個「
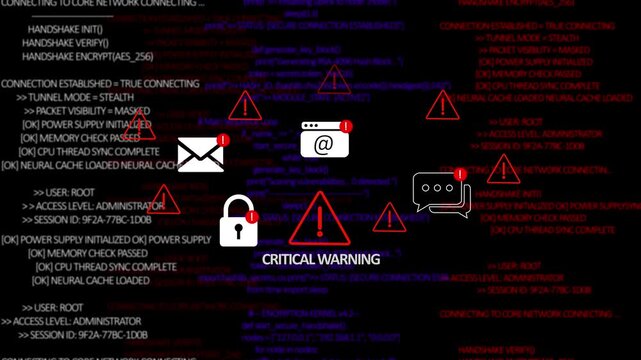
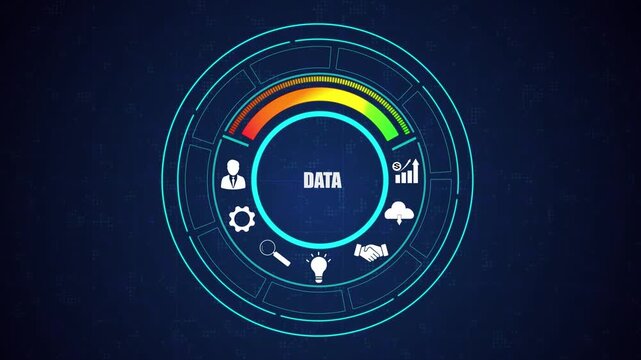
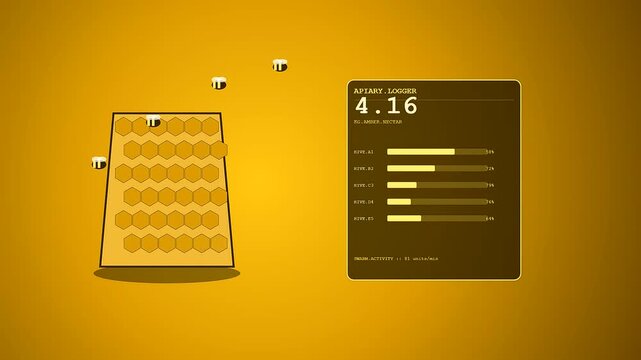
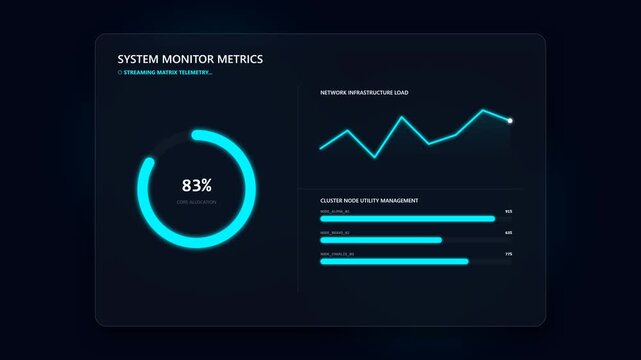
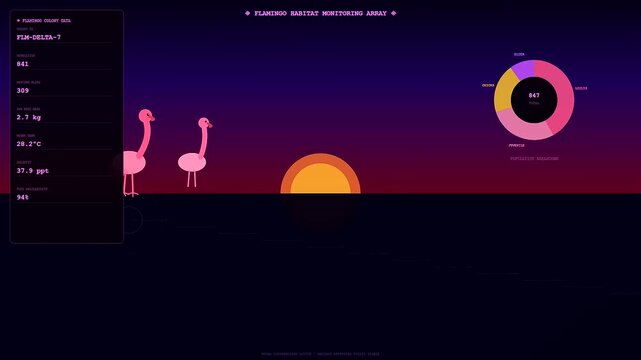
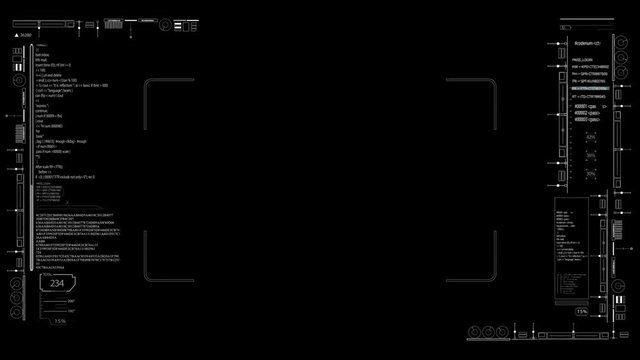
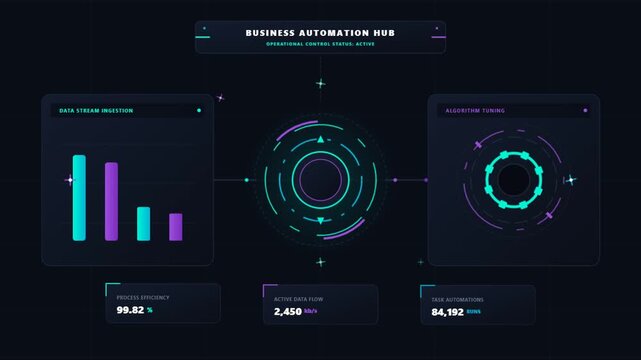
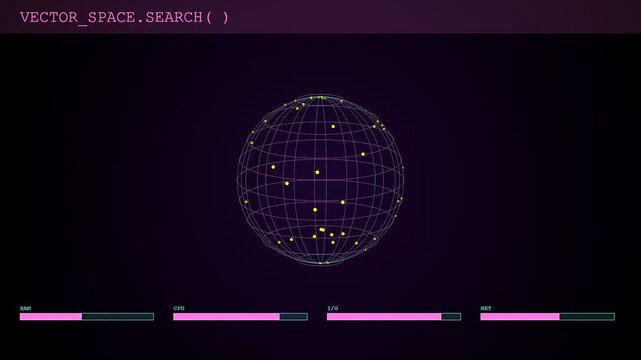
interface statistic vector
」的結果
00:10
4K
HD
00:15
4K
HD
00:10
4K
HD
00:06
4K
HD
00:08
4K
HD
00:12
4K
HD
00:06
4K
HD
00:06
4K
HD
00:06
4K
HD
00:10
4K
HD
00:15
4K
HD
00:19
4K
HD
00:11
4K
HD
00:14
4K
HD
00:08
4K
HD
00:15
4K
HD
00:05
4K
HD
00:05
4K
HD
00:13
4K
HD
00:07
4K
HD
00:10
4K
HD
00:10
4K
HD
00:15
4K
HD
00:06
4K
HD
00:10
4K
HD
00:15
4K
HD
00:06
4K
HD
00:06
4K
HD
00:06
4K
HD
00:06
4K
HD
00:05
4K
HD
00:10
4K
HD
00:15
4K
HD
00:14
4K
HD
00:08
4K
HD
00:05
4K
HD
00:14
4K
HD
00:24
4K
HD
00:10
4K
HD
00:15
4K
HD
00:10
4K
HD
00:08
4K
HD
00:06
4K
HD
00:06
4K
HD
00:08
4K
HD
00:12
4K
HD
00:06
4K
HD
00:06
4K
HD
00:06
4K
HD
00:06
4K
HD
00:12
4K
HD
00:10
4K
HD
00:10
4K
HD
00:14
4K
HD
00:10
4K
HD
00:15
4K
HD
00:05
4K
HD
00:06
4K
HD
00:06
4K
HD
00:10
4K
HD
00:10
4K
HD
00:15
4K
HD
00:10
4K
HD
00:06
4K
HD
00:08
4K
HD
00:10
4K
HD
00:06
4K
HD
00:06
4K
HD
00:06
4K
HD
00:06
4K
HD
00:20
4K
HD
00:10
4K
HD
00:15
4K
HD
00:10
4K
HD
00:10
4K
HD
00:10
4K
HD
00:13
4K
HD
00:06
4K
HD
00:06
4K
HD
00:08
4K
HD
00:10
4K
HD
00:16
4K
HD
00:10
4K
HD
00:06
4K
HD
00:06
4K
HD
00:20
4K
HD
00:06
4K
HD
00:06
4K
HD
00:06
4K
HD
00:06
4K
HD
00:18
4K
HD
00:09
4K
HD
00:08
4K
HD
00:20
4K
HD
00:05
4K
HD
00:10
4K
HD
00:14
4K
HD
00:06
4K
HD
00:06
4K
HD
00:10
4K
HD
確定
確定
確定
選擇區域
選取區域後,Adobe Stock 網站上顯示的語言和宣傳內容可能會有所改變。
北美洲
Canada - English
Canada - Français
El Salvador
México
República Dominicana
United States
南美洲
Argentina
Bahamas
Barbados
Bolivia
Brasil
Chile
Colombia
Costa Rica
Ecuador
Guatemala
Honduras
Jamaica
Nicaragua - English
Panamá
Paraguay
Perú
Trinidad and Tobago
Uruguay
Venezuela
歐洲、中東及非洲
Algeria - English
Armenia - English
Azerbaijan - English
Bahrain - English
Belgium - English
Belgique - Français
België - Nederlands
Česká republika
Croatia - English
Cyprus - English
Danmark
Georgia - English
Deutschland
Eesti
Egypt - English
España
France
Greece - English
Iceland - English
Ireland
Israel - English
Italia
Jordan - English
Казахстан
Kenya - English
Kuwait - English
Киргизия
Latvija
Lebanon - English
Lietuva
Luxembourg - Deutsch
Luxembourg - English
Luxembourg - Français
Mauritius - English
Moldova - English
Hungary - English
Malta - English
Morocco - English
Nederland
Nigeria
Norge
Oman - English
Österreich
Россия
Polska
Portugal
Qatar - English
România
Saudi Arabia - English
Schweiz
Slovenija
Slovensko
Suisse
Suomi
Sverige
Svizzera
Таджикистан
Turkey - English
Turkmenistan - English
UAE - English
Україна
United Kingdom
Узбекистан
България
亞太地區
Australia
Indonesia - English
中國香港特別行政區
India
日本
한국
中華人民共和國澳門特別行政區
Malaysia - English
New Zealand
ไทย
Philippines
Singapore
Sri Lanka - English
台灣地區
Vietnam - English