設定密碼的連結已經傳送至: 日後若要存取您的購買項目,您將需要使用密碼。
免費試用即可取得 3 部影片或 25 張影像
已新增篩選器
排序方式:

在影片中找到 19,819 個「increase and decrease」的結果

A futuristic scene featuring a human hand and a robotic arm interacting with a cost graph showing a downward trend over a globe, symbolizing technology impact on business. Synapse
00:13
HD
Financial stock market chart showing downward price trend
00:08
HD
Stock index chart moves up and down, market data, trading, financial figures. Business, investment, risk, chance, graph, making money.
00:12
HD
Zoom in and out animation the wallet symbol. Large black symbol in the center and four small symbols around. Seamless looped 4k animation on white background
00:12
HD
Candlestick chart showing financial market data with an upward trend on a dark background.
00:10
HD
Clean Carbon Reduction Tracker Dashboard with Descending Emissions Steps and Green Energy Growth
00:05
HD
Twenty Percent Word Cloud
00:11
HD
Financial analysis displaying an upward trend, indicating potential market recovery and economic expansion, with concepts of decrease, risk, and data management for business success
00:17
HD
success level indicator scale. Low normal & high meter infographic animation. Showing high success level color gauge indicator. on a black background 4k animation video
00:10
HD
Abstract financial chart with falling bars downward market trend and low performance with grid and world map details animation
00:10
HD
Close-up of hands typing on laptop. Digital arrow points downward with 'COST %' text. Shows focus on budgeting or financial reduction. Ideal for business, finance
00:10
HD
Pan right along a wire mesh fence covered with lush green foliage (unidentified species) in a subtropical garden on a sunny day. Motifs of reduced visibility, mazelike abundance, looking for an exit.
00:26
HD
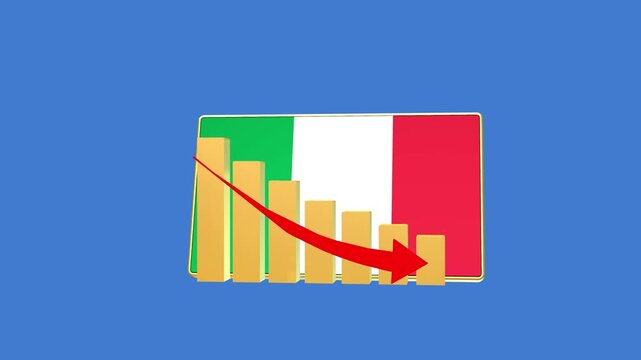
Italy economic bar chart graph showing decreasing downturn with national Flag 3D animation on black background.
00:16
HD
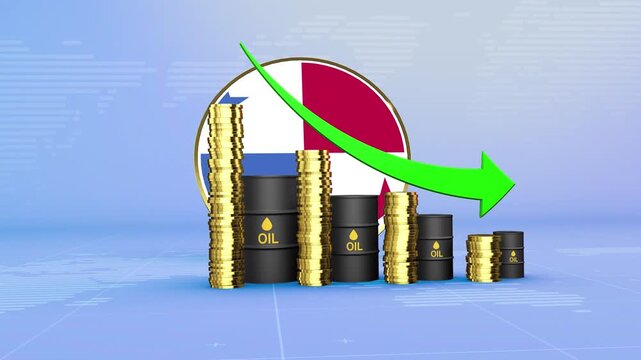
Panama Oil Prices Decline with Oil Barrels, Gold Coins and Downward Green Arrow, 3D Economic and Financial Market Concept
00:11
HD
Business professional using laptop with holographic cost reduction graph and bars. Concept of financial efficiency, budget cutting, expense management, and corporate profit optimization.
00:10
HD
Ireland Oil Price Falling with Oil Barrels Downward Green Arrow and 3D Financial Data Visualization Graphs for Economy and Business Concept
00:11
HD
Animated orange curved statistical graph line with smooth motion and transparent background for video.
00:05
HD
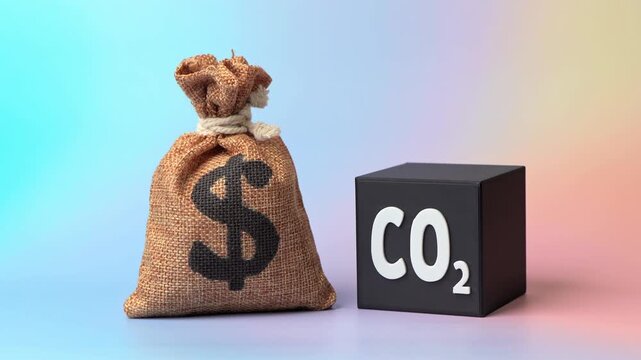
A CO2 cube and a dollar money bag. Recycling grants. Reducing environmental impact while generating income. Increase in the cost of emission quotas for enterprises. Waste recycling
00:14
HD
A numeric counter with plus and minus controls on black, useful for quantity selection concepts, value changes, and animated number graphics.
00:10
HD
Video with the phrase Sell More Today in Spanish, animated word by word with letter spacing reduction and sharp zoom transitions, delivered in four background and outline versions.
00:12
HD
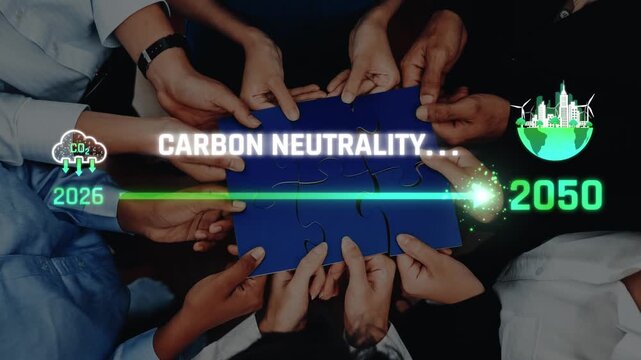
A visual representation of diverse hands coming together to symbolize the united effort required to achieve carbon neutrality by 2050. A timeline from 2026 to 2050 highlights important goals. Raster
00:15
HD
Red Handwritten Negative Dollar Counter Animation Showing Financial Loss And Debt Increase
01:00
HD
fitness level level indicator scale. Low normal high meter infographic animation on black background. Showing high pressure level color gauge indicator.4k quality animation video
00:10
HD
Futuristic dollar countdown timer animation, glowing dollar symbol integrated with a circular countdown display, numbers decreasing smoothly from 0 to 200
00:10
HD
An electronic monitor showcasing low financial growth trends and negative returns for corporate market analysis presentations
00:15
HD
Probability level indicator scale. Low Normal High meter infographic animation on black background. Animation showing high probability level color gauge indicator for statistical analysis and outcome.
00:10
HD
Structural Battery Pack Word Cloud
00:11
HD
Lean production process diagram depicting manufacturing industry automation, smart factory managing product delivery, with efficiency and waste reduction
00:17
HD
radiation level indicator scale. Low normal & high meter infographic animation. Showing high radiation level color gauge indicator. on a white background 4k animation video
00:10
HD
Mobile Network Signal Strength Animation
00:05
HD
Lean thinking concept. Cost reduction concept. Business process improvement. Maximising productivity and quality, reducing time and cost. Cost cutting, lean process for surviving the recession.
00:10
HD
Green animated bar graph chart business finance growth success presentation 4k loop. Animated business green bar graph chart data infographic economic trend 4k seamless.
00:11
HD
Close-up stock market trading screen with market data, trading volume, prices and percentage changes. Investment strategy, analyzing, data spreadsheet, financial figures, trading board, exchange infor
00:10
HD
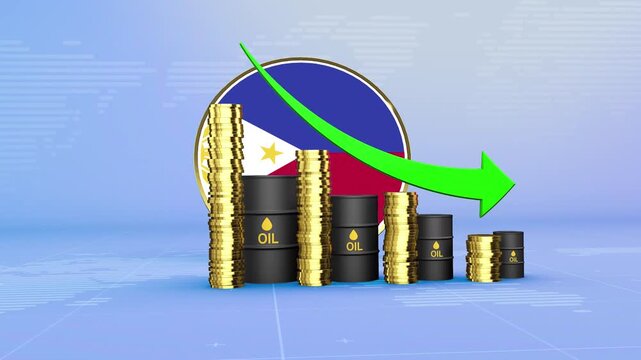
Philippines Oil Prices Decline with Oil Barrels, Gold Coins and Downward Green Arrow, 3D Economic and Financial Market Concept
00:11
HD
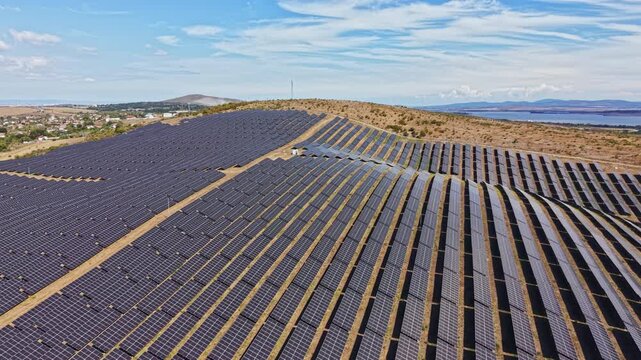
Large fields of solar panels are arranged on a hillside, reflecting sunlight under a clear blue sky. The location supports green energy efforts in a rural setting.
00:17
HD
lose-up of a screen displaying measurable results: 38 percent focus improvement and 42 percent stress reduction. The data proves the apps effectiveness. Perfect for wellness technology, and health
00:10
HD
Glowing neon line House under protection icon with up arrow isolated on black background. a glowing light drawing a neon outline of houses decreasing in size. House, home building. 4K animation Video.
00:10
HD
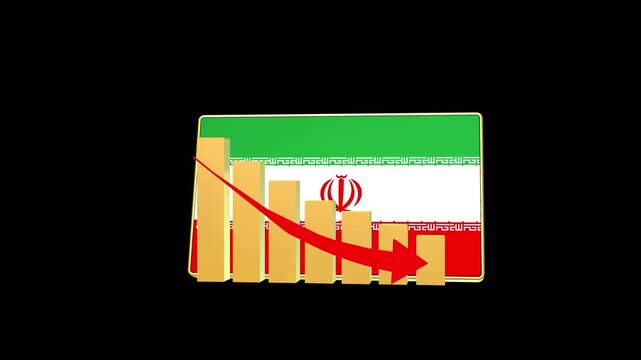
Iran economic bar chart graph showing decreasing downturn with national Flag 3D animation on black background.
00:16
HD
Kyrgyzstan Oil Price Falling with Oil Barrels Downward Green Arrow and 3D Financial Data Visualization Graphs for Economy and Business Concept
00:11
HD
Three word kinetic typography sequence displaying Convert With Ads with sequential letter spacing reduction and sharp zoom transition
00:12
HD
Net zero goals and CO2 reduction strategy driving sustainability, green energy integration, net zero emissions policies, and climate-friendly sustainability solutions for business and society. Muxer
00:12
HD
radiation level indicator scale. Low normal & high meter infographic animation. Showing high radiation level color gauge indicator. on a black background 4k animation video
00:10
HD
Quality control and company cost reduction. Successful organization strategy and management. cost reduction and improving quality. Money loss icon
00:10
HD
Abstract financial chart with falling bars downward market trend and low performance with grid and world map details animation
00:10
HD
Neon blue outline of a person standing by a screen with up and down arrows indicating progress icon
00:08
HD
Immunity level indicator scale. Low Normal High meter infographic animation on black background. Showing high immunity level color gauge indicator for health monitoring and wellness.
00:10
HD
Shared Parking Agreements Word Cloud
00:11
HD
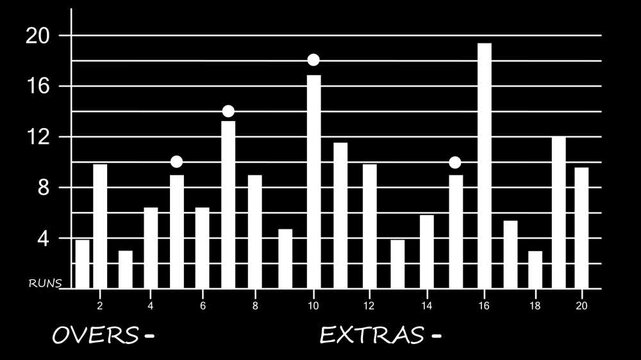
Animated Cricket Match Runs Per Over Bar Chart Showing Scoring Performance
00:10
HD
Churn Rate Percentage Decrease Animation on Green Screen Background.
00:06
HD
Cryptocurrency trading. Bitcoin stock graphic. Bitcoin mining and Finance banking management concept, oil and Money trading, Digital trade platform. Profit and loss graph. Online trading
00:13
HD
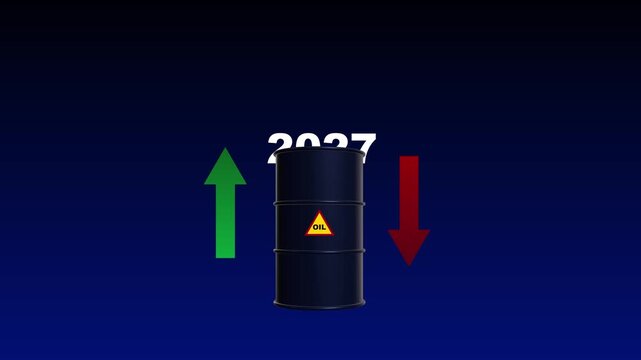
2027 Oil Market Outlook Showing Uncertain Price Movement, With Conflicting Upward and Downward Signals Reflecting Market Volatility, Energy Demand, and Investment Risk
00:10
HD
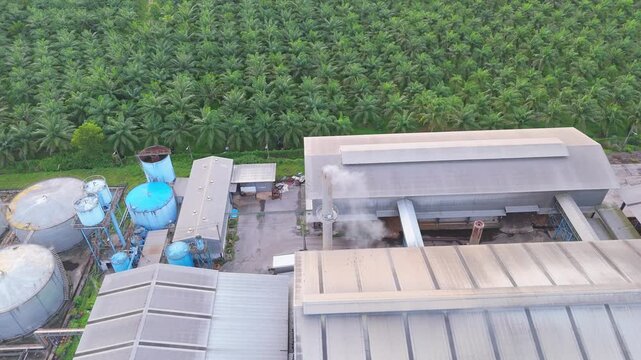
Aerial view clean air with exhaust pipe for air pollution reduction. Economic growth, industrial energy, Environment, and sustainability. Business and technology development nature. Factory Palm oil
00:12
HD
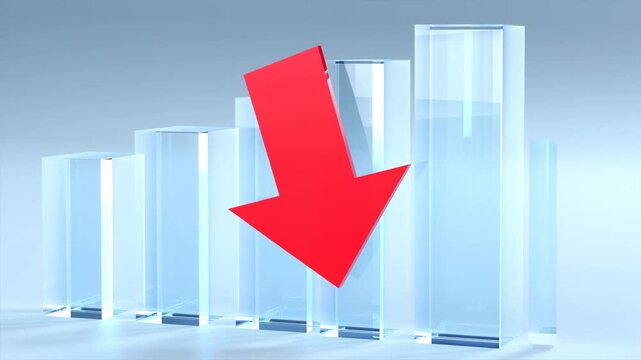
Red Arrow Pointing Down in Front of Glass Bar Chart Showing Financial Decline
00:05
HD
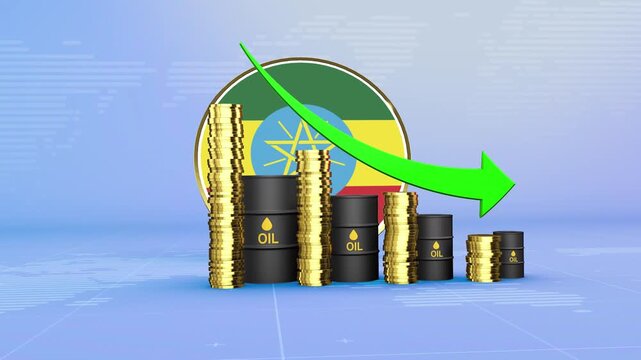
Ethiopia Oil Prices Decline with Oil Barrels, Gold Coins and Downward Green Arrow, 3D Economic and Financial Market Concept
00:11
HD
Lean thinking concept. Cost reduction concept. Business process improvement. Maximising productivity and quality, reducing time and cost. Cost cutting, lean process for surviving the recession.
00:10
HD
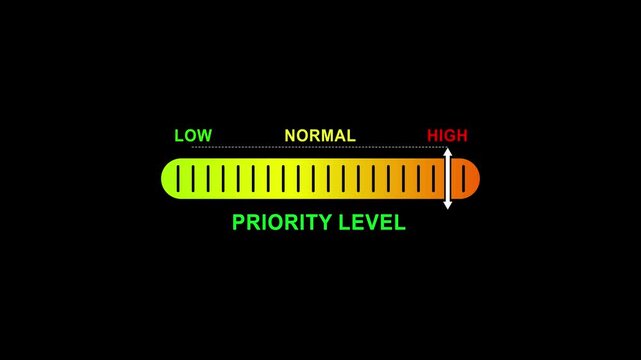
priority level indicator scale. Low normal high meter infographic animation on black background. Showing high pressure level color gauge indicator.4k quality animation video
00:10
HD
Minimalist black arrow pointing downwards on a clean white background in motion graphics.
00:10
HD
Quality control and company cost reduction. Successful organization strategy and management. motion graphic of Successful organization strategy concept.
00:10
HD
Belarus Crude Oil Price Drop with Oil Barrels Downward Green Arrow and 3D Financial Data Visualization Graphs for Economy and Business Concept
00:11
HD
Three-word text animation featuring Improve Your Workflow with sequential word reveal, spacing reduction effect, and zoom transition in 3840x2160 format.
00:12
HD
Hands Collaborating Around AI Symbol with Quality and Cost Graphs to Illustrate Technology Benefits in Business Progress and Innovation Strategies Sigmoid
00:15
HD
satureated fat level indicator scale. Low normal & high meter infographic animation. Showing high atureated fat level color gauge indicator. on a black background 4k animation video
00:10
HD
Quality control and company cost reduction. Successful organization strategy and management. cost reduction and improving quality. Money loss icon
00:10
HD
Revenue and Profit Growth Animation for Corporate Business Reports
00:08
HD
Zoom in and out animation the notification symbol. Large black symbol in the center and four small symbols around. Seamless looped 4k animation on white background
00:12
HD
Arrow graphics showing progression and expansion across a blue background with black dividers
00:05
HD
Dynamic Checkout Word Cloud
00:11
HD
porson level indicator scale. Low normal & high meter infographic animation. Showing high porson level color gauge indicator. on a black background 4k animation video
00:10
HD
Losses On Colourful Tachometer Animation 2d Animation with Alpha Matte
00:16
HD
Animated business graph chart showing rising financial growth, glowing profit increase, and upward sales arrow on green background representing future business success and expansion
00:17
HD
Customer satisfaction level indicator scale. Low normal & high meter infographic animation on black background. Showing high level color gauge indicator for business service quality and experience.
00:10
HD
Bar Chart and Line Chart Down Graph
00:08
HD
Abstract glowing neon swipe arrow. 4k animation. Down to up neon line arrow direction animation. Neon line raising business arrow on black background.on black backgraund .HD video animation.
00:10
HD
New Zealand Oil Prices Decline with Oil Barrels, Gold Coins and Downward Green Arrow, 3D Economic and Financial Market Concept
00:11
HD
Increasing counting number 0 to 100k for price like views figures or amount concepts .4k motion graphics video animation
00:10
HD
Abstract organic shapes growing in size against a blue background with cinematic motion
00:05
HD
Financial operations with currency exchange and banking fees, optimizing capital for cost reduction and efficient money payments within global economic transactions
00:17
HD
Outline bar chart animation reveals downward falling fiscal columns. Financial economic loss reflects across the outline bar chart. Negative corporate investment data marks the bar chart.
00:12
HD
Senegal Oil Price Falling with Oil Barrels Downward Green Arrow and 3D Financial Data Visualization Graphs for Economy and Business Concept
00:11
HD
Three word kinetic typography sequence displaying Trust That Converts with sequential letter spacing reduction and sharp zoom transition
00:12
HD
A businessman interacts with a smartphone while colorful neon arrows represent quality and cost factors, illustrating investment and economic strategies in a professional context. Qubit
00:11
HD
trigl ycerides level indicator scale. Low normal & high meter infographic animation. Showing high triglycrides level color gauge indicator. on a black background 4k animation video
00:10
HD
Animation showing downward blue arrow over bar graph indicating financial decline
00:14
HD
Graph Going Up Rising Bar Graph, Business Growth Graph Green Screen Background. 4K Resolution
00:06
HD
"50% Symbol in Bold with Blue Background
00:10
HD
55 percent discount. Gold text on transparent background. ProRes 4444
00:05
HD
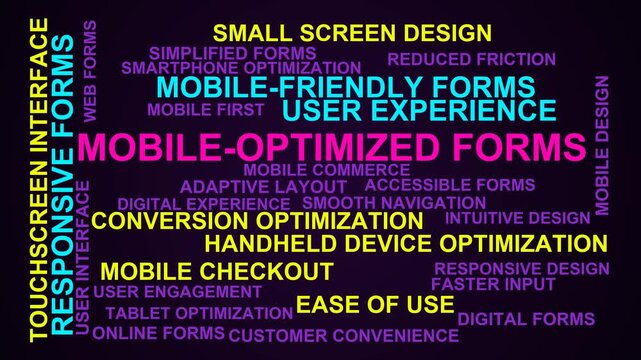
Mobile-Optimized Forms Word Cloud
00:11
HD
Animated bar chart graphic with green screen background for easy compositing.
00:10
HD
Opening scene showing charging icon and Eco leaf displaying battery filling then reversing levels
00:10
HD
energy level indicator scale. Low normal & high meter infographic animation. Showing high energy level color gauge indicator. on a black background 4k animation video
00:10
HD
Probability level indicator scale. Low Normal High meter infographic animation on black background. Animation showing high probability level color gauge indicator for statistical analysis and outcome.
00:10
HD
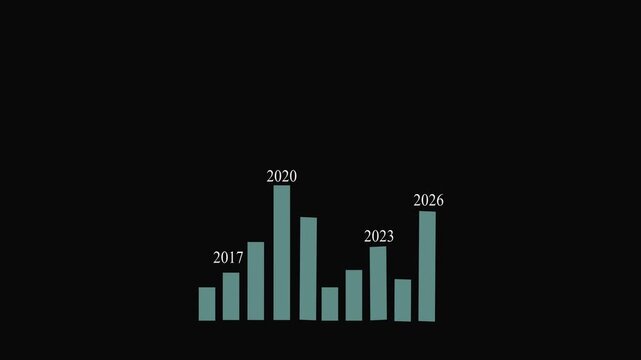
Teal bar graph showing data trends from 2017 to 2023. Annual teal bar graph showing data trends for economic reporting files. Professional teal bar graph showing data trends on black background.
00:06
HD
Financial dashboard animation showing a downward trend with graphs and charts, indicating a stock market crash, economic recession, business failure, and financial crisis on a futuristic interface
00:10
HD
Botswana Oil Prices Decline with Oil Barrels, Gold Coins and Downward Green Arrow, 3D Economic and Financial Market Concept
00:11
HD
internet speed Meter Animation.Measuring internet speed from Low to High Levels.Increasing and Decreasing Gauge from low to high Levels, Comparison Indicator for Data Visualization, perfomance
00:10
HD
Animated bar graph shows upward trend with downward arrow signal indicating warning
00:10
HD
Thirteen percent interest rate digital display glowing on black background financial concept
00:10
HD
Glowing blue neon continuous line forming up and down arrows isolated on black background, perfect for finance, trade, and data exchange concept.
00:10
HD
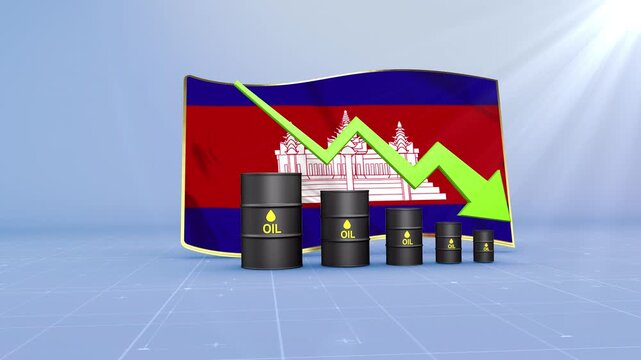
Cambodia Crude Oil Price Drop with Oil Barrels Downward Green Arrow and 3D Financial Data Visualization Graphs for Economy and Business Concept
00:11
HD
animated market diagram with vivid green graphics, detailed visualization of trading data, crypto movements, and profit margins.
00:10
HD