設定密碼的連結已經傳送至: 日後若要存取您的購買項目,您將需要使用密碼。
免費試用即可取得 3 部影片或 25 張影像
已新增篩選器
排序方式:

在影片中找到 19,816 個「increase and decrease」的結果

Digital Graph Animation Abstract Motion Data Visualization
00:10
HD
Zoom in and out animation the exploding party popper symbol. Large black symbol in the center and four small symbols around. Seamless looped 4k animation on white background
00:12
HD
Appetite changes impacting a person, showing an upward arrow for increased hunger and a downward arrow with a stop sign for decreased desire to eat, depicting health conditions
00:17
HD
Medium shot of vibrant algae cultivation tanks representing sustainable biofuel production for cleaner shipping emissions and reduced carbon footprint.
00:06
HD
Performance level indicator scale. Low normal & high meter infographic animation on bblackbackground. Showing high performance level color gauge indicator for business productivity efficiency and work
00:10
HD
Self drawing line animation Low and high percent down and growth gdp interest rate sign continuous one single line drawn concept video
00:10
HD
Horizontal 4K animation with vertical Portuguese text appearing word by word using spacing reduction, sharp zoom transitions, circular loop rotation, and black and white background versions.
00:12
HD
Liechtenstein Oil Price Falling with Oil Barrels Downward Green Arrow and 3D Financial Data Visualization Graphs for Economy and Business Concept
00:11
HD
Business executives collaborating on environmental sustainability strategy utilizing renewable energy solutions to achieve net zero targets in corporate meeting.
00:12
HD
Neon blue line graph showing cost reduction on black background
00:10
HD
Testosterone level indicator scale. Low normal high meter infographic animation on white background. Showing high testosterone level color gauge indicator for hormone balance and health monitoring.
00:10
HD
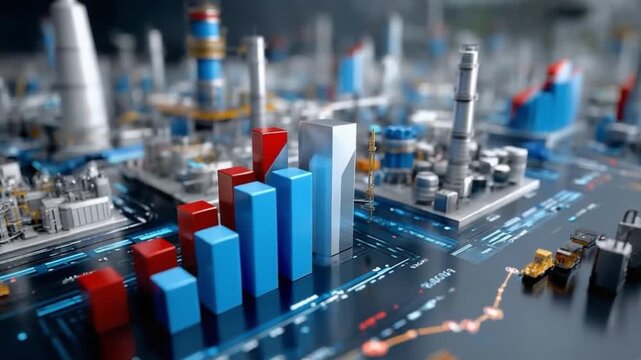
Industrial Growth in Figures: A 3D rendering visualizes an industrial landscape, with rising and falling bar graphs integrated, symbolizing economic performance and financial trends within the sector.
00:05
HD
accuracy rate level indicator scale.Low normal high meter infographic animation on black background. Showing high pressure level color gauge indicator for health monitoring and safety analysis.4k
00:10
HD
Glowing quality and cost control concept on transparent background. Successful organization strategy and management quality control. Percentage icon of quality with up arrow and cost with down arrow
00:10
HD
Glowing neon Percentage icon, quality control growth graph, and cost reduction animation with growth graph and cost reduction Percentage quality with up arrow, cost with down arrow.
00:10
HD
Bright white 3D number 2040 text animation floating against a deep black void offering a vibrant and modern visual for the year with a sense of digital energy.
00:10
HD
Animated background displaying real-time stock market data with fluctuating graphs and dynamic digital interface, providing an immersive view of financial market analysis
00:10
HD
Macedonia Oil Prices Decline with Oil Barrels, Gold Coins and Downward Green Arrow, 3D Economic and Financial Market Concept
00:11
HD
Net zero goals and CO2 reduction strategy driving sustainability, green energy integration, net zero emissions policies, and climate-friendly sustainability solutions for business and society. Muxer
00:16
HD
fat level indicator scale. Low normal & high meter infographic animation. Showing high fat level color gauge indicator. on a white background 4k animation video
00:10
HD
security level indicator scale. Low normal & high meter infographic animation. Showing high security level color gauge indicator. on a black background 4k animation video
00:10
HD
Zoom in and out animation the grapes symbol. Large black symbol in the center and four small symbols around. Seamless looped 4k animation on white background
00:12
HD
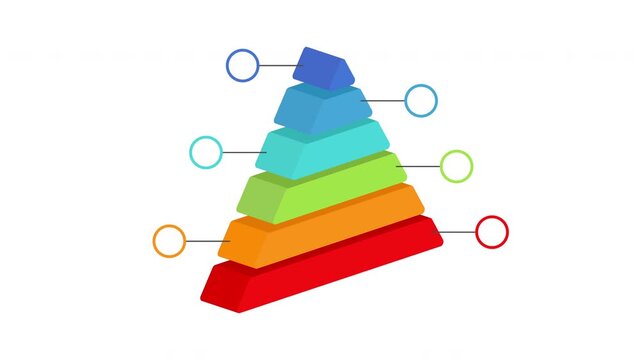
Commercial infographic animated 3D pyramid consisting of 6 blocks
00:07
HD
A woman analyzes a blue cost reduction graph on a transparent screen with a stylus in a dark room, highlighting financial data and business analysis.
00:07
HD
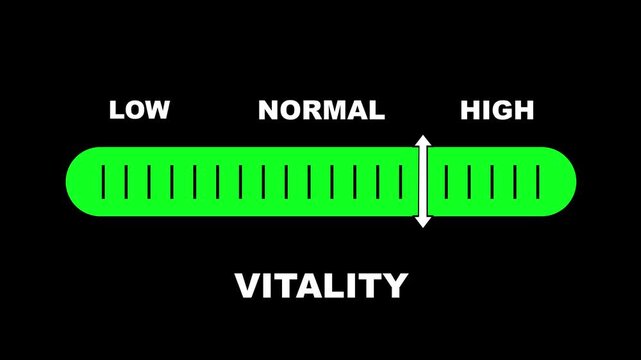
Vitality level indicator scale. Low normal & high meter infographic animation on black background. Showing high vitality level color gauge indicator for energy, health, and wellness monitoring
00:10
HD
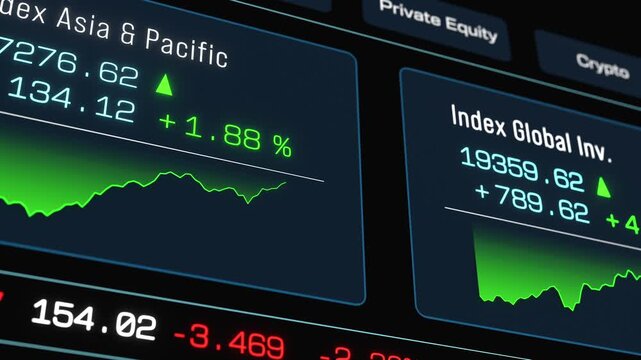
Trading screen stock market ticker with charts, market data, currency exchange rates. Financial market, sector data, prices, trading volume, investment information.
00:10
HD
Horizontal 4K motion graphic with vertical Portuguese typography appearing word by word via spacing reduction, sharp zoom transitions, circular loop rotation, and black and white backgrounds.
00:12
HD
Italy Oil Price Falling with Oil Barrels Downward Green Arrow and 3D Financial Data Visualization Graphs for Economy and Business Concept
00:11
HD
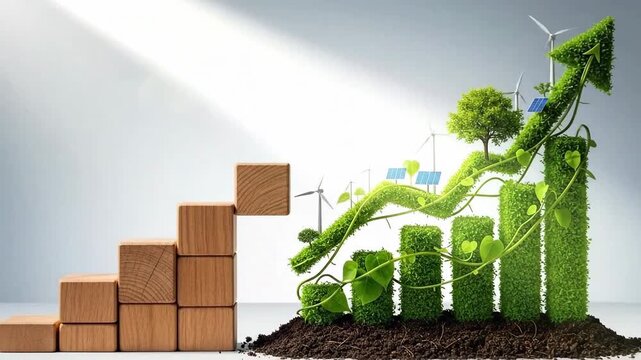
Sustainable growth concept with green graph, wind turbines, solar panels, and wooden blocks.
00:07
HD
Down indicator arrow downward showing loss or negative growth. Suitable for financial concepts, presentations, infographics, and businessrelated designs.
00:10
HD
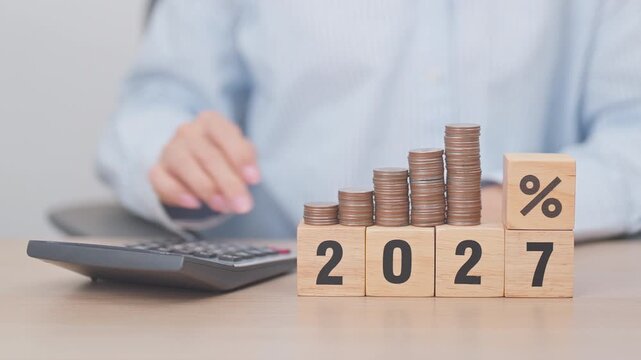
2027 New year with percentage change to UP and Down arrow with coin stack. Interest rate, GDP, stocks market, financial, deflation and Inflation, mortgage, debt, Loan and Economic Recession
00:09
HD
Stock Market Analysis at Dusk: A laptop displays stock market data, reflecting the vibrant city lights of a cityscape as the day transitions into dusk.
00:10
HD
Animated business graph chart icon with a decreasing trend on a black background
00:10
HD
Business executives collaborating on environmental sustainability strategy utilizing renewable energy solutions to achieve net zero targets in corporate meeting.
00:14
HD
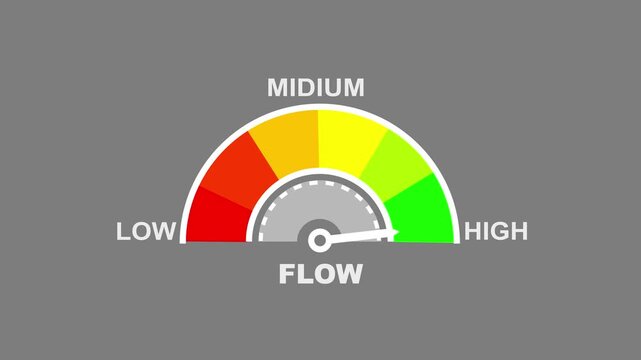
FLOW Level Text or Word Low and Medium to High Meter Concept Animation on Black Background and black Screen. a medium level of flow with labels low and on either side against a stark.
00:10
HD
Abstract 3D number 1918 text animation floating against a deep black void offering a vibrant and modern visual for the year with a sense of digital energy. 4k motion video.
00:10
HD
Line graph
00:15
HD
Luxembourg Oil Prices Decline with Oil Barrels, Gold Coins and Downward Green Arrow, 3D Economic and Financial Market Concept
00:11
HD
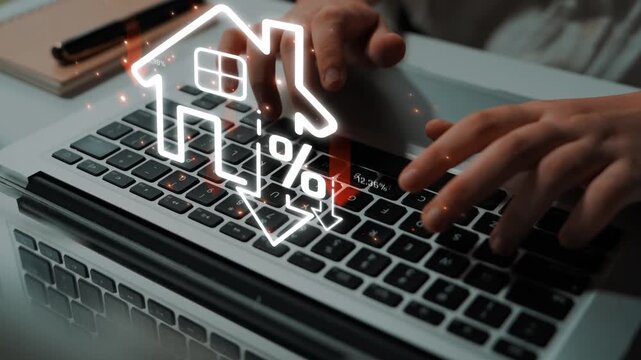
Digital Concept of Real Estate Market with Keyboard and Percentage Sign, Showing Trends in Housing Prices and Economic Data Analysis Sigmoid
00:10
HD
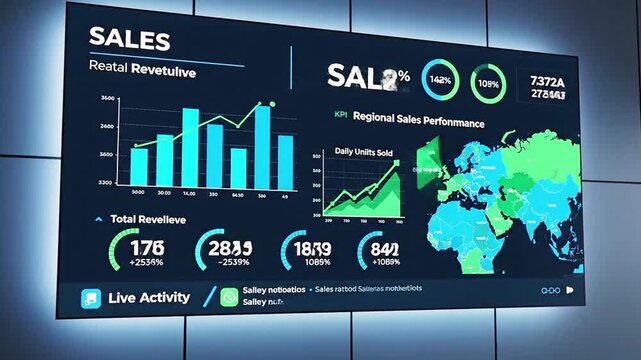
A screen displaying sales data, including charts, graphs, figures, and a world map
00:09
HD
reduce level indicator scale. Low normal & high meter infographic animation. Showing high reduce level color gauge indicator. on a black background 4k animation video
00:10
HD
Innovative Finance Solution for Climate Action Promoting Sustainability through Renewable Energy Technology and Wind Power Strategy
00:05
HD
Chart, graph, decrease, green, background displaying a bar chart with a 50% reduction symbolized in white bars on a green background. Ideal for financial, economic, or business-related designs.
00:03
HD
trans fat level indicator scale. Low normal & high meter infographic animation. Showing high trans fat level color gauge indicator. on a white background 4k animation video
00:10
HD
PH level indicator scale. Acidic Neutral Alkaline Low normal high stress meter infographic animation on black background. Animation showing high pH level color gauge indicator for health monitoring
00:10
HD
Sales performance level indicator scale. Low normal & high meter infographic animation on white background. Showing high sales performance level color gauge indicator for business marketing and revenu
00:10
HD
Three word kinetic typography sequence displaying Grow Your Capital with sequential letter spacing reduction and sharp zoom transition
00:12
HD
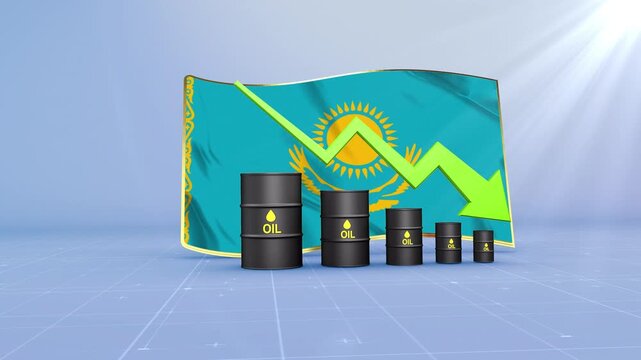
Kazakhstan Oil Price Falling with Oil Barrels Downward Green Arrow and 3D Financial Data Visualization Graphs for Economy and Business Concept
00:11
HD
Neon line Rising arrow transparent channel. arrow rising transparent channel, business growth arrow and graph chart, Business line arrow.
00:10
HD
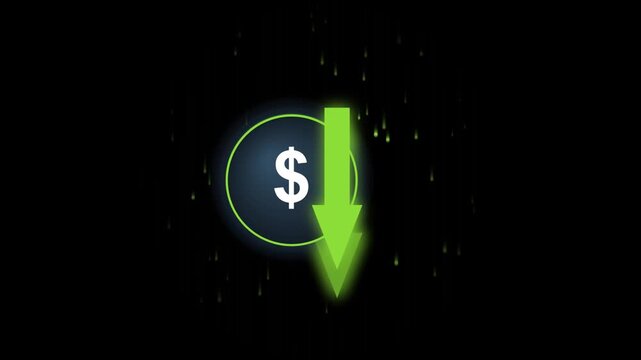
Green arrow pointing down over a dollar sign icon on a black background
00:10
HD
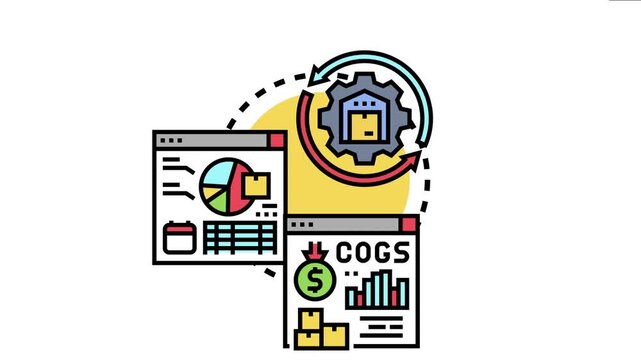
Graphic showing efficient inventory management and supply chain optimization leading to significant reduction in carrying costs, highlighting financial savings and improved operational efficiency
00:17
HD
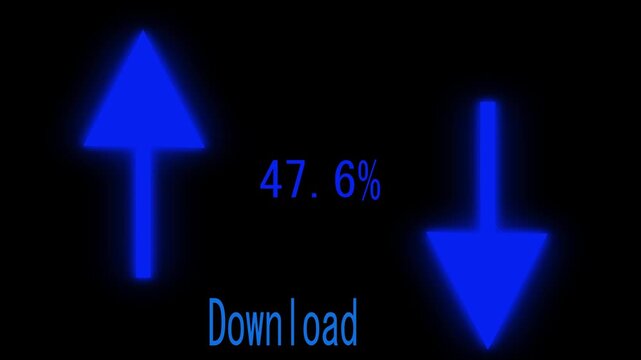
Glowing up and down arrows animation displays download metrics. Fast broadband internet speeds track with the up and down arrows. Digital data transfer rates drive these up and down arrows.
00:10
HD
Increasing counting number 0 to 100k for price like views figures or amount concepts .4k motion graphics video animation
00:10
HD
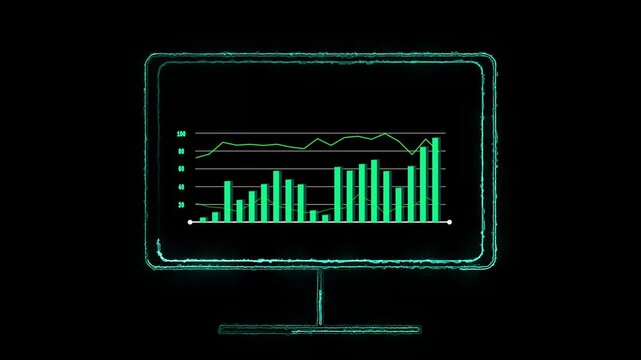
Glowing neon monitor displaying green bar and line graphs. Analytical glowing neon monitor displaying green bar for sales optimization data. Professional glowing neon monitor displaying green bar.
00:10
HD
Graph direction arrow animation. Down to up arrow.
00:08
HD
Abstract 3D number 1980 text animation floating against a deep black void offering a vibrant and modern visual for the year with a sense of digital energy. 4k motion video.
00:10
HD
Zoom in and out animation the bug symbol. Large black symbol in the center and four small symbols around. Seamless looped 4k animation on white background
00:12
HD
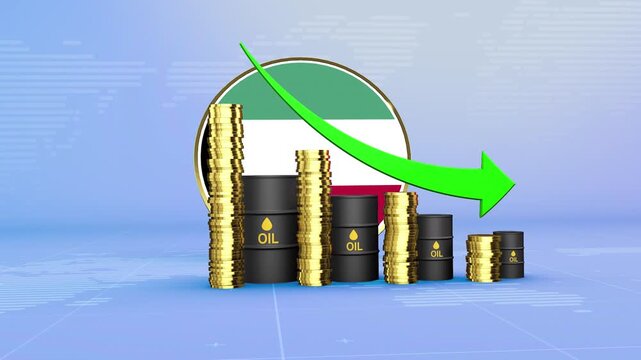
Kuwait Oil Prices Decline with Oil Barrels, Gold Coins and Downward Green Arrow, 3D Economic and Financial Market Concept
00:11
HD
Business professional analyzing data on smartphone with AI technology interface showcasing quality and cost metrics against a city skyline backdrop Sigmoid
00:10
HD
Animated Brightness Slider UI Moving from Low to High
00:09
HD
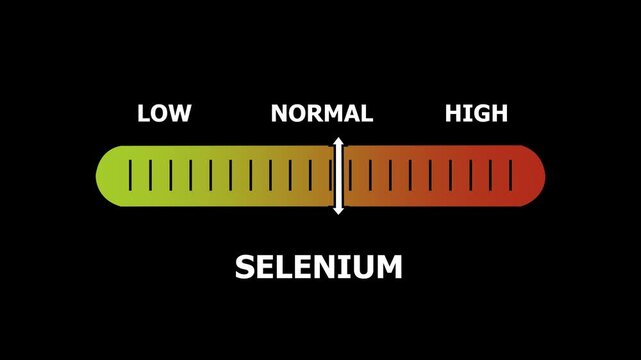
Selenium level indicator scale. Low normal & high meter infographic animation. Showing high selenium level color gauge indicator. on a black background 4k animation video
00:10
HD
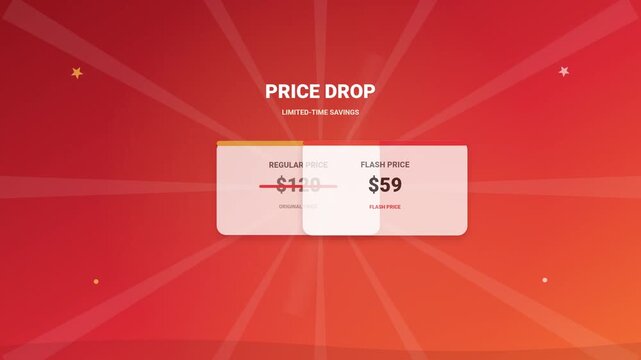
Price drop announcement with original and sale price displayed on a modern interface with red background and radial
00:10
HD
100-0 charging less percent Battery animation 4K, Graphic animation of battery icon charging, increasing and decreasing animation in alpha channel
00:11
HD
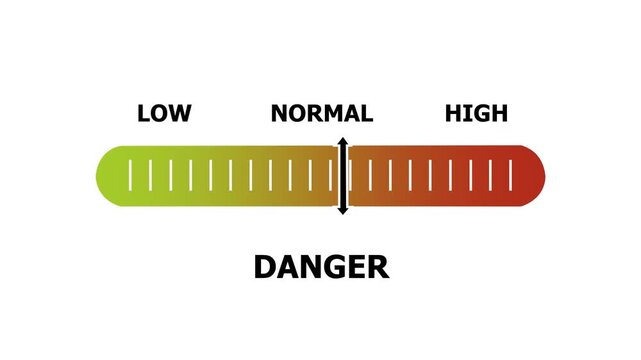
danger level indicator scale. Low normal & high meter infographic animation. Showing high danger level color gauge indicator. on a white background 4k animation video
00:10
HD
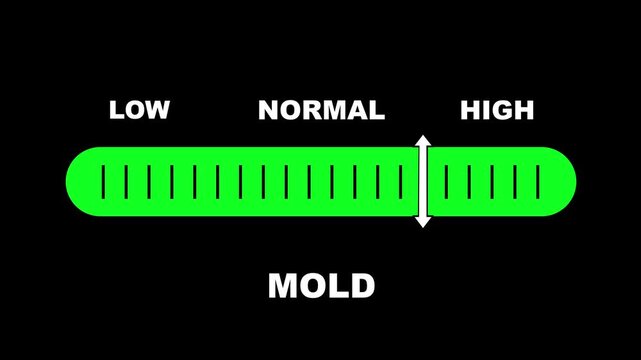
Mold level indicator scale. Low Normal High meter infographic animation on black background. Animation showing high mold level color gauge indicator for air quality and health safety monitoring.
00:10
HD
Falling Chart with Arrow Animation, Animated Financial Crisis Chart with Trend Line Graph, Decline Bar Chart of Economy
00:10
HD
Three word kinetic typography sequence displaying The Unique Experience with sequential letter spacing reduction and sharp zoom transition
00:12
HD
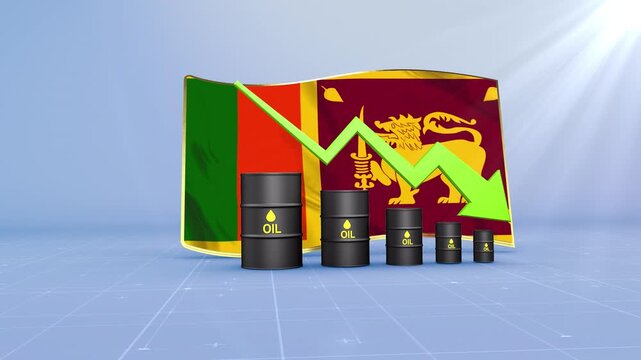
Sri Lanka Oil Price Falling with Oil Barrels Downward Green Arrow and 3D Financial Data Visualization Graphs for Economy and Business Concept
00:11
HD
Hand made arrows pointing.
00:09
HD
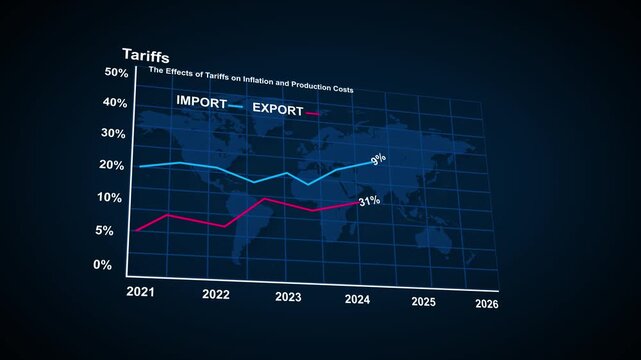
Economic graph showing tariffs impact on import and export costs from 2021 to 2025 with rising and falling trend lines, ideal for finance, trade, and global economy topics. Financial data analysis .
00:10
HD
Percentage Sign Rain Alpha Channel Finance Motion Graphic Percentage signs fly float on transparent background. Sale campaigns discounts financial data interest rates taxes taxes inflation business gr
00:15
HD
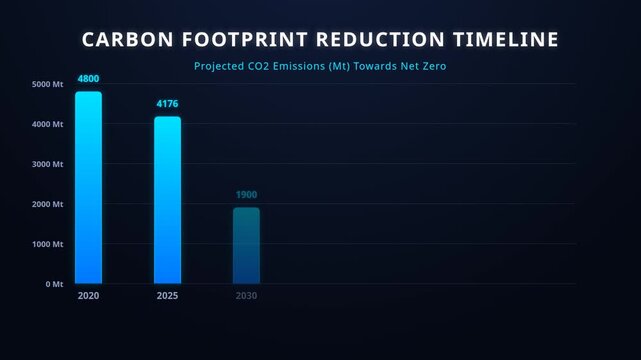
Carbon footprint reduction timeline chart with projected co2 emissions towards net zero target, for climate change strategy, environmental sustainability, global warming mitigation, green
00:20
HD
Animation Growing down of Business Analytics
00:11
HD
Dots on a white background bouncing on the chart
00:10
HD
Infograph line and top point on black screen
00:11
HD
Abstract 3D number 1981 text animation floating against a deep black void offering a vibrant and modern visual for the year with a sense of digital energy. 4k motion video.
00:10
HD
Zoom in and out animation the snowflake symbol. Large black symbol in the center and four small symbols around. Seamless looped 4k animation on white background
00:12
HD
Barbados Oil Prices Decline with Oil Barrels, Gold Coins and Downward Green Arrow, 3D Economic and Financial Market Concept
00:11
HD
A creative ESG concept illustration showcasing various icons that represent sustainable practices and corporate responsibility in a modern business environment. Raster
00:20
HD
Neon business graph chart icon animation background. Neon business growth concept animated. Neon line business graph.
00:10
HD
Circular economy concept for future business growth and environmental sustainability and reduce pollution for future business and environmental growth.Wooden cubes .4k corporate video.Place for logo
00:13
HD
Animated digital gauge shows co2 meter level increasing gradually from low to high critical level, meter turns green, yellow, orange and finally red, digital HUD screen
00:18
HD
Blue Glass Percentage Sign on White Background, 3D Render.
00:08
HD
Business planning for speed and productivity concept on the transparent background. Management strategy, focusing on cost control, quality improvement, performance efficiency. 4k video animation.
00:15
HD
Difficulty level indicator scale. Low normal high meter infographic animation on black background. Showing high difficulty level color gauge indicator for skill assessment and performance monitoring.
00:10
HD
Business graph and bar chart, Business Financial Growing Business Income and Earnings. business growth target graph bar animation on a cyan background.
00:08
HD
Three word kinetic typography sequence displaying Growth With AI with sequential letter spacing reduction and sharp zoom transition
00:12
HD
Morocco Oil Price Falling with Oil Barrels Downward Green Arrow and 3D Financial Data Visualization Graphs for Economy and Business Concept
00:11
HD
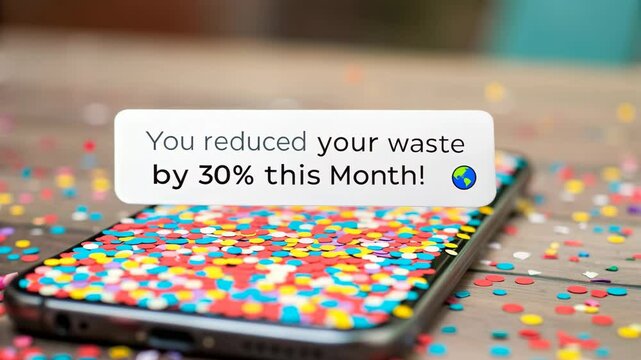
Consumption goals concept. A smartphone lies on a table, decorated with colorful confetti, displaying a message about reducing waste by 30% this month.
00:05
HD
abstract red stock market line graph grid background, trading and financial data concept
00:05
HD
Office icon. Web icon set. Office, great design for any purposes. Motion graphics.
00:36
HD
Performance Level Meter Animation: Track and Compare Performance from Low to High Levels with Dynamic Increasing/Decreasing Gauge for Data Visualization, Productivity, and Motion Graphics
00:10
HD
A colorful semi-circular gauge a needle pointing towards the MIDIUM" section indicating a moderate level of happiness against a stark.  happy level text or word low and medium to high meter concept.
00:10
HD
a glowing neon trend icon animation video on black background
00:10
HD
Business executives collaborating on environmental sustainability strategy utilizing renewable energy solutions to achieve net zero targets in corporate meeting.
00:12
HD
Bright white 3D number 2036 text animation floating against a deep black void offering a vibrant and modern visual for the year with a sense of digital energy.
00:10
HD
Financial business Loss down graph chart. business loss concept. Hi tech style glowing graph animation. Dynamic animated chart with falling arrow and trend line depicting stock market crash.
00:08
HD
Romania Oil Prices Decline with Oil Barrels, Gold Coins and Downward Green Arrow, 3D Economic and Financial Market Concept
00:11
HD
A hand reaches toward glowing digital graphs and icons representing cost reduction and financial growth, showcasing modern business analytics in an office environment. Auvana
00:13
HD
glowing business icons symbolizing financial growth and cost reduction. The image conveys efficiency and modern corporate strategy. neon business icon
00:10
HD