設定密碼的連結已經傳送至: 日後若要存取您的購買項目,您將需要使用密碼。
免費試用即可取得 3 部影片或 25 張影像
已新增篩選器
排序方式:

在影片中找到 19,816 個「increase and decrease」的結果

Cyan bar chart with downward trend line graph. Cyan bar chart for business loss or warning. Digital cyan bar chart animation for economic report.
00:12
HD
Currency fluctuation icon featuring money with upward and downward arrows. Visual representation of exchange rate movement and financial market changes.
00:10
HD
Property condition evaluation involves analyzing building structure. Asset value like a car in a garage with a price tag. And market trends represented by a chart and magnifying glass
00:17
HD
Zigzag line with a downward arrow falling trend loss decline and negative business direction animation
00:06
HD
Bright white 3D number 2031 text animation floating against a deep black void offering a vibrant and modern visual for the year with a sense of digital energy.
00:10
HD
Zoom in and out animation the clipboard symbol. Large black symbol in the center and four small symbols around. Seamless looped 4k animation on white background
00:12
HD
Orange sticker with black outline displaying 10 percent text
00:08
HD
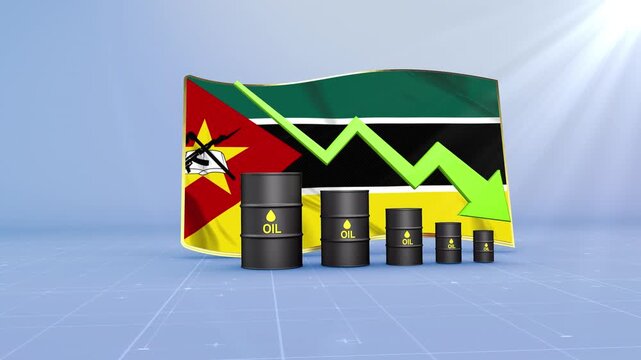
Mozambique Oil Price Falling with Oil Barrels Downward Green Arrow and 3D Financial Data Visualization Graphs for Economy and Business Concept
00:11
HD
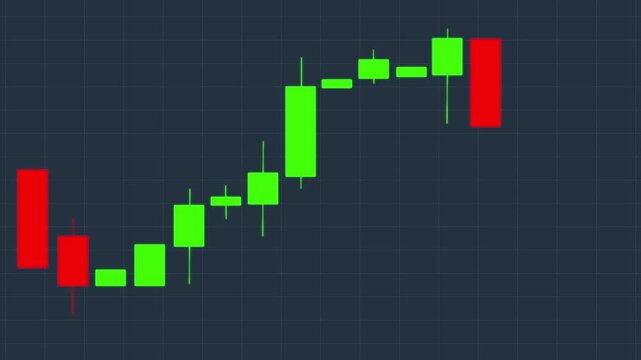
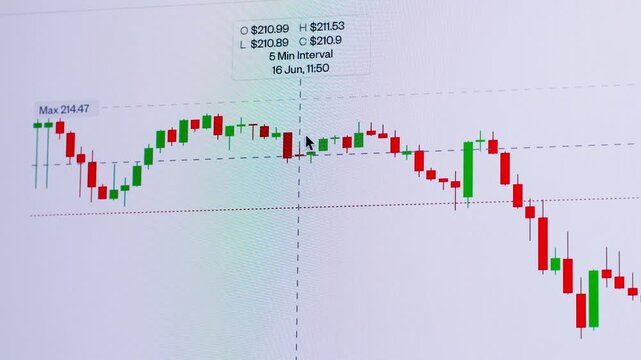
Stock Market Candlestick Chart Animation Showing Bullish Trend Rise Followed by Bearish Trend Fall, Financial Trading, Forex, Crypto Investment Analysis Graph on Dark Grid Background Loop
00:09
HD
Red arrow pointing down animation. Continuous Bouncing Motion Graphic for Directions and Download.
00:10
HD
neon simple $ icon animation video
00:10
HD
Increasing brightness bar animation, Brightness level slider animation for light intensity adjustment.
00:10
HD
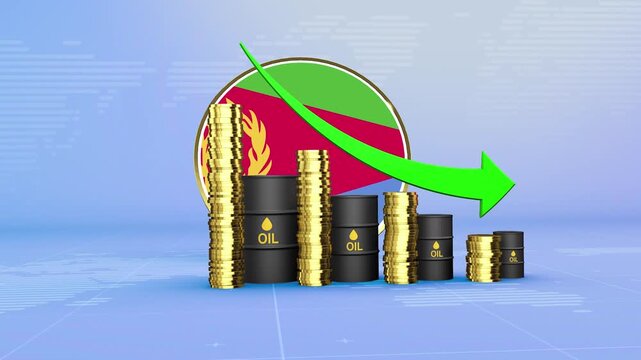
Eritrea Oil Prices Decline with Oil Barrels, Gold Coins and Downward Green Arrow, 3D Economic and Financial Market Concept
00:11
HD
Minimalist bar chart animation showing declining business trends
00:10
HD
Black color arrow rising transparent channel. Abstract arrow growth chart of economy icon black color animated down to up arrow animation, on a white background, direction animation,with video
00:05
HD
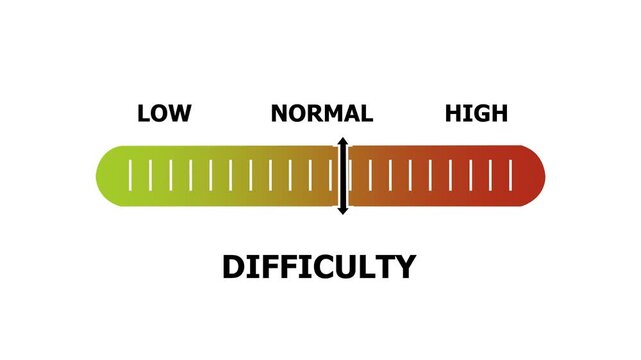
difficulty level indicator scale. Low normal & high meter infographic animation. Showing high difficulty level color gauge indicator. on a white background 4k animation video
00:10
HD
Cryptocurrency trading. Bitcoin stock graphic. Bitcoin mining and Finance banking management concept, oil and Money trading, Digital trade platform. Profit and loss graph. Online trading
00:12
HD
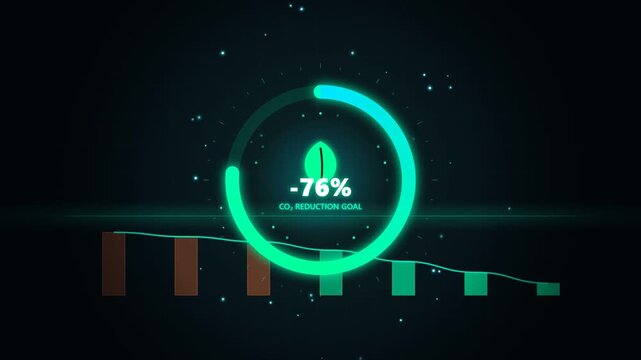
Futuristic CO2 Reduction Goal Tracker with Leaf Icon
00:12
HD
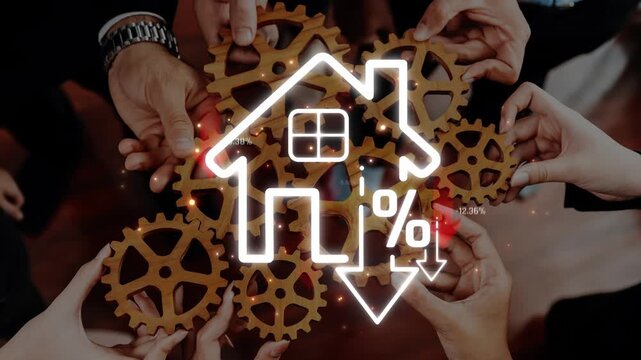
Hands Collaborating with Gears and a House Icon Representing Real Estate Market Dynamics and Economic Trends in Property Valuation and Investment Opportunities Sigmoid
00:15
HD
Sound Icon Animation - Increasing Volume with Waves
00:10
HD
Thermometer Temperature Increase and Decrease Animation Clinic and Weather Alpha Channel 4K Resolution
00:06
HD
Dynamic danger gauge meter animation with moving needle indicating increasing risk levels from low to on a black background, for industrial safety, monitoring, risk assessment, and data visualization
00:10
HD
Hand holding money and another hand presenting financial services with a low interest tag. Connecting to a house icon and a rising bar chart. Symbolizing reduced loan expenses and better credit terms
00:17
HD
Wellness Word Cloud
00:11
HD
Focus level indicator scale. Low normal high meter infographic animation on black background. Showing high focus level color gauge indicator for mental performance and productivity monitoring.
00:10
HD
server status level indicator scale. Low normal high meter infographic animation on black background. Showing high pressure level color gauge indicator.4k animation video
00:10
HD
Minus and plus buttons press alternately inside a rounded ivory control on a sage background in a seamless eight second loop.
00:08
HD
Jordan Oil Price Falling with Oil Barrels Downward Green Arrow and 3D Financial Data Visualization Graphs for Economy and Business Concept
00:11
HD
Response level indicator scale. Low normal & high meter infographic animation on black background. Showing high response level color gauge indicator for customer service and communication analysis.
00:10
HD
Red Downward Arrow Icon Animation with Blue Gradient Background and Subtle Glow
00:05
HD
Inverse relationship chart animation scales on grids. Corporate inverse relationship chart animation tracks inverse links. Modern inverse relationship chart animation details paths.
00:08
HD
Vibrant 3D graphic illustration of '11
00:08
HD
Historical cost Animation
00:06
HD
Green rising zigzag arrow on black background showing stock market recovery, with video animation.
00:10
HD
Abstract dollar sign icon and up arrow animation on a black background. Upward arrow and dollar icon. High pricing icon. profit, investment, growth business, economy, finance and success concept
00:10
HD
Falling red bar graph showing financial decline on dark digital background, business analytics and data loss visualization
00:06
HD
Bright white 3D number 2017 text animation floating against a deep black void offering a vibrant and modern visual for the year with a sense of digital energy.
00:10
HD
Business Loss Shown Through a Red Declining Graph, Highlighting Reduced Revenue, Falling Profitability, Financial Pressure, Market Challenges and Negative Growth
00:10
HD
Futuristic Robot Analyzing Climate Data with Charts and Global Indicators for Carbon Reduction Goals and Sustainability Timelines until 2050 Sigmoid
00:10
HD
Afghanistan Crude Oil Price Decline with Oil Barrels and Downward Green Arrow
00:11
HD
Screen Brightness Increase and Decrease Animation.
00:07
HD
Health Bar
00:06
HD
Business strategy visualizing annual operational savings, managing financial risks, and achieving cost reduction through budgeting, planning, and automated efficiency, aiming for profit growth
00:17
HD
Feed In Premium Word Cloud
00:09
HD
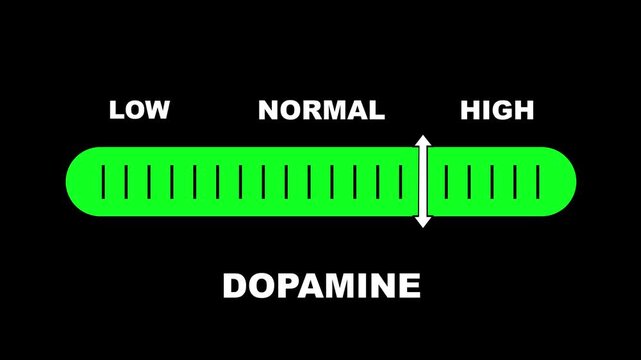
Dopamine level indicator scale. Low normal & high meter infographic animation on black background. Showing high dopamine level color gauge indicator for brain neurotransmitter mental health.
00:10
HD
Brightness slider level control animation isolated on black background, slider level adjust 0 to 100, simple brightness contrast icon animated.
00:06
HD
Shopping cart filled with falling percentage symbols, concept for discounts
00:10
HD
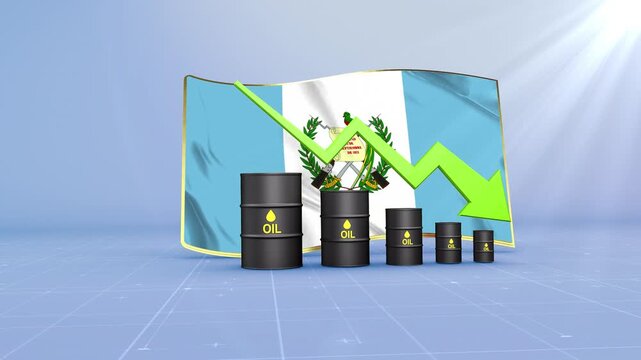
Guatemala Oil Price Falling with Oil Barrels Downward Green Arrow and 3D Financial Data Visualization Graphs for Economy and Business Concept
00:11
HD
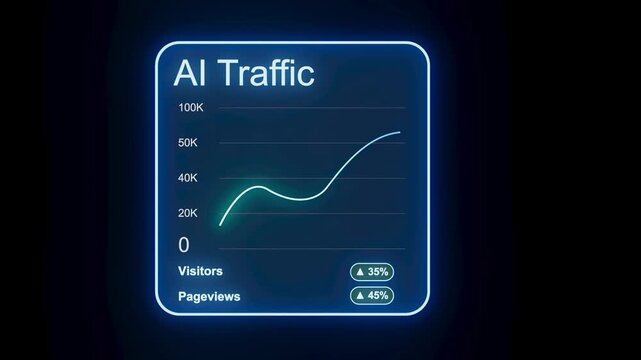
Graph displays AI traffic data with numbers for visitors and pageviews. The design has a blue background with a simple line showing trends.
00:10
HD
Animated down graph icon designed in flat icon style. Finance, Business Info graphic animation, Bar down graph Animated down graph icon, business or finance, down graph bar,4k video
00:10
HD
Russia economic bar chart graph showing decreasing downturn with national Flag 3D animation on black background.
00:16
HD
Bar chart with red arrow showing rapid economic decline
00:15
HD
system load level indicator scale. Low normal high meter infographic animation on black background. Showing high pressure level color gauge indicator.4k animation video
00:10
HD
Modern line graph displays falling investment market trends. Technical line graph monitors negative corporate revenue data. Financial crisis concept with digital line graph.
00:10
HD
Golden dollar coin with green upward and red downward arrows, isolated on a transparent background
00:15
HD
Hand Stacks Wooden Blocks with Green Icons on Desk to Promote Carbon Reduction, Track Environmental Goals, Support Recycling Efforts, Monitor Sustainability, and Protect Nature
00:05
HD
Cost 2026business finance concept. Businessman cost reduction icon with down arrow for budget management and 4k Animation video
00:10
HD
Red line graph against black background
00:05
HD
Business Professional Analyzing Growth Trends with Futuristic Graphs and Digital Interface for Sustainable Development Goals and Economic Projections Sigmoid
00:10
HD
Portugal Oil Prices Decline with Oil Barrels, Gold Coins and Downward Green Arrow, 3D Economic and Financial Market Concept
00:11
HD
Financial Growth Graph Animation Featuring Increasing Business Performance Bars
00:07
HD
Zoom in and out animation the server symbol. Large black symbol in the center and four small symbols around. Seamless looped 4k animation on white background
00:12
HD
Financial consultant helping clients with personal debt reduction plans. Managing budgets. And calculating interest rates for loan payments and mortgage planning. Depicted as a comprehensive strategy
00:17
HD
Glowing neon line graph downwards against black background animation. Stock market losses and descending trading graph and downward arrows recession
00:10
HD
Life expectancy level indicator scale. Low Normal High meter infographic animation on black background. Animation showing high life expectancy level color gauge indicator for health and longevity.
00:10
HD
3D flat motion graphic animation of a colourful speedometer performance gauge meter increasing and decreasing percentage value isolated on green screen chroma key background for measurement technology
00:08
HD
Blue neon Up and down arrow icon representing bidirectional movement, data transfer, upload and download, exchange, navigation, switching, workflow, financial transactions, and directional change.
00:10
HD
Tonga Oil Price Falling with Oil Barrels Downward Green Arrow and 3D Financial Data Visualization Graphs for Economy and Business Concept
00:11
HD
Bright white 3D number 2030 text animation floating against a deep black void offering a vibrant and modern visual for the year with a sense of digital energy.
00:10
HD
Glowing Neon Percentage Growth and Decline Icon Animation with Up and Down Arrows on Black Background, Financial Business Statistics, 4K Motion Graphics Loop..
00:10
HD
Global business line animation. Abstract glowing neon line business graph growth arrow to down arrow.  loss, and negative trends on a dark, abstract background
00:10
HD
Red arrow, pointing down, with white outline, motion, graphic, on, Alpha channel, isolated, directional, indicator, downward, trend, decrease, negative, growth, download, icon.
00:07
HD
demand level indicator scale. Low normal high meter infographic animation on black background. Showing high pressure level color gauge indicator.4k animation video
00:10
HD
Modern line graph displays falling investment market trends. Technical line graph monitors negative corporate revenue data. Financial crisis concept with digital line graph.
00:10
HD
Neon percentage icon animation with glowing blue up and down arrows for financial market, interest rate and business analytics.
00:10
HD
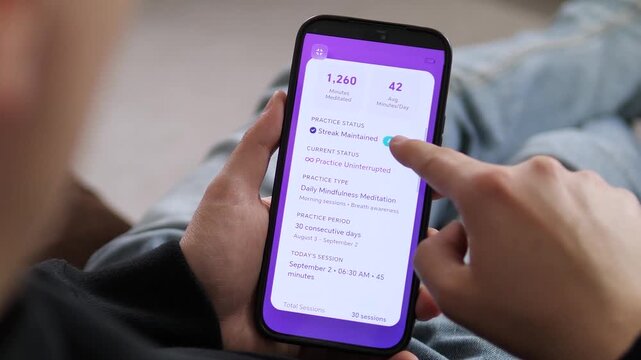
a user reviewing their mindfulness progress on a mobile device. The screen displays a 30 day streak, 1,260 minutes meditated, and a Streak Maintained status. Ideal for illustrating personal growth
00:12
HD
White arrows rise upward, flanked by percentage symbols
00:10
HD
calcium level indicator scale. Low normal & high meter infographic animation. Showing high calcium level color gauge indicator. on a white background 4k animation video
00:10
HD
A group of professionals engages in a business meeting focused on sustainability strategies, showcased with digital graphics representing CO2 emissions and eco-friendly icons. Raster
00:20
HD
Norway Oil Prices Decline with Oil Barrels, Gold Coins and Downward Green Arrow, 3D Economic and Financial Market Concept
00:11
HD
Neon style graph illustration with glowing outline and black background for business and data visualization
00:08
HD
Zoom in and out animation the giraffe head symbol. Large black symbol in the center and four small symbols around. Seamless looped 4k animation on white background
00:12
HD
System implementing performance calibration adjustment, analyzing feedback, making improvements, and optimizing settings for enhanced efficiency and quality outcomes in various operational contexts
00:17
HD
Illicit trade of Opioids tramadol and oxycodone or oxy is significant public health danger. Supplies contaminated with potent synthetic fentanyl. Counterfeit pills increases risk of fatal overdose.
00:20
HD
Probability level indicator scale. Low Normal High meter infographic animation on black background. Animation showing high probability level color gauge indicator for statistical analysis and outcome.
00:10
HD
Financial Market Decline and Economic Downturn Falling Dollar Value, Decreasing Wealth, Shrinking Investment Returns, Lower Asset Prices, and Increasing Financial Risk
00:10
HD
Three word kinetic typography sequence displaying Dominate The Market with sequential letter spacing reduction and sharp zoom transition
00:12
HD
Cape Verde Crude Oil Price Drop with Oil Barrels Downward Green Arrow and 3D Financial Data Visualization Graphs for Economy and Business Concept
00:11
HD
Bright white 3D number 2050 text animation floating against a deep black void offering a vibrant and modern visual for the year with a sense of digital energy.
00:10
HD
Arrow animation pointing downward on black.
00:09
HD
Purple bar chart showing downward trend with arrow graph. Financial loss chart for corporate performance failure metrics. Digital bar chart animation for network alert.
00:12
HD
Animated 3d Bar Chart and Line Graph Showing Growth and Data Analysis
00:08
HD
cyber threat level indicator scale. Low normal high meter infographic animation on black background. Showing high pressure level color gauge indicator.4k animation video
00:10
HD
Glowing lines and arrows representing financial market data move across a dark background with changing colors, percentages, and dollar signs in a slow motion montage
00:09
HD
Cyan Bar Graph with Reflection Showing Downward Trend on Black Background chart rising
00:10
HD
Cash with down arrow dollar icon .  growth business, economy, finance and success concept. 4k animation. Cash down, arrow and dollar stocks graph, market fall arrow and black background .
00:10
HD
Close-up of a woman's hands typing on a laptop, wearing a white shirt and black jacket. A green arrow pointing upwards with the text "%" above it, suggesting a concept for business growth or financia
00:08
HD
sulful dioxide level indicator scale. Low normal & high meter infographic animation. Showing high sulful dioxide level color gauge indicator. on a white background 4k animation video
00:10
HD
Businessman Holding House Icon with Percentage Sign Indicating Decrease in Values, Financial Growth and Real Estate Decline Concept Sigmoid
00:10
HD
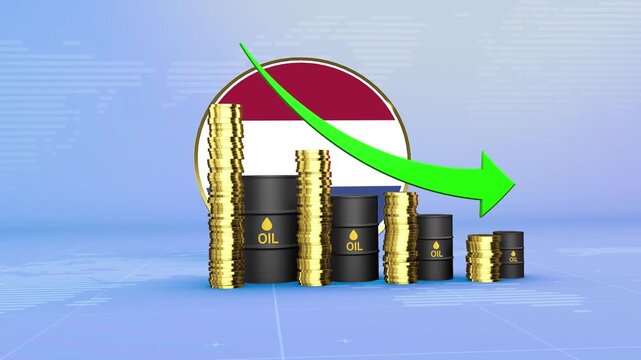
Netherlands Oil Prices Decline with Oil Barrels, Gold Coins and Downward Green Arrow, 3D Economic and Financial Market Concept
00:11
HD