設定密碼的連結已經傳送至: 日後若要存取您的購買項目,您將需要使用密碼。
免費試用即可取得 3 部影片或 25 張影像
已新增篩選器
排序方式:

在影片中找到 19,768 個「increase and decrease」的結果

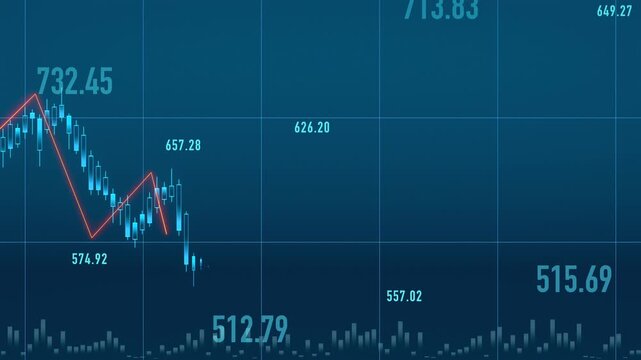
Stock market candle stick chart, line graph and financial figures, data. Business, stock exchange, trading, investment growth, wealth, risk, volatile, shareholder concept.
00:16
HD
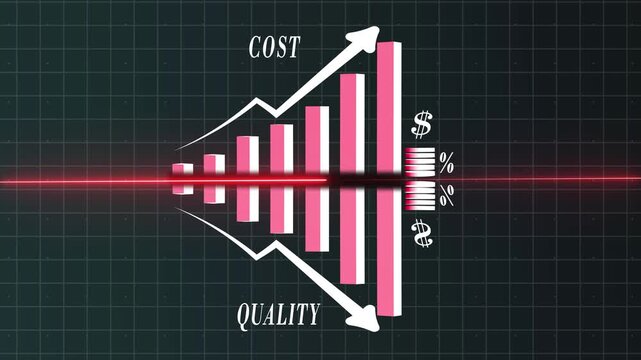
Business concept for quality improvement and cost reduction. Bar and arrow showing quality control growth graph and cost optimization. Successful organization strategy and management

00:10
HD
Business Analytics Dashboard Motion Graphic with Growth Statistics
00:10
HD
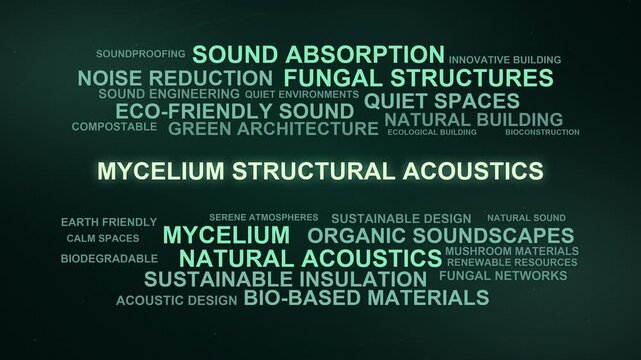
Mycelium Structural Acoustics Word Cloud
00:09
HD
Animated bar chart displaying data trends decreasing, then increasing, then decreasing again, on a clean background.
00:05
HD
Increase counting numbers 0 to 50k digital clock or timer display with decimal point.4k motion graphics video animation
00:10
HD
Business graph chart with growing business concept. Abstract decreasing business graph chart animation  arrow on background.
00:10
HD
Animated interface icons with growth decline idea and alert symbols on white background
00:08
HD
A wooden bin contains various organic kitchen scraps like fruit peels and vegetable remnants mixed into rich dark soil, illustrating sustainable waste management practices for healthy garden
00:08
HD
Cost reduction and cost saving through digital transformation, business cost optimization, operational cost reduction, financial savings, and resource efficiency strategies for business success. Elide
00:14
HD
Red bar chart with line graph showing cost reduction and improving quality.. growing business concept.
00:10
HD
A futuristic cyan arrow graph line moving downwards on a black background, symbolizing the concept of financial loss, market decline, economic recession, business collapse and failure.
00:10
HD
Bar chart for declining business performance by month. the curve shows a downward move .chart graph animation, 4k arrow is making downfall on a grid ...
00:10
HD
A high-fidelity financial chart displays a fluctuating market trend on a computer screen with a total value of $1685.97 showing a 0.04% increase.
00:14
HD
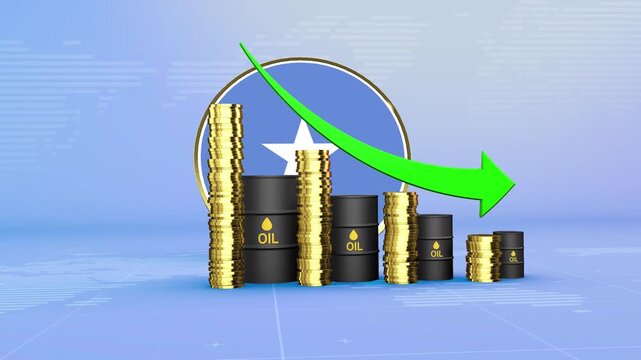
Somalia Oil Prices Decline with Oil Barrels, Gold Coins and Downward Green Arrow, 3D Economic and Financial Market Concept
00:11
HD
Evaluating product benefits through cost optimization, efficient inventory management, and gaining market advantage, leading to business growth and recognizing achievements
00:17
HD
Animated green plant graphic with sustainability text concept
00:05
HD
Business graph chart with growing business concept. Abstract decreasing business graph chart animation background.Motion graphics of concept
00:10
HD
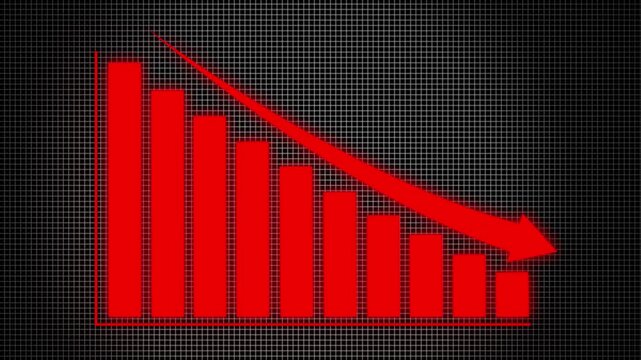
Red Financial Bar Chart Showing Economic Decline and Loss
00:10
HD
Digital Promotion Banner Featuring Eighty Percent Price Reduction and Online Shopping Cart Graphics for E-commerce Marketing Campaigns
00:10
HD
Arrow down business graph icon animation. business chart concept. A neon down business graph icon graphic concept. animation
00:08
HD
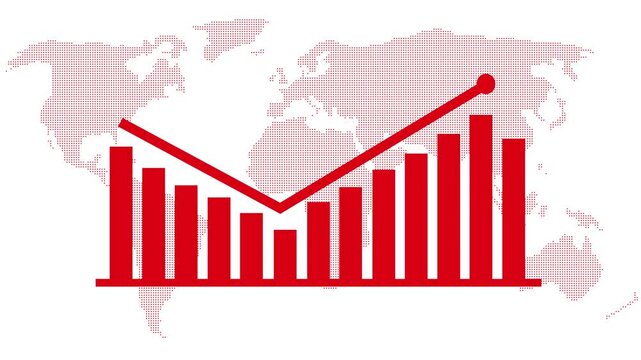
Animated Red Bar Chart with Falling Arrow and Downward Trend Line on Global World Map, Business Decline and Financial Loss Concept
00:10
HD
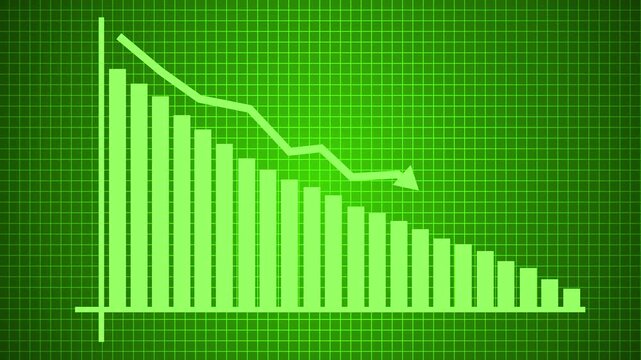
Minimalist Bar Chart Animation on a Green Background for Business Data Visualization
00:08
HD
Electro-Mobility Integration Word Cloud
00:09
HD
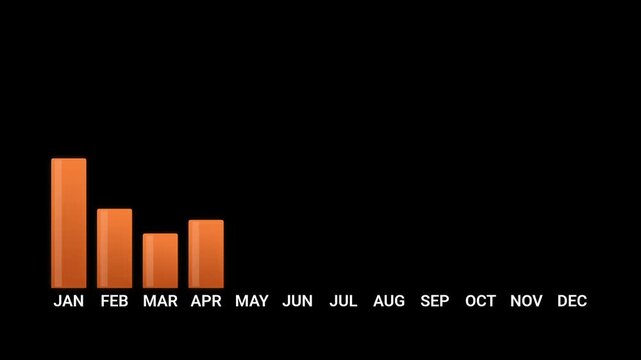
Animated bar graph showing monthly data trends with orange bars against a black background
00:15
HD
Digital Light Intensity Slider HUD Monitor Interface
00:10
HD
A photorealistic and organically swaying 3D coconut tree with height reduced by 20% on a bright white canvas.
00:05
HD
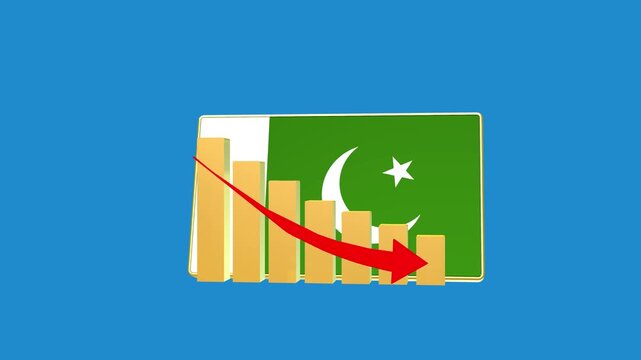
Pakistan economic bar chart graph showing decreasing downturn with national Flag 3D animation on black background.
00:16
HD
Prominent 'MEGA 50%' discount tag stands out against a sleek, dark background, symbolizing a compelling sales event and enticing promotional offer for a modern retail campaign
00:05
HD
Hands Typing on Keyboard with AI Icons Representing Quality and Cost Trends in Modern Technology and Business Strategies for Efficiency and Innovation Gluon.
00:10
HD
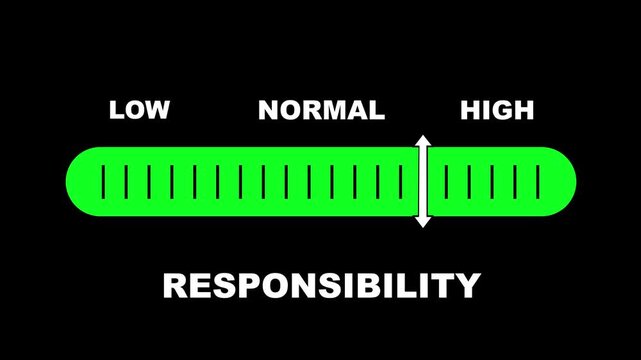
Responsibility level indicator scale. Low normal & high meter infographic animation on black background. Showing high responsibility level color gauge indicator for accountability and performance.
00:10
HD
Revenue and Profit Growth Animation for Corporate Business Reports
00:08
HD
Zoom in and out animation the cat symbol. Large black symbol in the center and four small symbols around. Seamless looped 4k animation on white background
00:12
HD
Neon blue bar graph animation. Animated data technology business finance abstract background looping motion graphics modern digital presentation visuals financial growth success progress statistics.
00:12
HD
Red Bar Chart with Downward Arrow Indicating Financial Decline and Business Loss.
00:10
HD
Pricing adjustment process involves calculating costs, managing finances, and setting competitive prices to optimize business performance using financial data and strategic analysis
00:17
HD
Vertical bar graph analytics statistics neon financial metric icon 4k video graphics
00:06
HD
triangular progression representing data growth and decline over a graph, visualized to highlight change across a timeline or value axis with alpha channel
00:07
HD
High pricing icon. Up arrow with dollar sign. high price business money cost pay payment logotype animation.
00:09
HD
As focal length decreases, autumn branches frame soft green woodland bokeh and layered leaves.
00:15
HD
Red bar graph with dotted line trend overlay on grid. Financial red bar graph with dotted line trend overlay for market analysis. Corporate red bar graph with dotted line trend overlay.
00:08
HD
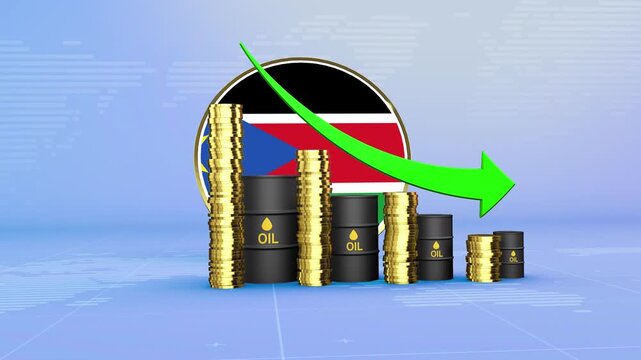
South Sudan Oil Prices Decline with Oil Barrels, Gold Coins and Downward Green Arrow, 3D Economic and Financial Market Concept
00:11
HD
Stick figure pushing a large percentage symbol on a textured background finance
00:05
HD
Bicycle Parking Mandates Word Cloud
00:09
HD
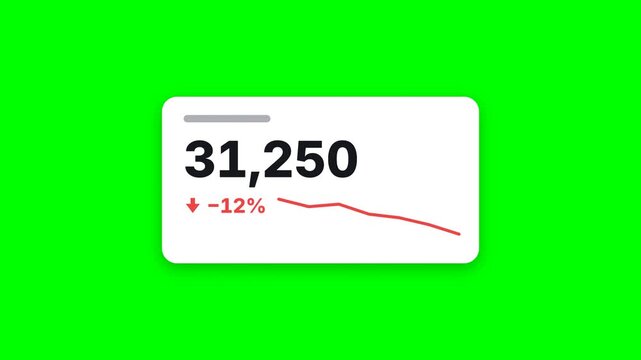
KPI card with number counting and red decline arrow, flat white infographic element on green screen chroma key background, 4K
00:06
HD
Shopping cart filled with falling percentage symbols, concept for discounts
00:10
HD
Co2 Emissions Increase And Decrease Animated Icon With Alpha Channel. Carbon Footprint, Environmental Impact, And Climate Change Motion Graphic. On Transparent Background
00:07
HD
Businessman presenting bar graph on whiteboard business presentation
00:12
HD
Digital Business Stock Market Data and Growth Financial Trading Chart  Animation looping Seamless Motion Background. Business stock data concept
00:19
HD
Net zero goals and CO2 reduction strategy driving sustainability, green energy integration, net zero emissions policies, and climate-friendly sustainability solutions for business and society. Muxer
00:20
HD
Minimalist business chart animation with downward trending  arrow and percentages 4k animation showing financial loss over with background dynamic...
00:10
HD
Business Analytics Dashboard Motion Graphic with Growth Statistics
00:10
HD
Stacked metallic coins showing decreasing growth
00:11
HD
Bar graph animation indicates downward global economic trends. International financial market analytics route across bar graph animation. Economic policy teams use graph.
00:10
HD
Turquoise Bar Graph Declining Over Time During Digital Data Analysis
00:10
HD
Percentage allotments concept financial income distribution, tax planning, economy growth, and budget allocation with documents, money stacks, and a calculator
00:17
HD
Stress level gauge inreasing and decreasing indicating tension animation. emotional response, depression, anxiety, frustration 2d motion graphic.
00:19
HD
Animated red bar chart showing declining business performance and negative financial trends with a downward arrow indicating economic recession, market loss, and decreasing sales growth on white
00:10
HD
Animated digital blue bar chart showcasing business decrease Bar chart growth analysis with upward trend projection sand market trends.
00:15
HD
business graph chart and success ndicating profit profit and loss business plan
00:10
HD
Loss concept business graph animation. Symbolizing revenue drop, financial loss, negative growth,
00:10
HD
Abstract background with rising and falling arrows showing growth decline data flow and business trend concepts animation
00:18
HD
Business growth concept in graph chart showing marketing sales profit increasing to future target . growing business concept. Clean Hi-tech style technology chart, 4k up graph animation video, quality
00:10
HD
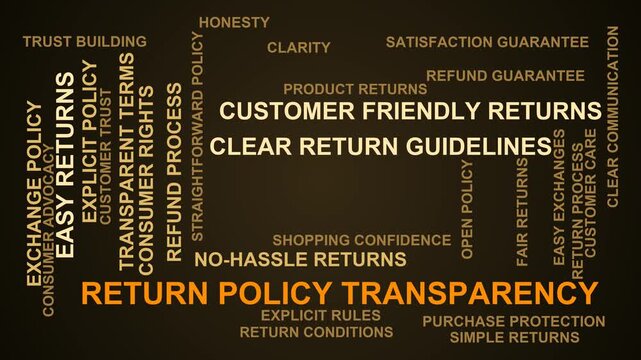
Return Policy Transparency Word Cloud
00:11
HD
This animated infographic visualizes sustainable agriculture data with gauges and bars that dynamically update to show decreasing climate stress and increasing resilience in a minimalist environment.
00:06
HD
Examining cost reduction strategies and financial efficiency for business growth animation..
00:06
HD
Diamond Shape Film Matte Overlay increasing and decreasing size black and white transition animation background. Film or movie classic ending mask.
00:05
HD
Animated financial chart showing market growth followed by a sharp decline, red bar graph and downward arrow symbolizing economic downturn, investment risk and business loss
00:10
HD
Red arrow down business graph icon animation. business chart concept. A neon down business graph icon shape concept animation motion video.
00:06
HD
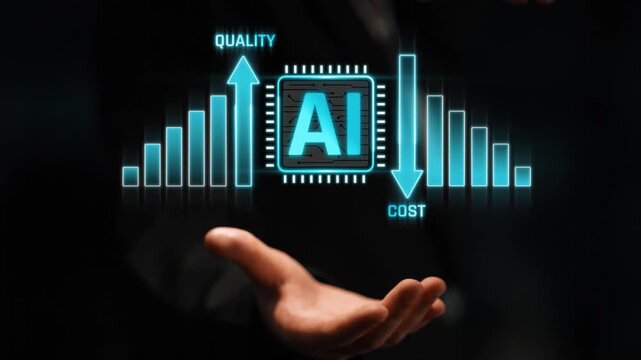
Artificial Intelligence Concept with Graph Displaying Quality and Cost Relationship in Business Context Sigmoid
00:10
HD
Triglycerides level indicator scale. Low normal & high meter infographic animation on black background. Showing high triglycerides level color gauge indicator for blood health and cardiovascular.
00:10
HD
Financial Growth Graph Animation Featuring Increasing Business Performance Bars
00:07
HD
Two curved arrows pointing in opposite directions minimal animation
00:06
HD
Bar chart animation displays declining columns with a downward arrow on dark. Financial market loss reflects on this bar chart. Negative economic data marks chart.
00:07
HD
Circular progress bars showing decreasing numbers in a clean studio setting with subtle lighting
00:59
HD
Illustration depicting an expenses reduction strategy, showing financial charts, budgeting for assets, and planning cost saving initiatives for business operations
00:17
HD
Business professional using laptop with holographic cost reduction graph and bars. Concept of financial efficiency, budget cutting, expense management, and corporate profit optimization.
00:10
HD
Financial crisis in tax. Loan repayment, installment plan. Business animation video
00:07
HD
Green Bar Graphs Showing Financial Growth and Decline with Animated Movement
00:05
HD
simple green random shape graph rising up down value sliced shape background blue background screen animation stock video footage
00:20
HD
Net zero emission , carbon neutral concept. Net zero greenhouse gas emissions target. Climate neutral long term strategy 2050 with net zero digital growth chart and infographic on green nature backgro
00:07
HD
Neon line Rising arrow transparent channel. arrow rising transparent channel, business growth arrow and graph chart, Business line arrow.
00:10
HD
Abstract glowing neon swipe arrow. 4k animation. Down to up neon line arrow direction animation. Neon line raising business arrow on black background for growth visuals
00:10
HD
Credit Crunch Word Cloud
00:11
HD
Money increases icon, dollar rate increase stretching arrow up icon .Glowing up arrow with dollar sign. Glowing neon line of dollar sign icon and up arrow isolated on transparent.Business growth
00:10
HD
Arousal Level Gauge Increasing and Decreasing Indicating Excitement and Activation Animation
00:19
HD
Animated Green Up and Down Arrows Direction Icons on Black Background
00:10
HD
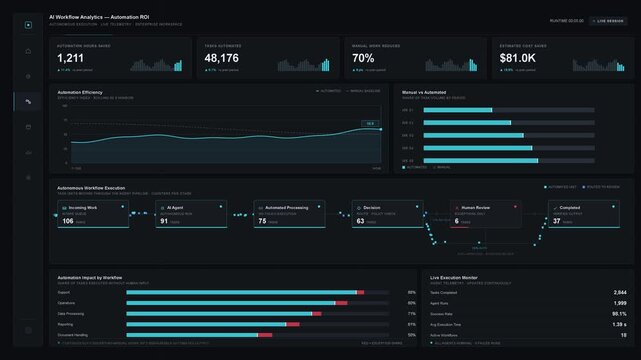
A dark-mode business dashboard illustrating the measurable impact of AI workflows with automation metrics and efficiency charts for business professionals.
00:15
HD
Line graph showing monthly data spikes. Business line graph for corporate performance analysis. Digital line graph animation for financial reporting.
00:08
HD
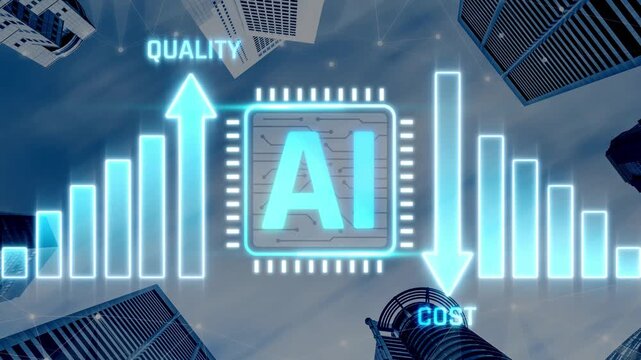
Futuristic Visualization of Artificial Intelligence Impact on Quality and Cost in Urban Environment with Skyscrapers and Data Analytics Elements Sigmoid
00:10
HD
Trans fat level indicator scale. Low normal & high meter infographic animation on black background. Showing high trans fat level color gauge indicator for nutrition and heart health monitoring.
00:10
HD
Corporate Revenue Growth Dashboard Animation with Positive Trend Visualization
00:13
HD
Equalizer in the form of increasing and decreasing bands.
00:05
HD
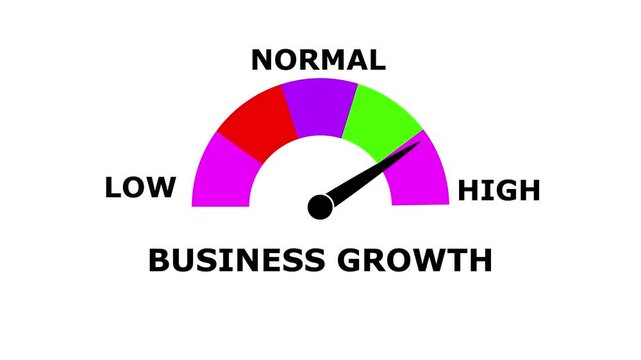
Business Growth Meter Animation: Track and Compare Growth from Low to High Levels with Dynamic Increasing/Decreasing Gauge for Data Visualization, Performance Monitoring, and Motion Graphics,
00:10
HD
Preparing soil, person sits in a garden with coconut coir planting ornamental trees in pots and promoting healthy plant growth through sustainable gardening practices.
00:27
HD
Per unit pricing agreements abstract concept outlines managing costs. Calculating expenses. Negotiating terms. Monitoring inventory. Tracking delivery
00:17
HD
An executive is using a mobile phone and laptop in an office
00:10
HD
Animated growth chart icon, transparent background, loop ready motion graphic
00:12
HD
Personal budget planning with colorful bar chart graph, coins, and coin stack for financial growth
00:05
HD
Declining business bar chart with downward arrow representing falling sales, reduced revenue, financial losses, market decline, decreasing performance.financial loss icon.
00:10
HD