設定密碼的連結已經傳送至: 日後若要存取您的購買項目,您將需要使用密碼。
免費試用即可取得 3 部影片或 25 張影像
已新增篩選器
排序方式:

在影片中找到 13,054 個「decrease arrow」的結果

metabolism rate level indicator scale. Low normal high meter infographic animation on black background. Showing high pressure level color gauge indicator.4k quality animation video
00:10
HD
Tanzania Oil Prices Decline with Oil Barrels, Gold Coins and Downward Green Arrow, 3D Economic and Financial Market Concept
00:11
HD
Animated Dollar Icon with Down Arrow on White
00:10
HD
Animated Vitamin C Meter Showing decrease or icrease from low to High Levels.ideal for concepts related to vitamin C deficiency, nutrition and health
00:10
HD
danger level indicator scale. Low normal & high meter infographic animation. Showing high danger level color gauge indicator. on a white background 4k animation video
00:10
HD
dollar or currency or evaluation vectors with arrow sign towards down , US Dollar red downfall crisis of economy
00:10
HD
Temperature level indicator scale. Low Normal High meter infographic animation on black background. Animation showing high temperature level color gauge indicator for weather and climate monitoring.
00:10
HD
Front view stock market screen with market data, trading volume, prices and percentage changes. Investment strategy, analyzing, data spreadsheet, financial figures, trading board, exchange information
00:12
HD
Vatican City Holy See Flag and Bar Chart Graph Showing Decreasing Values a Red Arrow Economic Crisis Concept
00:11
HD
 Dollar sign currency symbol with arrow graph going down.
00:06
HD
video drawing animation stacked coins and arrow trending down, decreasing statistical graphic concept. Drawn in black and white. On a green chroma key background
00:10
HD
Surplus Vs Deficit Debt Arrow Signs Versus 3d Animation
00:08
HD
Stock market crash, red candlestick chart falling arrow, financial decline concept. Business crisis economy downturn, trading loss graph. Stock market crash risk
00:10
HD
Downward trend highlighted by arrow on blue bar graph over gray grid for performance drop illustration. Blue Bar Graph with Arrow Indicating Downward Trend on Gray Grid chart.
00:08
HD
Gold Price Level Text or Word Low and Medium to High Meter Concept Animation on Black Background and Blue Screen
00:58
HD
Financial decrease icon. Money failure filled flat sign for mobile concept and web design..esp
00:10
HD
Animation of rotation of a white chart down symbol with shadow. Simple and complex rotation. Seamless looped 4k animation on green chroma key background
00:10
HD
Net zero emissions by 2011 to change climate and net zero greenhouse gas emissions target. Aerial of Net zero environment sustainable development concept. Neon net zero goal achieved.4k video
00:10
HD
Neon glowing downtrend icon animation, financial loss concept, animated coins symbolizing decline, downward statistical curve with loss sign, financial business downturn chart.
00:10
HD
Cyan Neon Arrows Moving Right in Graduated Sizes on Dark Background glowing 4k video .
00:10
HD
threat index level indicator scale.Low normal high meter infographic animation on black background. Showing high pressure level color gauge indicator for health monitoring and safety analysis.4k
00:10
HD
South Africa Oil Prices Decline with Oil Barrels, Gold Coins and Downward Green Arrow, 3D Economic and Financial Market Concept
00:11
HD
Financial business Loss down graph chart. business loss concept. Hi tech style glowing graph animation. Dynamic animated chart with falling arrow and trend line depicting stock market crash.
00:08
HD
A semi-circular gauge with a color gradient and a needle indicating a moderate level of infection against a black background. infection text or word low and medium to high meter concept.
00:10
HD
calcium level indicator scale. Low normal & high meter infographic animation. Showing high calcium level color gauge indicator. on a white background 4k animation video
00:10
HD
Bar Chart with Downward Arrow on Green Grid 2026 Animation
00:07
HD
Data visualization sequence on black background, animated bar charts declining over time, highlighting downward trends with arrows, financial analysis insights, Copy space.
00:16
HD
miniature earth planet with a tree Eco-Sustainable Solar Panel Corporate Environment friendly goal development green business strategy global net zero carbon neutral target emission reduction
00:06
HD
Tanzania Flag and Bar Chart Graph Showing Decreasing Values a Red Arrow Economic Crisis Concept
00:11
HD
Bar chart graph with down arrow on green background
00:06
HD
Capitol Building Silhouette with Decreasing Red Graph Lines Against Grid In Blue
00:08
HD
Financial interest rate and market trends concept.
00:10
HD
Carbon footprint reduction key climate responsibility supporting clean energy sustainability low emission levels through data analysis green technology use for healthier planet future
00:05
HD
The Infographic Icon Downward Bar Graph.
00:10
HD
Animated of down business graph icon.  business loss falling down graph's icon, loss sign business graph.
00:09
HD
Brown cardboard boxes with green recycle symbol and foliage around. Eco friendly concept for sustainable packaging, earth day.
00:05
HD
Animated searvice Sector Performance Meter – Increasing and Decreasing Gauge from Good to Best Levels, Comparison Indicator for  Data Visualization,  perfomance, and Motion Graphic Reports
00:10
HD
Net zero emissions by 2008 to change climate and net zero greenhouse gas emissions target. Aerial of Net zero environment sustainable development concept. Neon net zero goal achieved.4k video
00:10
HD
Stock Market Growth Concept, Economic crisis, recession, decrease graph. Infographic financial business diagram with charts month name and showing profits. Stock Market Growth Concept.
00:10
HD
Declining oil prices with falling barrels and downward arrow animated video on transparent background showing market downturn, price drop, reduced demand, and economic decline concept
00:05
HD
connection strength level indicator scale. Low normal high meter infographic animation on black background. Showing high pressure level color gauge indicator.4k animation video
00:10
HD
Albania Crude Oil Price Decline with Oil Barrels and Downward Green Arrow
00:11
HD
Awareness Level Text or Word Low and Medium to High Meter Concept Animation on Black Background and Blue Screen
00:58
HD
Glowing yellow neonstyle image on a black background of a smartphone showing gold bars  a chart with a downwardfacing arrow
00:08
HD
probability level indicator scale. Low normal & high meter infographic animation. Showing high probability level color gauge indicator. on a white background 4k animation video
00:10
HD
Silver Recycling Symbol on Light Blue Surface with Blurred Green Shapes in the Background Macro Shot
00:07
HD
Head down arrow Animation Transparent background
00:05
HD
Neon light effect animation of a shield icon with a composting symbol inside
00:10
HD
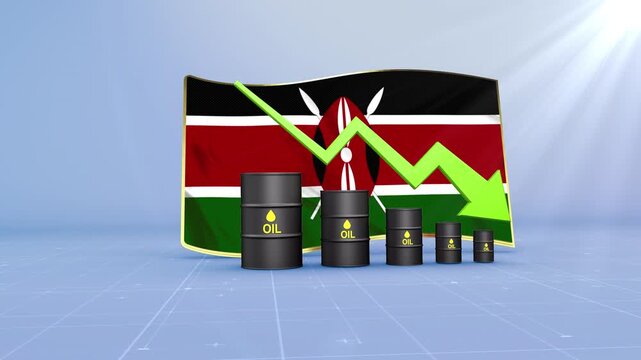
Kenya Oil Price Falling with Oil Barrels Downward Green Arrow and 3D Financial Data Visualization Graphs for Economy and Business Concept
00:11
HD
Abstract digital graphic showing downward trend chart composed of tiny colored squares on dark grid background
00:08
HD
Graph of Up and Down Stock exchange Market, sign with green and red arrows vector
00:04
HD
Hand drawing business diagram concept about increasing efficiency, quality and speed but decreasing cost arrow. Performance concept of increase quality, speed, efficiency and reduce cost.
00:10
HD
Bar graph crash animation showing market decline and failure
00:10
HD
Chili pepper level indicator scale. Low normal & high meter infographic animation on white background. Showing high chili pepper level color gauge indicator for food cooking and scoville scale.
00:10
HD
Business graph getting down, Down growth business icon on transprent background.
00:08
HD
Racing Aero Transparent Channel. Arrow Racing Clear Channel, Business Growth Arrows And Graph Charts, Business Line Arrow Sales Profit Increasing To Futures. on black background
00:10
HD
The Inflation Sign in Sky
00:10
HD
Negative red line graph falling down due to low prices and market recession. Concept of crisis, crash, risk and economy danger. Downtrend dynamic chart of prices drop. 4k Motion graphic
00:10
HD
Money Decline Animation, Cash Down Arrow Graph, Stock Market Crash Concept, Financial Loss Motion Graphics, Market Downtrend
00:10
HD
Recycling symbol made from green leaves forming smoothly in animation
00:08
HD
Abstract increase icon on black background. Dollar rate up looped icon. Reduce costs sign and symbol. motion video 4k quality..
00:06
HD
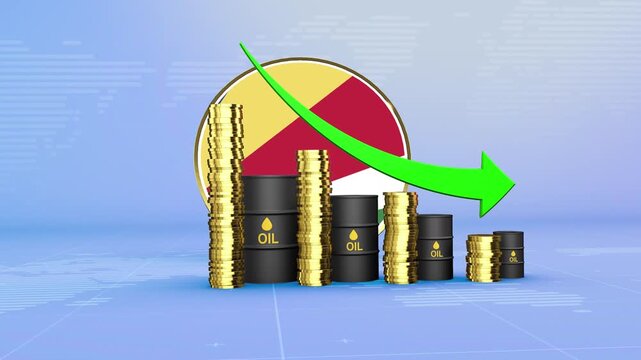
Seychelles Oil Prices Decline with Oil Barrels, Gold Coins and Downward Green Arrow, 3D Economic and Financial Market Concept
00:11
HD
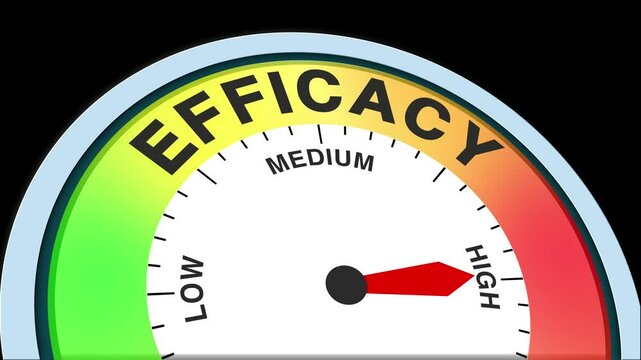
Efficacy Level Text or Word Low and Medium to High Meter Concept Animation on Black Background and Blue Screen
00:58
HD
Innovation Meter Animation: Measure and Compare Innovation from Low to High Levels with Dynamic Increasing and Decreasing Gauge for Data Visualization, Performance, and Motion Graphics
00:10
HD
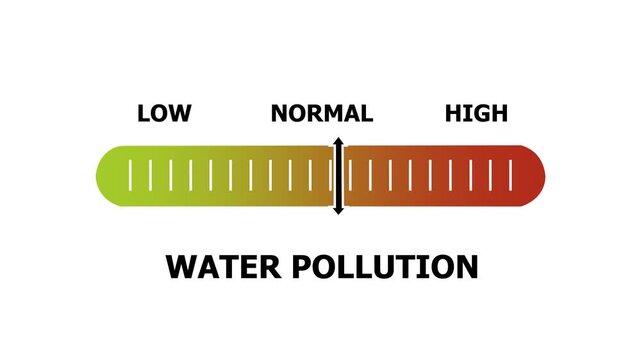
water pollution level indicator scale. Low normal & high meter infographic animation. Showing high water pollution level color gauge indicator. on a white background 4k animation video
00:10
HD
Business growth and success arrow, growing business chart animation with dollar sign.
00:10
HD
Dynamic price movement arrows indicating imminent change
00:08
HD
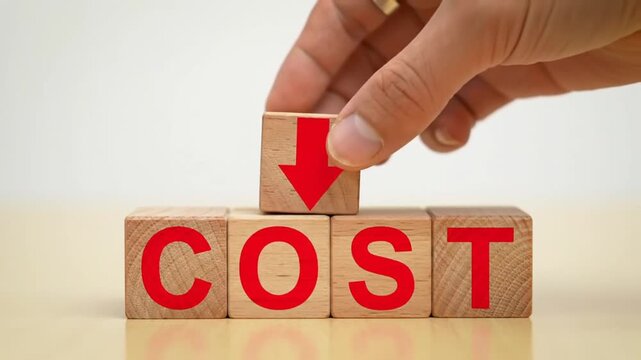
Hand Placing Cost Down Arrow Block on Wood Blocks for Savings Concept
00:08
HD
Greece Oil Price Falling with Oil Barrels Downward Green Arrow and 3D Financial Data Visualization Graphs for Economy and Business Concept
00:11
HD
Profit high growth percent icon, stocks, financial, Interest rate and dividend concept, Futuristic raise arrow chart digital transformation abstract technology background
00:10
HD
No Return text symbol animation on black background. not allowed and ban animation concept. 4k video
00:11
HD
Battery Discharge and Power Consumption video motion - ideal for tech articles, energy efficiency blogs, power management infographics, and app UI/UX design
00:10
HD
Animated adrenaline level meter decreasing from normal to low level, for concept.3d video white background.
00:10
HD
Urgency level indicator scale. Low normal & high meter infographic animation on black background. Showing high urgency level color gauge indicator for task priority time management and workflow.
00:10
HD
glowing neon Percentage growth and decline icon with up and down arrows. financial, business, and statistical analysis. Up and down percentage arrows icon. Perfect for reports and dashboards.
00:10
HD
Abstract decreasing business graph chart animation. Animated down graph icon designed in flat icon style. Growing financial statistics graph animation, motion graphic about business infographic .
00:10
HD
Hand-Drawn Up Down Arrow Direction 2D Animation on Green Screen
00:06
HD
Graph Going down animation. Financial business Loss down graph chart. business loss concept. 4k video.
00:08
HD
business loss graph falling down economic crisis animation
00:15
HD
Neon blue recycling symbol with arrows on a black background, conveying eco-friendly and sustainable practices.
00:10
HD
market sentiment level indicator scale. Low normal high meter infographic animation on black background. Showing high pressure level color gauge indicator.4k animation video
00:10
HD
Burundi Crude Oil Price Decline with Oil Barrels and Downward Green Arrow
00:11
HD
Financial data opening and filling, red wedge rising and ribbons undulating showing market trends
00:12
HD
Brand Value Meter Animation: Track and Compare Brand Value from Low to High Levels with Dynamic Increasing/Decreasing Gauge for Data Visualization, Performance, and Motion Graphics
00:10
HD
urgency level indicator scale. Low normal & high meter infographic animation. Showing high urgency level color gauge indicator. on a black background 4k animation video
00:10
HD
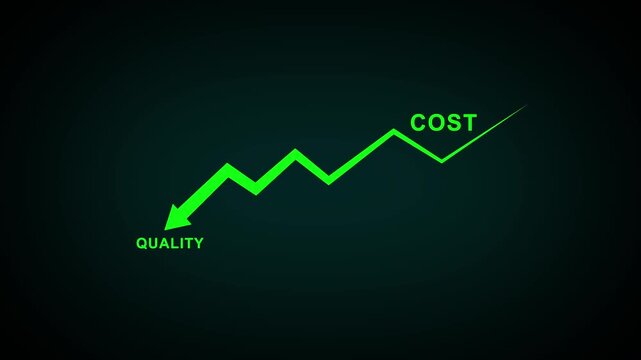
Quality increase and cost optimization for products or services to improve customer satisfaction and enhance company performance. Successful corporate strategy and management. Effective business.4k
00:10
HD
Futuristic Virtual Reality Experience with User Interacting with House and Percentage Symbols for Real Estate Concept Sigmoid
00:15
HD
Declining Bar Chart with Downward Arrow Representing Financial Loss and Economic Downturn.
00:11
HD
Bolivia Crude Oil Price Drop with Oil Barrels Downward Green Arrow and 3D Financial Data Visualization Graphs for Economy and Business Concept
00:11
HD
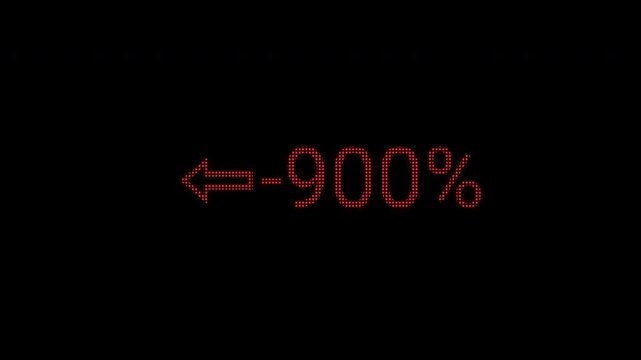
Minimalist Pixel Negative Number Progress. Animated 0 to -900% Counter for Economic Loss Infographics
00:07
HD
3d animation of a red arrow pointing down. The concept of devaluation of currencies an pile of coins.
00:16
HD
Real estate with declining arrow
00:08
HD
Potassium K indicator scale. Low normal high meter infographic animation on black background. Showing high potassium k level color gauge indicator for nutrition and electrolyte health monitoring.
00:10
HD
Decreasing New Zealand Dollar exchange rate indicator. NZD forex ticker loopable 3D animation
00:05
HD
Quality control and company cost reduction. Balancing Quality and Cost in Strategic Decision Making for Optimal Business Performance and Sustainability.4k video
00:10
HD
Animation of pattern moving to center and disappearing. Motion. Computer background with animation of moving arrow pattern. Arrow pattern moves in waves to center and disappears
00:17
HD
a prominent yellow recycling symbol, composed of three arrows forming a continuous loop, symbolizing environmental sustainability
00:08
HD
Graph Going down animation. Financial business Loss down graph chart. business loss concept. 4k video.
00:08
HD
Neon Glowing Financial Loss Animation, Dollar Sign Currency with Downward Arrow, Economic Recession Icon, HD Motion Graphic with Alpha Channel
00:10
HD
Reduced Inequality with hologram businessman concept
00:15
HD