設定密碼的連結已經傳送至: 日後若要存取您的購買項目,您將需要使用密碼。
免費試用即可取得 3 部影片或 25 張影像
已新增篩選器
排序方式:

在影片中找到 60 個「computer dashboard」的結果

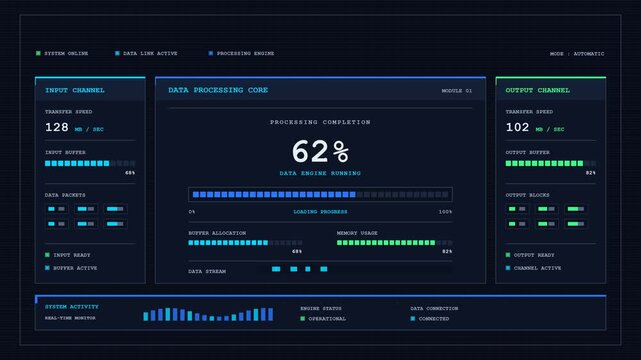
Retro Computer HUD Data Processing Animation with Terminal Panels, Scanning Indicators and Digital System Readouts
00:10
HD
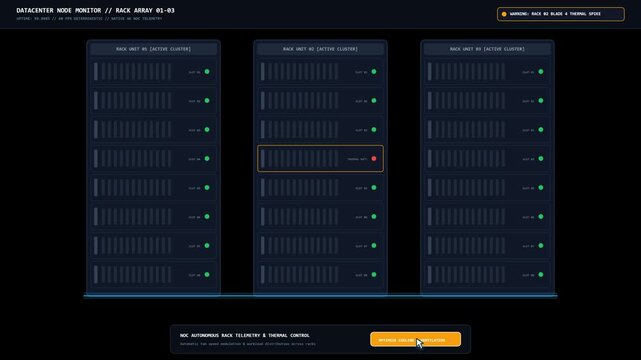
Datacenter Server Rack Monitor Dashboard Thermal Warning Animation
00:15
HD
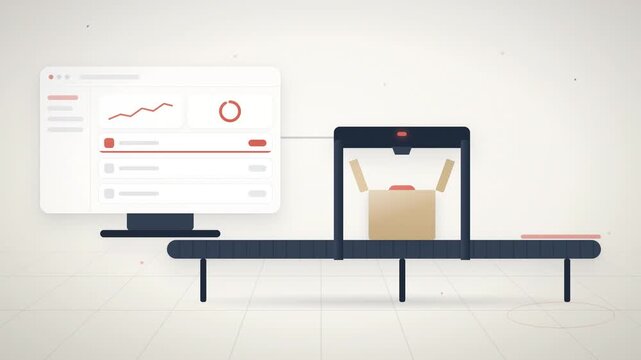
Ecommerce order fulfillment conveyor belt package scan seamless loop
00:10
HD
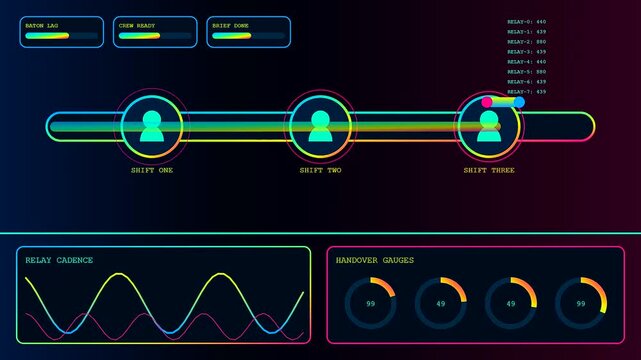
Shift scheduler display presents dynamic tracking of personnel cycles with animated progress bars glowing neon circles and fluctuating waveform graphs on a dark digital interface screen
00:06
HD
A broadcast switcher display shows multiple circular data indicators with fluctuating pink and blue frequency bars moving in real time across three separate dark digital interface screens
00:06
HD
Digital engagement analytics dashboard displayed on screen shows changing circular gauges and fluctuating numerical data metrics across three separate views of an interface for user monitoring
00:06
HD
Data analyst delves into big data insights on a computer dashboard.
00:10
HD
Futuristic Data Analytics Dashboard with Digital Charts and Business Intelligence Interface
00:11
HD
Young Female Engineer in Headset Sits at Desk, Monitoring Automated Robotic Arms Through Multiple Screens With Glowing VFX Charts, Holograms, and Production Data Analytics. Concept of Industry 4.0.
00:12
HD
Neon Blue Financial Budgeting Calculation Chart Analysis and Performance Monitoring Motion Graphic
00:10
HD
Faceless analyst using computer and dashboard for data business (2)
00:10
HD
Compute latency diagnostic dashboards showing signal decay metrics and fading wave patterns with neon graphical user interface elements set against a deep dark black backdrop
00:06
HD
Digital displays showcasing probability modeling through green mathematical charts and statistical bar graphs rendered in a sequence of frames on a dark interface background screen
00:06
HD
Animated Flat Vector Computer Screen Displaying Data Analytics Dashboard and Cloud Security File Network
00:07
HD
A digital predictive analytics display showing circular colorful bar graphs changing values on a dark interface representing modern software data visualization for finance and market tracking
00:06
HD
AI Assistant Helping Businesswoman Manage Schedule and HR Tasks cartoon animation
00:10
HD
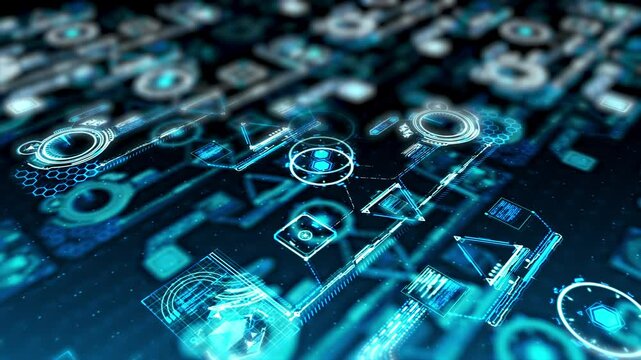
Technological Infographic. Computer Readings, Data Flow Calculating. IT HUD Computer Measurements. IT Technology on Virtual Screen. Control Panel.
00:40
HD
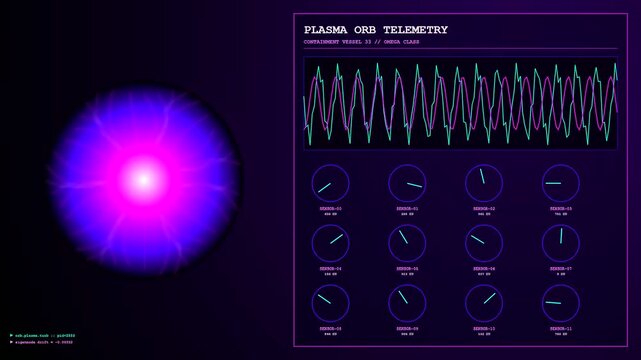
the plasma turbulence in a digital monitoring display shows shifting energy patterns within an containment chamber during a sequence of simulated scientific research data analysis
00:06
HD
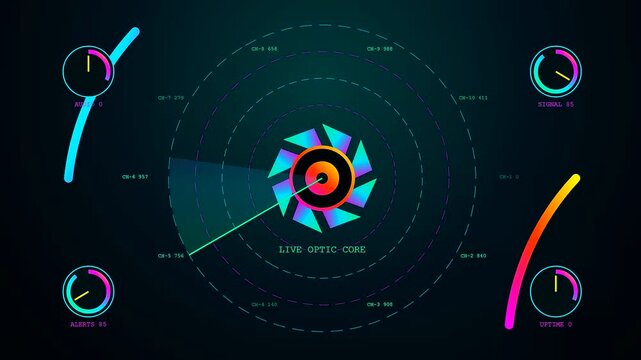
A digital streamer dashboard with animated circular gauges and rotating central core elements tracking live network data flows across multiple synchronized screens in a dark room
00:06
HD
User Professional Character Working with Digital Software Application and Data Analytics 2D Animation
00:10
HD
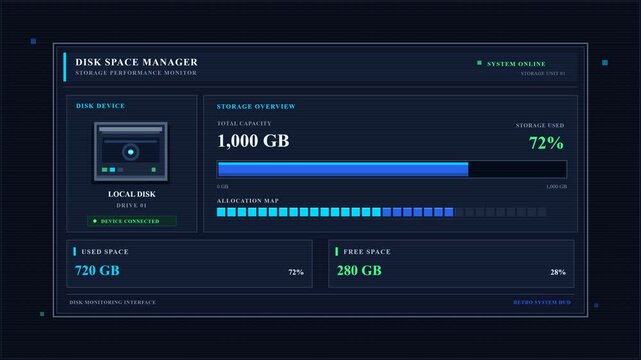
Retro Disk Space Dashboard Animation Showing Storage Capacity, Used Space and Available Drive Resources in a Classic Computer Interface
00:10
HD
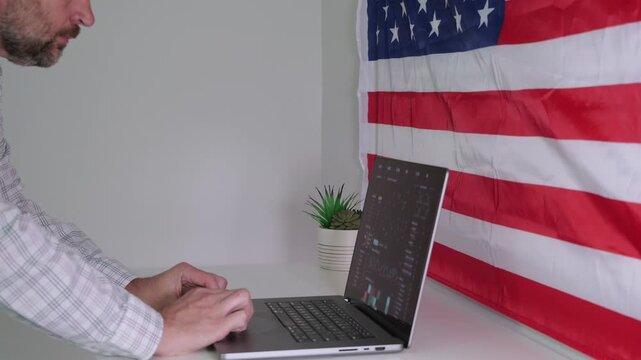
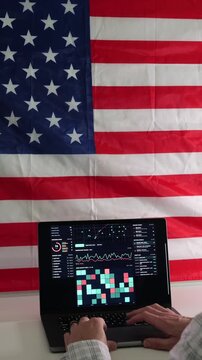
Man working on laptop displaying surveillance tracking dashboard in front of American flag, representing digital privacy and Fourth Amendment rights
00:18
HD
"Green Tech HUD Interface Animation – Futuristic Digital System Dashboard Loop"
00:10
HD
A digital shift scheduler interface displayed across three monitor panels showing data metrics pulsing green and magenta with glowing circular avatars and fluctuating bar graph indicators
00:06
HD
Complex sentiment analysis interface displaying glowing circular graphic metrics and radial radar sweep animations on a dark digital monitor for advanced data evaluation and system monitoring
00:06
HD
Neon Monitor Icon with Gear Representing System Settings, Configuration, Technical Support, and Computer Optimization Tools with a black background.
00:10
HD
Data analyst leveraging a computer dashboard to extract AI-driven insights in a modern office setting.
00:10
HD
Pink and Cyan Neon Computer Dashboard Icon Animation with Business Statistics and Bar Chart
00:10
HD
Retro System Configuration Panel with Structured Settings, Status Indicators, and Green Technical Readouts on a Dark Screen
00:10
HD
Data Processing Diagnostics Dashboard with Technical Status Indicators, Green Progress Bars and System Performance Monitoring Panels
00:10
HD
a digital shift scheduler interface displayed on three screens shows duty assignments for crew members with glowing neon data bars and live tracking information
00:06
HD
Displaying recovery analytics in a digital dashboard interface showing changing fluid levels and wave charts on a dark screen representing modern medical software user interface
00:06
HD
A digital penetration testing interface displays network nodes changing connections in real time with glowing neon lights and oscillating wave graphs on a dark screen
00:06
HD
Faceless analyst using computer and dashboard for data business (3)
00:10
HD
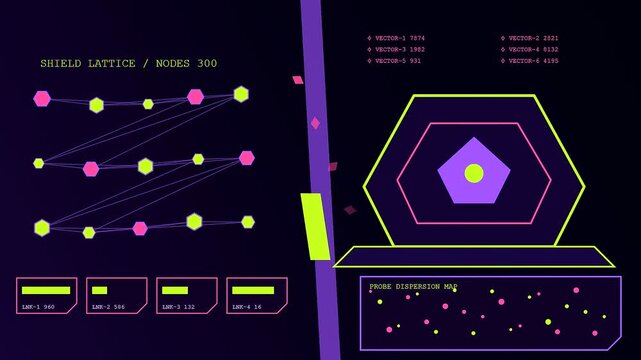
Signal shielding interface displays geometric data patterns evolving through three sequential panes showing network node connections and pulse wave activity in a dark digital environment
00:06
HD
A futuristic digital radar interface visualizes port congestion by tracking ship positions and monitoring anchorage queue waiting times on a stylized dashboard.
00:06
HD
A digital AI Medical Diagnostics interface displays real time human pulmonary breath analytics with shifting graphs and vital organ monitoring metrics across a seamless motion video loop
00:06
HD
A service mesh diagram visualizes complex network traffic metrics in a modern digital interface with shifting line charts and evolving growth patterns over time
00:06
HD
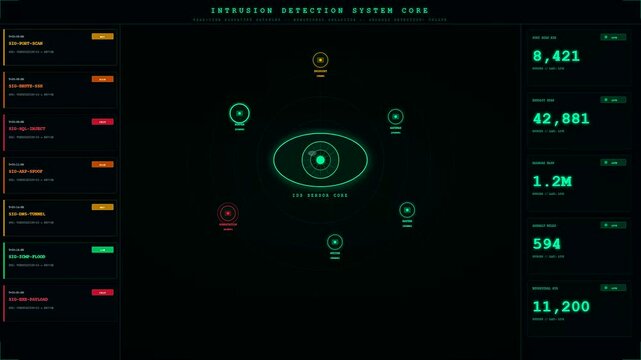
A vibrant cybersecurity threat map displays digital intrusion patterns within a complex interface showing fluctuating data metrics during a simulated network attack on dark screen
00:06
HD
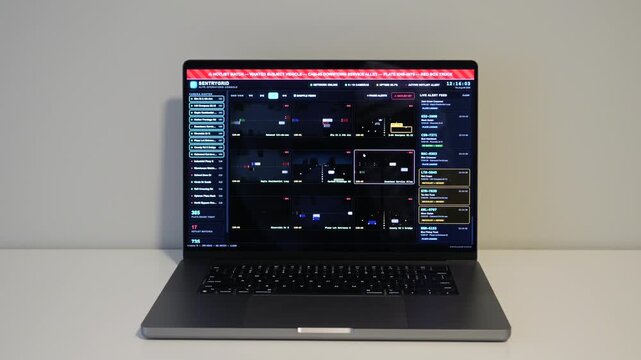
Investigator Detective on laptop using automated license plate reader software to track vehicle locations, illustrating law enforcement surveillance
00:29
HD
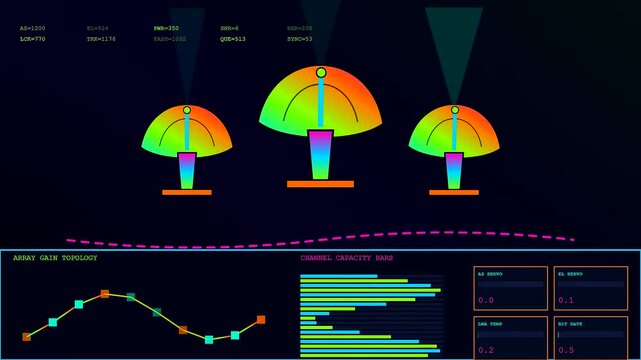
A sophisticated display of defence telemetry features moving satellite dishes with dynamic charts and glowing data curves captured on a dark digital interface screen in motion
00:06
HD
Man working on laptop displaying surveillance tracking dashboard in front of American flag, representing digital privacy and Fourth Amendment rights
00:25
HD
Investigator Detective on laptop using automated license plate reader software to track vehicle locations, illustrating law enforcement surveillance
00:34
HD
Investigator Detective on laptop using automated license plate reader software to track vehicle locations, illustrating law enforcement surveillance
00:31
HD
Investigator Detective on laptop using automated license plate reader software to track vehicle locations, illustrating law enforcement surveillance
00:17
HD
Man working on laptop displaying surveillance tracking dashboard in front of American flag, representing digital privacy and Fourth Amendment rights
00:14
HD
Man working on laptop displaying surveillance tracking dashboard in front of American flag, representing digital privacy and Fourth Amendment rights
00:20
HD
A Predictive Analytics Graph visualizes complex data processing through glowing magenta nodes and rotating green circular elements in a dark futuristic digital computer interface simulation.
00:06
HD
An abstract motion graphic demonstrating global port congestion with simulated vessel tracking data and rising economic trade delays on a dark radar display.
00:06
HD
A digital Organoid Growth Monitoring interface tracks complex molecular structures and genetic mutations within a high tech laboratory environment displayed across a series of three data screens
00:06
HD
Man working on laptop displaying surveillance tracking dashboard in front of American flag, representing digital privacy and Fourth Amendment rights
00:20
HD
A digital AI Bias Auditing interface display shows increasing threat levels with glowing neon triangle geometric graphics emerging across dark screens to visualize complex algorithmic risk data
00:06
HD
Signal shielding interface displays moving bars and glowing light nodes on a dark digital monitor screen showing data fluctuations in a virtual finance analytical environment
00:06
HD
Investigator Detective on laptop using automated license plate reader software to track vehicle locations, illustrating law enforcement surveillance
00:24
HD
Neon Monitor Icon with Gear Representing System Settings, Configuration, Technical Support, and Computer Optimization Tools with a black background.
00:10
HD
Neon Monitor Icon with Gear Representing System Settings, Configuration, Technical Support, and Computer Optimization Tools with a black background.
00:10
HD
Man working on laptop displaying surveillance tracking dashboard in front of American flag, representing digital privacy and Fourth Amendment rights
00:34
HD
Investigator Detective on laptop using automated license plate reader software to track vehicle locations, illustrating law enforcement surveillance
00:16
HD
Investigator Detective on laptop using automated license plate reader software to track vehicle locations, illustrating law enforcement surveillance
00:27
HD
Investigator Detective on laptop using automated license plate reader software to track vehicle locations, illustrating law enforcement surveillance
00:26
HD