設定密碼的連結已經傳送至: 日後若要存取您的購買項目,您將需要使用密碼。
免費試用即可取得 3 部影片或 25 張影像
已新增篩選器
排序方式:

在影片中找到 1,566 個「candlestick vector」的結果

Rising stock market chart with glowing candlesticks, financial growth and bullish trading trend, digital investment concept with bright light animation
00:08
HD
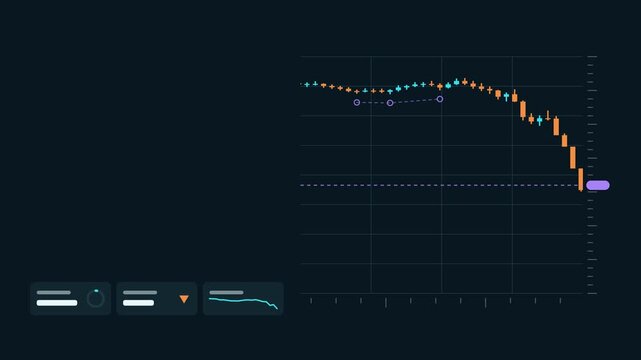
Animated coral colored minimal dashboard user interface layout with financial candlestick charts, matrix scatter plots, and clean monitoring widgets.
00:07
HD
Minimalist financial candlestick chart pattern isolated on a black background
00:10
HD
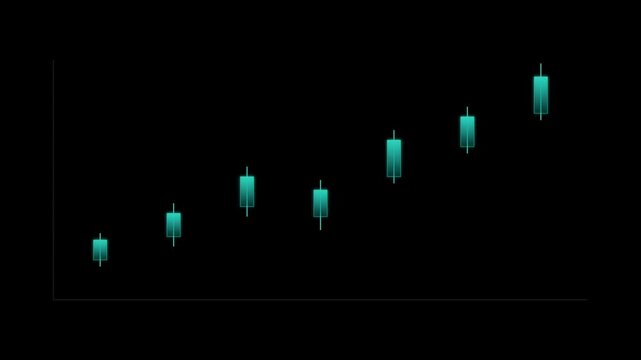
Futuristic cyan candlestick chart for financial trading and stock market analysis on dark background. Glowing vector illustration for business and investment strategies
00:10
HD
Financial stock market candlestick chart analysis for trading analytics data visual.
00:10
HD
Green candlestick stock market chart showing financial data and price trends over time
00:10
HD
Flat vector style Hanukkah menorah nine blue candles with animated flickering golden flames against a transparent background
00:15
HD
Financial candlestick chart with a yellow trend line represents stock market trading on a dark background.
00:10
HD
Glowing cyan candlestick stock market chart for financial trading data analysis 4k video
00:08
HD
Seamless 4K looping finance animation: candlestick chart rising upward motion. Flat vector trading terminal with grid, axis ticks and blank readout cards in deep blue on a deep dark background, leavin
00:07
HD
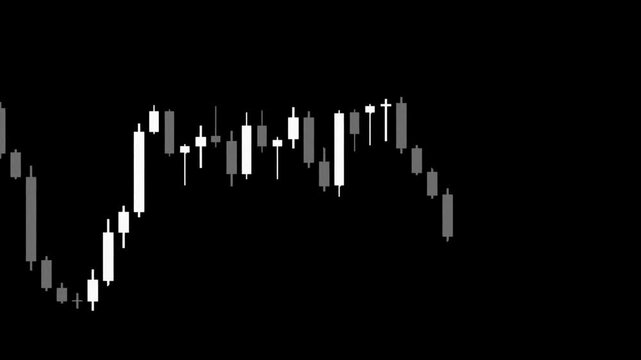
Minimalist black and white stock market candlestick chart animation with looping price fluctuations
00:07
HD
Minimalist candlestick chart drawing with a pencil
00:05
HD
Financial candlestick chart showing stock market trading trends and investment growth fluctuations over time with motion graphics
00:10
HD
Stock market candlestick chart vector illustration. Features green and red trading bars on dark background. Financial analytics graphic for stock exchange and investment analysis.
00:15
HD
Global market candlestick trend animation, Earth globe on left with ascending blue candlestick stock chart
00:10
HD
Digital stock market candlestick chart with glowing neon lines showing financial data analysis on a overlay background for business and investment
00:07
HD
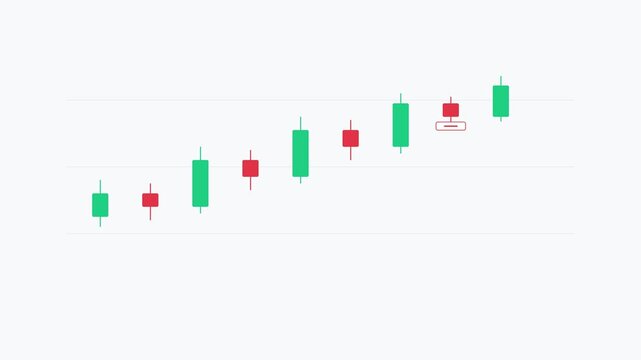
Financial candlestick chart with green and red bars indicating market fluctuations, growth, and decline, presented as a flat vector graphic on a grid.
00:10
HD
Financial stock market trading candlestick chart vector animation with upward green trend line and data statistics.
00:10
HD
Stock market candlestick chart on dark digital screen. Features financial data graphs and indicators for trading analysis. Digital background for finance investment and economy.
00:08
HD
Minimalist stock market candlestick chart with blue background and financial indicators
00:16
HD
Digital stock market candlestick chart loop
00:10
HD
Three variations of dynamic pricing represented by oscillating candlestick charts displaying fluctuations in market value against a stark black void for financial data analysis
00:06
HD
Glowing green financial stock market candlestick chart showing price movement trends and technical data analysis on a overlayTransparent  background
00:20
HD
A financial candlestick chart showing an upward market trend on black background
00:10
HD
Animated financial candlestick chart with glowing wave on dark digital background.
00:10
HD
Financial stock market candlestick chart showing a bullish upward trend for crypto or stock trading
00:10
HD
Stock market trading animation with red candlestick chart, price volatility, financial trend analysis, investment activity and digital fintech business intelligence background video
00:08
HD
Digital stock market chart showing fluctuating green and red candlestick patterns on a dark blue background to represent financial trading trends and volatility for global investment analysis.
00:10
HD
Set of eight candlestick stock market charts showing financial trading trends on dark blue background
00:10
HD
Seamless 4K looping finance animation: candlestick with average smooth overlay. Flat vector trading terminal with grid, axis ticks and blank readout cards in teal and cyan on a deep dark background, l
00:07
HD
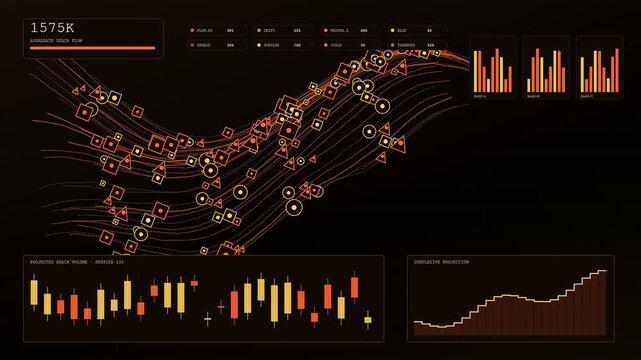
A digital reach projection interface shows animated geometric shapes flowing along glowing line paths with candlestick charts fluctuating on a dark screen during system data monitoring
00:06
HD
Green financial candlestick chart market motion footage showing digital stock exchange growth analysis with glowing neon particles and grid lines
00:05
HD
Flat vector trading chart covering the entire video frame on solid dark navy background with faint grid: varied green candlesticks appearing one by one from left to right showing a bull market rising
00:06
HD
A financial candlestick chart displaying market trends on a black background
00:10
HD
Global market candlestick trend animation, Earth globe on left with ascending blue candlestick stock chart
00:10
HD
Financial stock market chart animation showing bullish candlestick growth and live price action movement video footage
00:08
HD
Stock market candlestick chart vector illustration. Features green and red trading bars on dark background. Financial data analysis graphic for investment and trading platform interface.
00:15
HD
Bullish engulfing candlestick pattern with upward arrow on black background
00:05
HD
Minimalist digital candlestick chart isolated on a deep black background
00:10
HD
Bearish candlestick chart showing downward trend in stock market trading vector illustration
00:08
HD
Isometric glowing blue trading table visualization with financial stock market candlestick charts in background
00:10
HD
Stock market candlestick chart with glowing financial data graphics on a dark digital background
00:10
HD
Glowing red and blue candlestick stock market chart showing financial data fluctuations and trading activity on a dark background
00:05
HD
Minimalist financial candlestick chart showing stock market trends and volatility
00:10
HD
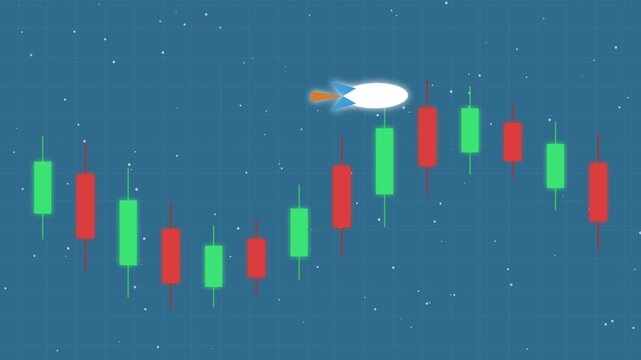
Crypto rocket soaring past candlestick charts in space showing financial growth.
00:15
HD
Red stock market candlestick chart showing a wavy financial trend on a dark black background
00:10
HD
A digital predictive analytics display shows neon financial candlestick charts flickering across three panels to illustrate real time market fluctuations in a dark electronic trading interface
00:06
HD
Abstract portrayal of a financial cityscape featuring dynamic stock market candlestick charts with green and red colors against a dark background
00:10
HD
Set of eight candlestick stock market charts showing financial price fluctuations in dark mode
00:12
HD
Seamless 4K looping finance animation: candlestick zoom view close up. Flat vector trading terminal with grid, axis ticks and blank readout cards in teal and cyan on a deep dark background, leaving co
00:07
HD
financial candlestick chart animation showing market volatility, rising trends and stock price fluctuations with dashed support line
00:10
HD
Abstract financial market candlestick chart with cyan and pink bars
00:15
HD
Animated candle flame burning on candlestick with white line drawing style isolated on black background for motion graphic.
00:16
HD
Minimalist candlestick chart showing price movement on a black background
00:10
HD
Global market candlestick trend animation, Earth globe on left with ascending blue candlestick stock chart
00:10
HD
Global financial stock market charts fluctuate dynamically over a glowing digital world map background, illustrating international economic activity.
00:40
HD
Stock Market Trading Chart.
00:10
HD
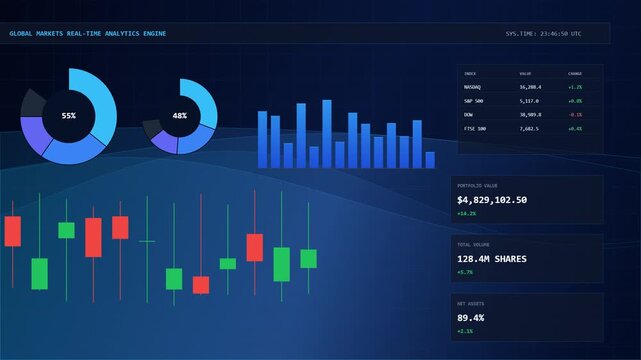
Animated financial dashboard UI featuring candlestick stock charts, pie charts, market indexes, and real-time analytics data.
00:07
HD
Animated male trader analyzing stock market candlestick charts and financial data on laptop computer
00:07
HD
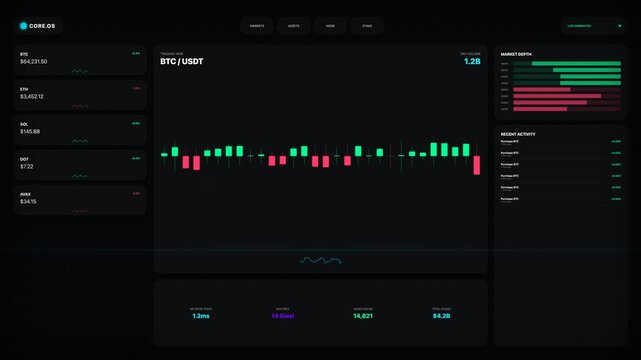
Bullish stock market trading animation with rising candlestick chart, investment growth, financial performance, market trends and digital fintech business analytics background video
00:08
HD
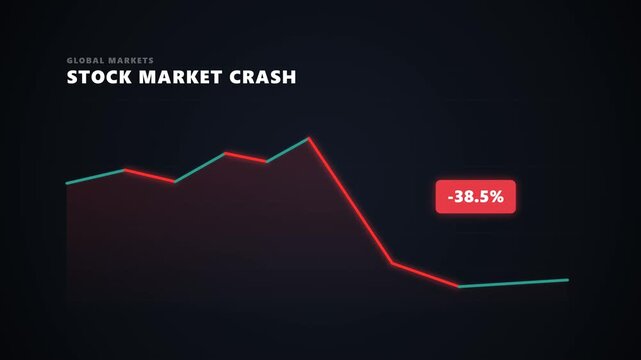
A clean, minimalist vector motion graphic animation of a stock market crash with a simple continuous chart line (green for uptrend, red for downtrend) without any arrowheads.
00:05
HD
financial stock market candlestick chart vector animation
00:29
HD
Flat vector animation showing a smartphone with a financial market chart connected to analytics icons for trading, investment, market analysis, and performance tracking.
00:10
HD
Futuristic Market Volatility Candlestick Chart Animation
00:12
HD
Digital candlestick stock market chart with glowing trend line on dark background.
00:10
HD
Animated stock market candlestick chart on white background showing financial data trading fluctuations. High quality motion graphics for business and investment concepts.
00:11
HD
Abstract financial trading background with glowing green candlestick chart and wavy lines.
00:10
HD
Animated stock market candlestick chart, financial trading data analysis, moving averages loops, forex business graph concept
00:10
HD
Set of eight candlestick financial charts showing stock market volatility and trading patterns on dark background
00:20
HD
Seamless 4K looping finance animation: candlestick with volume bars below. Flat vector trading terminal with grid, axis ticks and blank readout cards in deep blue on a deep dark background, leaving co
00:07
HD
Digital financial candlestick chart stock market data analysis graphic template
00:15
HD
Abstract digital representation of financial market data with candlestick chart patterns on a dark background.
00:10
HD
Digital financial dashboard with candlestick charts and data metrics
00:10
HD
a financial candlestick chart on a dark background featuring green and red candles alongside a turquoise trend line, representing price action in stocks, forex, or cryptocurrency
00:05
HD
Global market candlestick trend animation, Earth globe on left with ascending blue candlestick stock chart
00:10
HD
Digital candlestick financial chart showing stock market price growth trends 4k video
00:07
HD
Abstract financial chart with glowing candlesticks and data points on dark background
00:08
HD
A digital dynamic pricing dashboard with glowing candlestick charts fluctuating in real time across three separate user interface panels showing shifting market trends and financial data activity
00:06
HD
4K motion graphic of candlestick charts with alpha channel transparency. 2D cartoon animation of day trading stock, data visualization, on white background.
00:08
HD
Bullish stock market trading animation with rising golden candlestick chart, investment growth, financial performance, market trends and digital fintech business analytics background video
00:08
HD
Financial candlestick chart showing an upward trend in stock market trading data.
00:07
HD
Animated financial chart with green and red candlestick bars moving on a dark grid background
00:10
HD
Business candlestick OHLC chart animated seamless loop alpha
00:12
HD
Algorithmic trading interface displaying complex financial candlestick patterns and neon wave oscillation charts on a dark digital screen to visualize real time market price volatility fluctuations
00:06
HD
Financial market stock trading graph with glowing candlestick chart digital overlay.
00:10
HD
Support and Resistance. Technical Analysis Candlestick Chart Animation Showing Sideways Ranging Market Consolidation. Ideal for educational video content, trading courses, stock market, forex, and cry
00:20
HD
Animated Last Day of Hanukkah Menorah Candle Celebration
00:05
HD
Minimalist representation of two candlestick charts on a dark background
00:10
HD
Set of eight candlestick stock market charts with fluctuating financial data on a dark background
00:15
HD
Seamless 4K looping finance animation: candlestick pattern view highlighted group. Flat vector trading terminal with grid, axis ticks and blank readout cards in green and emerald on a deep dark backgr
00:07
HD
Digital candlestick charts displaying financial market trends with glowing green and red indicators on a dark background with future
00:10
HD
Moving Average Golden Cross Bullish Crossover Candlestick Momentum Rally Chart Animation 10 Seconds Loop in 4K UHD
00:10
HD
Stock market growth animation featuring a rising arrow and dynamic candlestick chart on a white background. Concept of financial success, trading profit, forex market analysis,
00:05
HD
Stock market candlestick chart financial trading background showing stock
00:15
HD
Global market candlestick trend animation, Earth globe on left with ascending blue candlestick stock chart
00:10
HD
Financial Stock Market Bullish Trend Candlestick Chart and Bull Alpha Channel Animation.
00:06
HD
Dark modern crypto trading dashboard interface with animated candlestick charts, suitable for fintech apps, trading tutorials and market analysis
00:10
HD
Financial Stock Trading App Interface with Candlestick Chart and Successful Buy Order Execution Notification, Minimal Vector Animation Loop
00:12
HD
4k abstract grey light candlestick chart concept. Business male animated background. Silver seamless looping pattern. Square shapes, metallic striped texture. Technology white banner. Geometric trendy
00:09
HD
Digital stock market candlestick chart animation displaying crypto forex trading technical analysis with green red bars on dark cyber background.
00:08
HD