
Telemetry Overlay 04
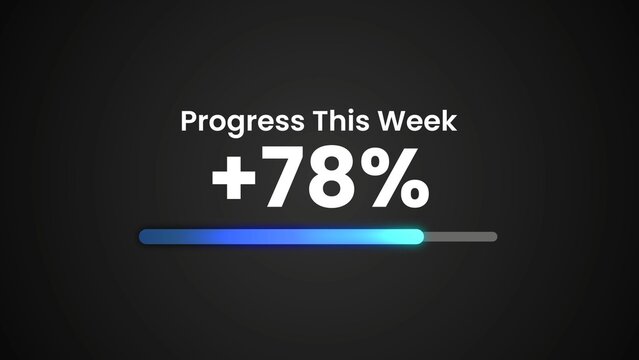
Clean Professional Value Number Increase Kinetic Title

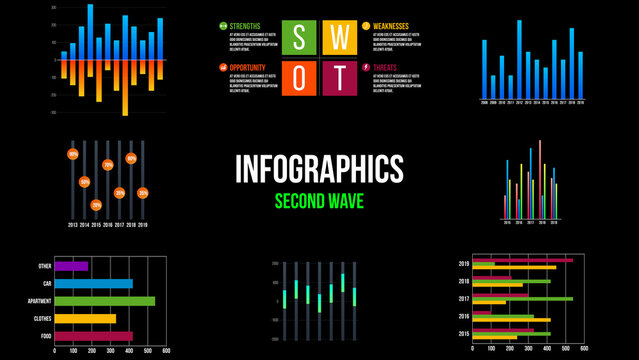
Bento Box Business Infographic Template For Dashboard Report, KPI Metrics, Data Visualization
Informational Corporate Presentation Titles

Blue Clean Fintech Invoice And Letterhead

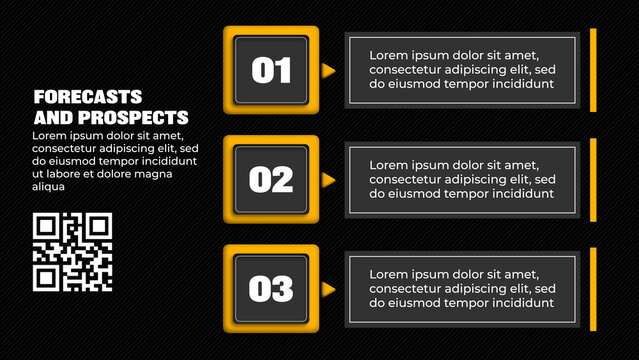
Timeline Infographic Template

Modern AI Dashboard UI Wireframe Design with Analytics Panels and Data Visualization Layout
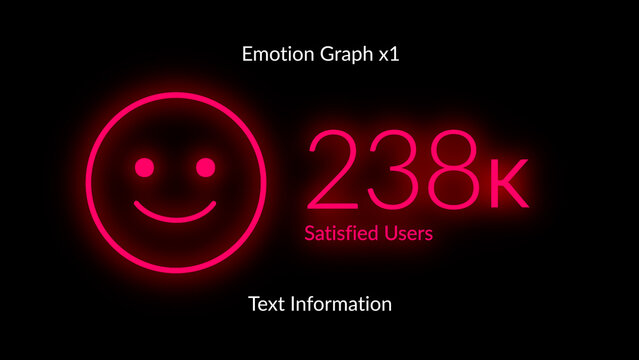
HUD Neon Icon Graph Emotion x1
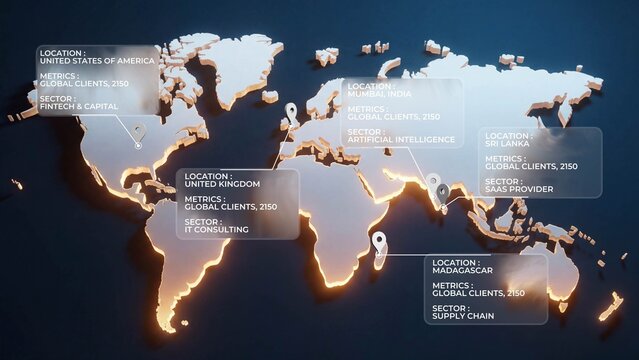
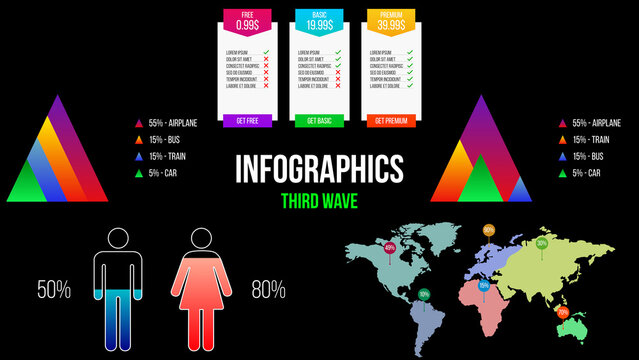
World Map Data Visualization

Futuristic Neon Oval Blue Five Steps Infographic Template
8 Infographics Elements

Business Growth Infographic Template with Abstract Minimalist Illustration

Blue Dawn - Particle Cinematic Titles

Account Service Dashboard

Infographic Design Template Layout

Professional Corporate Funnel Chart Infographics for Business Marketing Strategy

Data Analytics Management Dashboard
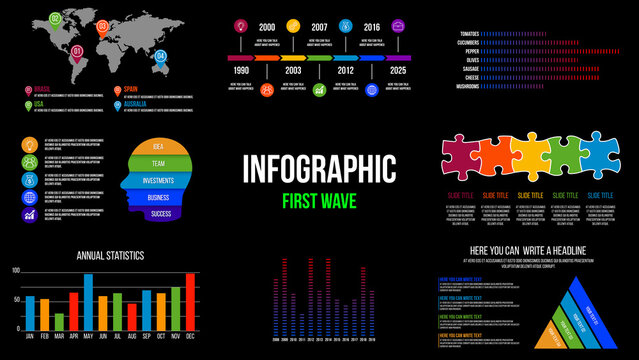
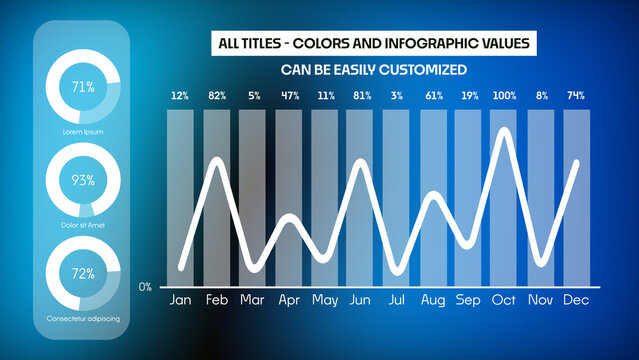
Corporate Infographics Template | Dynamic Data Visualization, Business Marketing and Statistical Graphs for Presentations

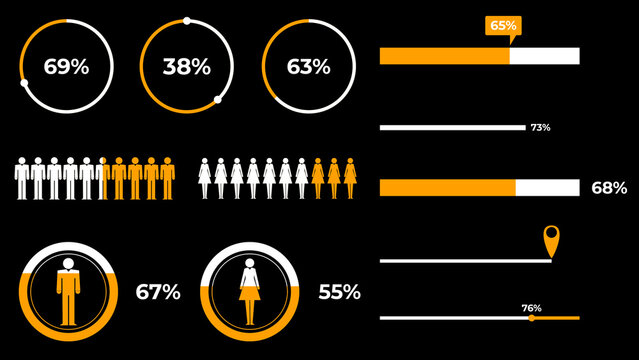
Editable Professional Business Infographic Elements Template for Data Visualization and Corporate Reports in White and Blue Theme.

Widget Style Infographic

Telemetry Overlay 06

Clean Professional Value Number Increase Kinetic Title

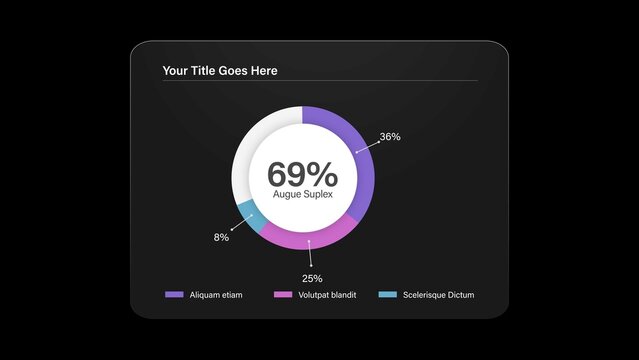
Donut Doughnut Chart Infographic Template

Corporate Presentation Information Titles

Daily Time Use Infographic

Minimal Roadmap Infographic Template
Dark Purple and Multicolor Business Infographic Data Analysis Infographic
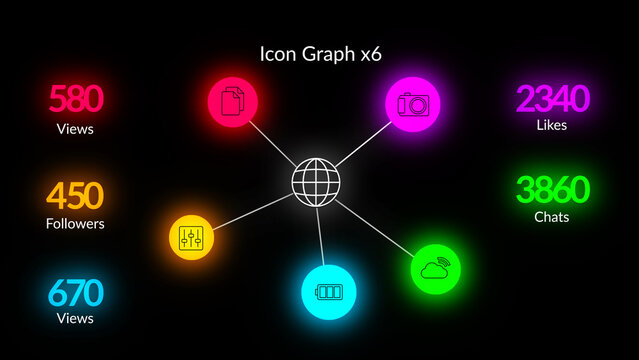
HUD Neon Icon Graph Bubbles x6
Circular Scale Comparison Infographic
Colorful Modern Infographic Diagram with Six Interlocking Loops on Black
5 Infographics Elements
Business Growth Strategy Plan Infographic Template
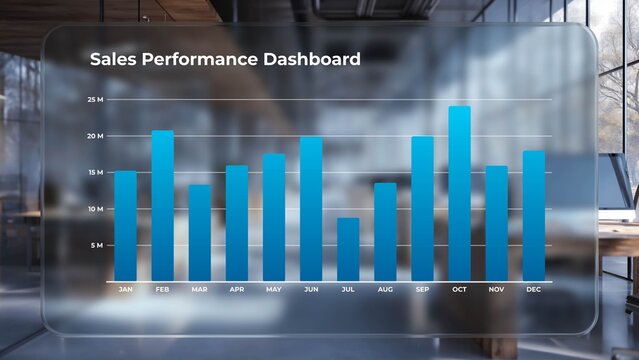
Corporate Glass Bar Chart
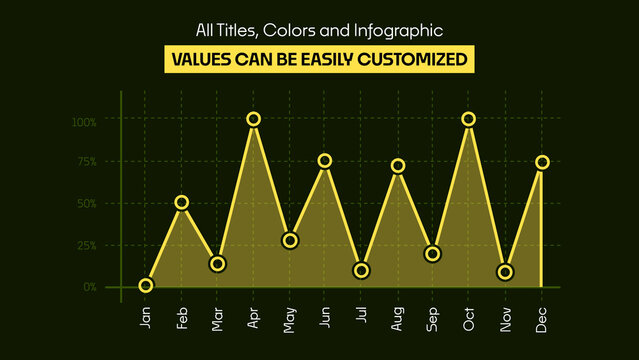
Editable Chart Design with 6 Months Option
Data Visualization Kit | With Control Panel for every Scene
Blue Sales Funnel Infographic for Marketing and Business Analysis
Cyber Security Dashboard UI Design
Corporate Infographics
Bright Infographic Layout with Simple Graphics
Modern Analytics Dashboard UI Kit Wireframe Design

Telemetry Overlay 09

Clean Professional Value Number Increase Kinetic Title
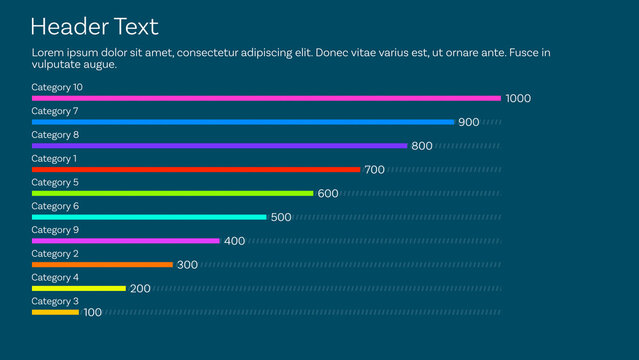
Bar Graph Infographic Template
Sales Dashboard Template
Mobile App Interface Display Mockup PSD
Roadmap Infographic Layout
Big Data Website Hero Image Layout with Rays Concept
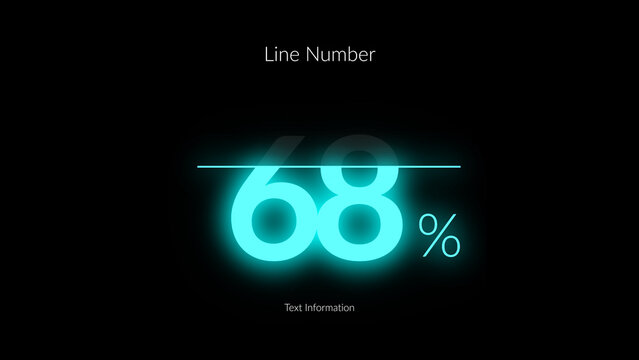
HUD Neon Infographics Line Number x1
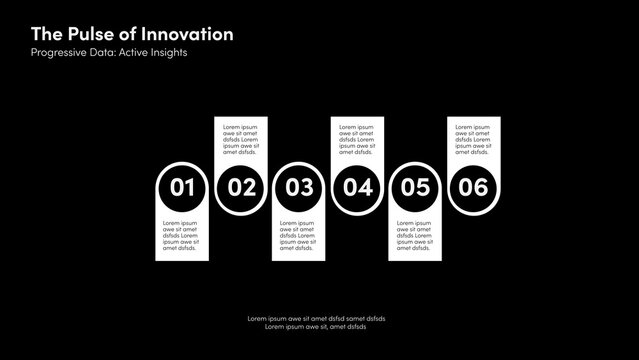
Six Parts Cycle Infographic
Modern Business Infographic Template with Connective Workflow Chart and Photo Placeholders
8 Infographics Elements
Business Strategy Infographic Template with Ribbon Layout
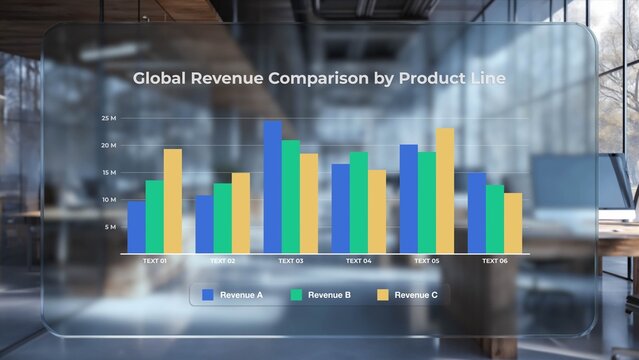
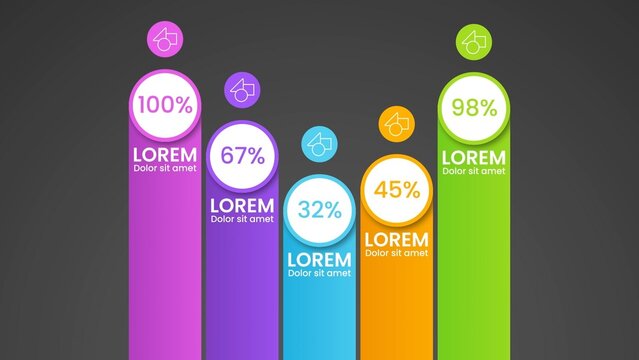
Modern Business Analytics Bar Graph Template
Infographic Pie Chart Animation Template
Horizontal Bar Chart for Design and Data Visualization Design and Slide Presentation and with 10 Animated Data Points + Responsive Custom Text + Color with Ordering Options and 3 Options for Bar Width
Sales Funnel Infographic Template for Marketing and Business Conversion
Cryptocurrency Dashboard Template
Corporate Data Diagrams | Animated Business Infographics Charts

Business Graphs Slideshow
Set of Minimal Moodboard Layouts

Telemetry Overlay 10
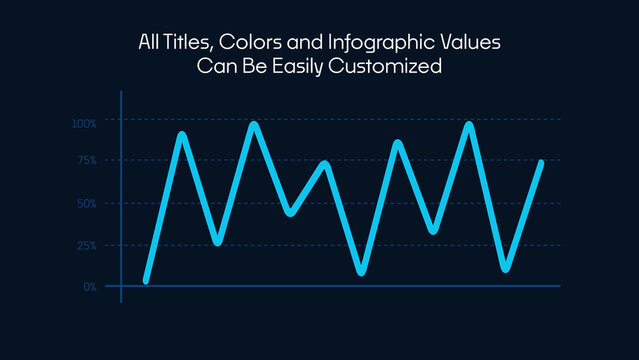
Gradient Graphic Bar Value Comparison Infographic
Data Table Infographic in Modern Corporate Business Presentation Style
Dark Modern Geometric Infographic Presentation Template
Creative Business Infographic with Photo Placeholders
Timeline Infographic Template in Modern Minimal Style
Architecture Infographic Layout
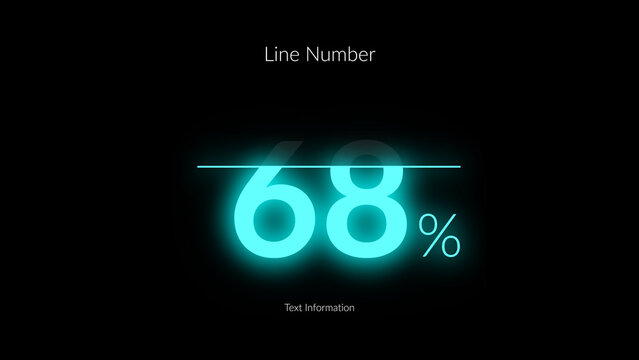
HUD Neon Infographics Line Number x1 – Futuristic Sci Fi Data Interface, Glowing Digital Dashboard Elements, Cyberpunk Analytics Charts, Tech UI Visualization Pack
Six Soft Line Stack Infographic
Business Infographic Template with 6 Step Circular Arrows on Dark Background
Big Data Website Hero Image Layout with Colorful Waves
Business Strategy Infographic Template with Minimal Illustration of a Pointing Hand

Futuristic 3D Tech HUD Callout Titles
Infographic Bar Chart Video Template
Payroll Dashboard Template
Minimal Iceberg Infographic Design for Business Data Visualization
Data Analytics Management Dashboard
Corporate Infographics

Business Chart Slideshow
Annual Report Template Layout

Telemetry Overlay 01
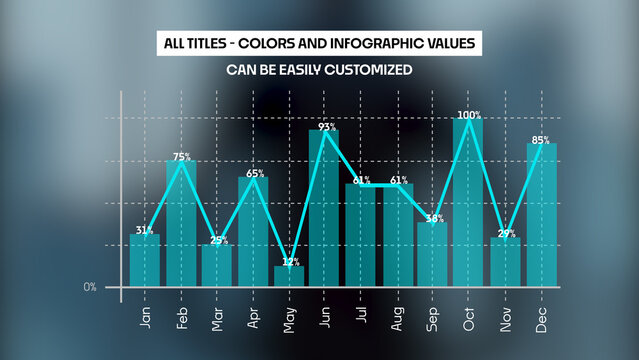
Data Driven Design Professional Graph Solutions
Data Table Infographic Template in Modern Minimal Style
Minimalist Green Global World Data Analysis Infographic Template
Minimal Hexagon Infographic
Modern Business Infographic Elements Set
Saas Dashboard UI For An Email Analytics System
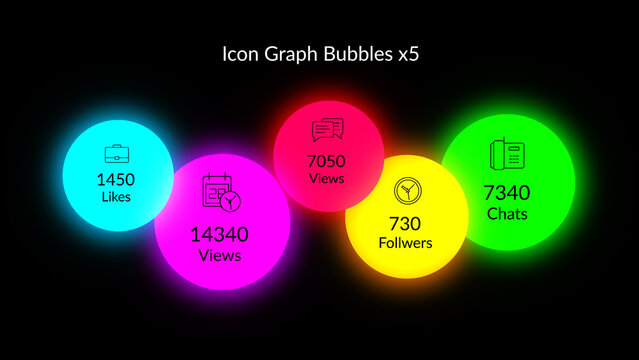
HUD Neon Icon Graph Bubbles x5
Transformation Lines Infographic
Business Timeline Infographic Template with Winding Path
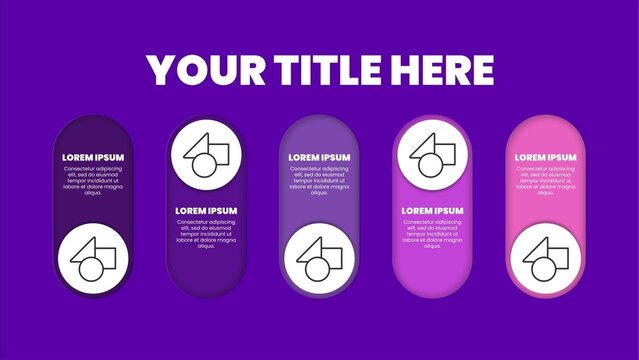
Infographics Elements.
Business Solution Minimalist Infographic Template with Abstract Illustration
Big Data Website Hero Image Layout Concept
Simple Infographic Layout with Pink and Green Accents
Data Analyst Resume
Modern Corporate Annual Report Presentation with Financial Infographics & Charts
Medical Dashboard Design Template
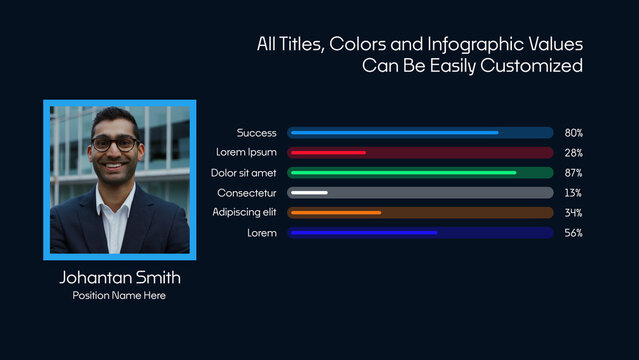
Personal Success Infographics | Animated Charts & Data Visualization for Achievement Analysis
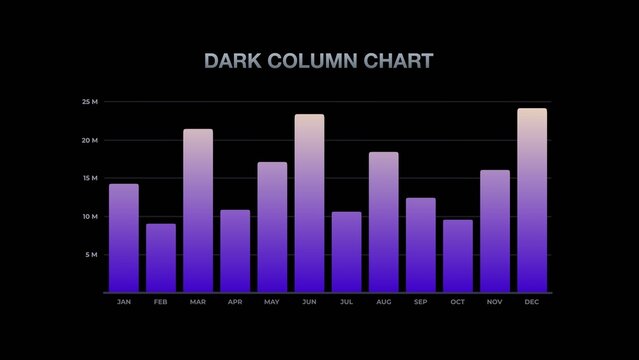
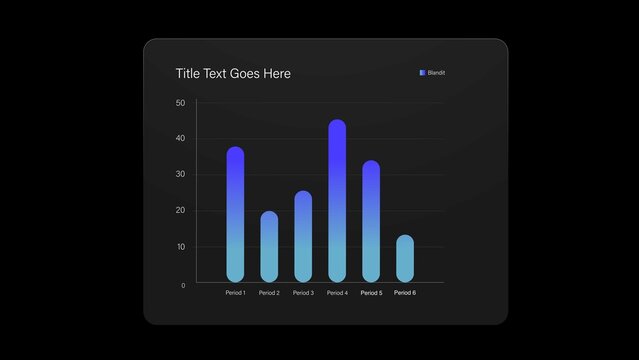
Modern Gradient Dark Column Chart
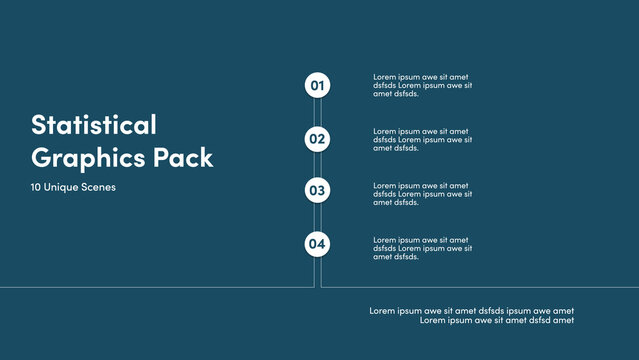
Statistical Graphics Pack | With Control Panel for every Scene