ระบบได้ส่งลิงก์สำหรับตั้งรหัสผ่านของคุณไปที่: ต่อไปนี้คุณจะต้องใช้รหัสผ่านในการเข้าถึงสินค้าที่คุณได้ซื้อ
ทดลองใช้ฟรี: รับรูปภาพสต็อก 10 ภาพ พร้อมเครื่องมือปรับแต่งด้วย AI
เพิ่มตัวกรองใหม่แล้ว
เรียงลำดับตาม

1,003,127 ผลลัพธ์สำหรับ data bar graph ใน ทั้งหมด

ดู data bar graph ในวิดีโอ (28101)
Abstract digital bar graph representing data analysis and financial growth in a futuristic technological landscape.
00:05
mogrt 
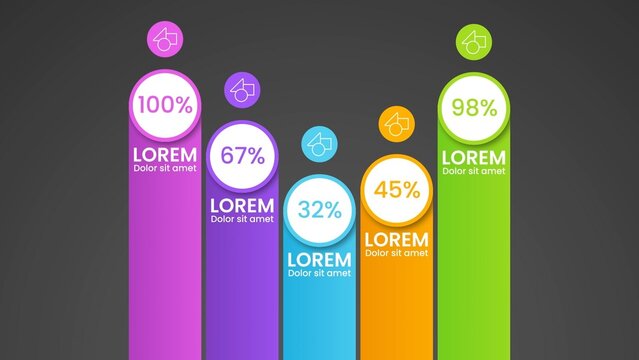
Gradient Graphic Bar Value Comparison Infographic
Simple black and white bar graph illustrating increasing data points
00:10
Business bar chart and line graph showing yearly business growth from 2022 to new year 2026, represent data analytics, future 2026 planning, business 2026 trend, and performance analysis 2026 Marrow
00:10
aet HUD Neon Infographics Line Number x1
indt 
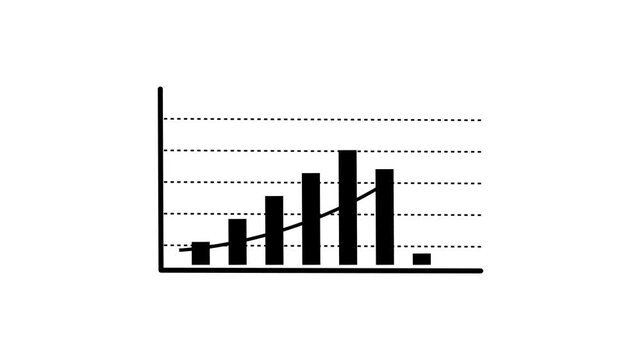
Bar Graph Infographic Template
Business Stats On Computer Screen
Technology textured business and market data analysis and reports with infographics layout bar stats charts and diagrams
00:14
Business bar chart and line graph showing yearly business growth from 2022 to new year 2026, represent data analytics, future 2026 planning, business 2026 trend, and performance analysis 2026 Marrow
00:10
aet 
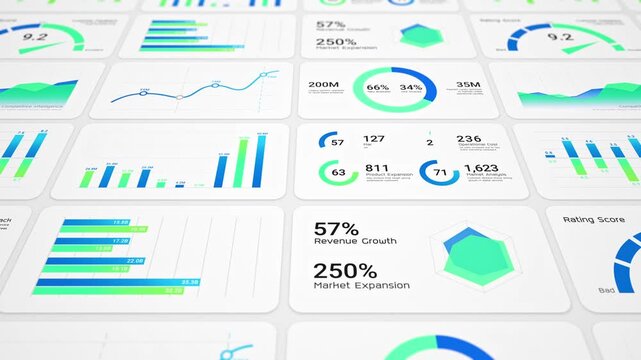
Clean Bar Graph Infographic Data Visualiser
aet 
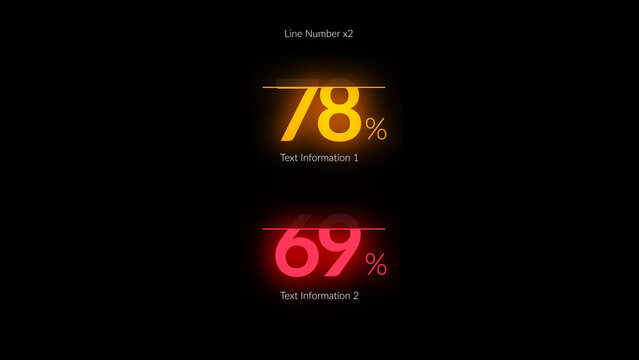
HUD Neon Infographics Line Number x2
Business intelligence and financial performance analysis report on white background, animated infographic bar chart, investment data analytic graph dashboard, success corporate market statistics trend
00:20
Animated data visualization of growing bar graph and pie chart with icons, business analytics and financial growth concept
00:08
mogrt 
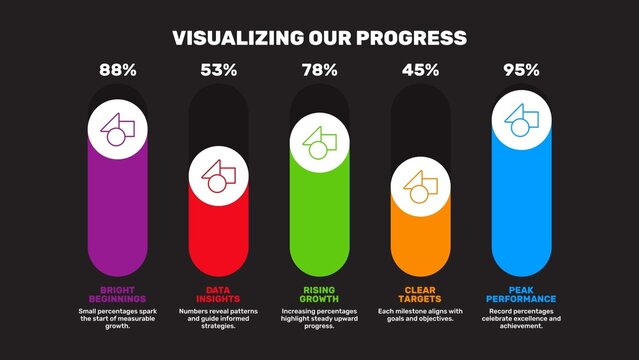
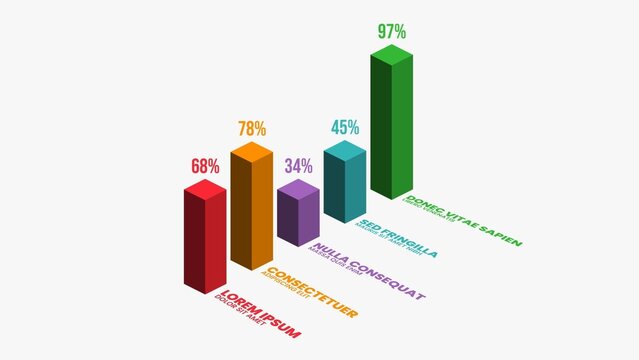
Bar Slider Professional Performance Tracker Infographic