


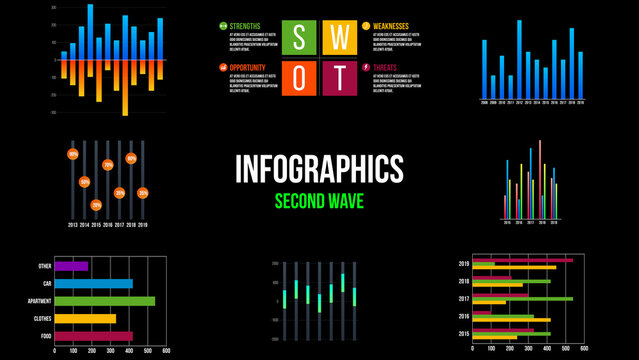
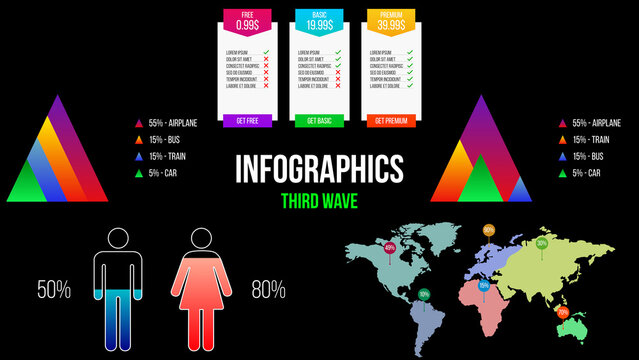
8 Infographics Elements

Colorful Data Visualization Infographic Table Design Template Layout with UI Elements


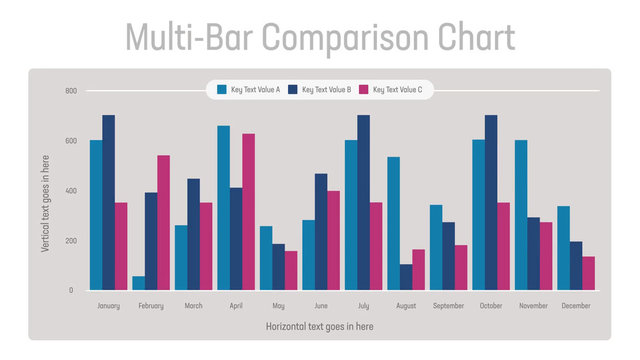
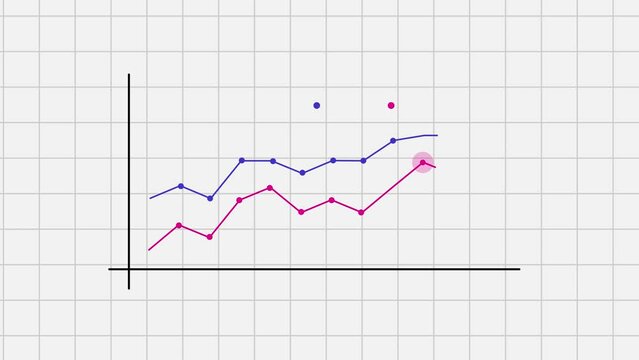
Multi-Bar Comparison Chart


8 Infographics Elements
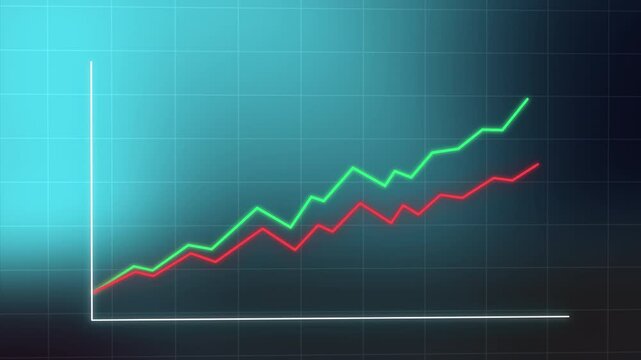
Line Graph Chart Infographic for Time Series in Business Presentation Layouts
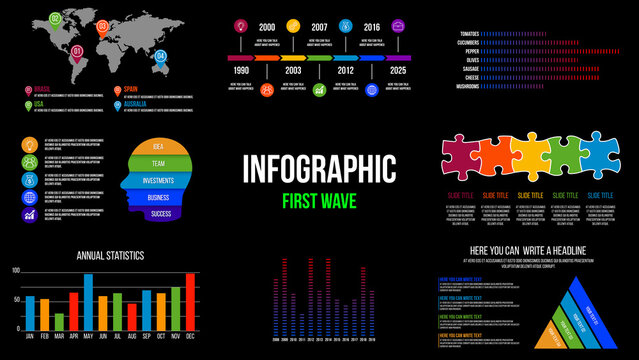
5 Infographics Elements
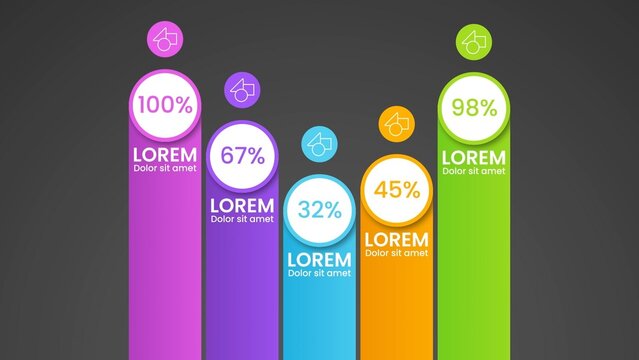
Gradient Graphic Bar Value Comparison Infographic


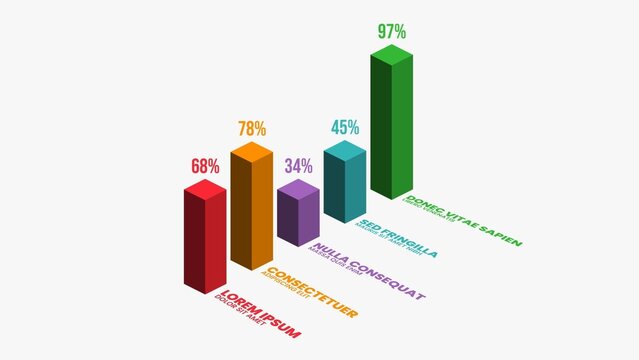
Clean Bar Graph Infographic Data Visualiser
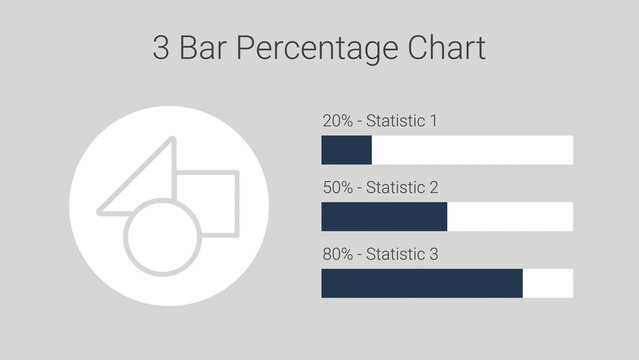
Clean 3 Bar Percentage Chart
Easy To Edit Bar Chart Infographic Template