ระบบได้ส่งลิงก์สำหรับตั้งรหัสผ่านของคุณไปที่: ต่อไปนี้คุณจะต้องใช้รหัสผ่านในการเข้าถึงสินค้าที่คุณได้ซื้อ
ทดลองใช้ฟรี: รับรูปภาพสต็อก 10 ภาพ พร้อมเครื่องมือปรับแต่งด้วย AI
เพิ่มตัวกรองใหม่แล้ว
เรียงลำดับตาม

1,002,087 ผลลัพธ์สำหรับ chart graph presentation report ใน ทั้งหมด

ดู chart graph presentation report ในวิดีโอ (23660)
indt Modern Annual Report Presentation Template for Corporate Business & Finance
Blue gradient bar chart with line and upward arrow showing strong monthly growth from January to December on a dark background. Symbolizing rising profits, success, and positive business performance
00:10
ait Business Growth Strategy Infographic Template with Arrows Illustration
aet 
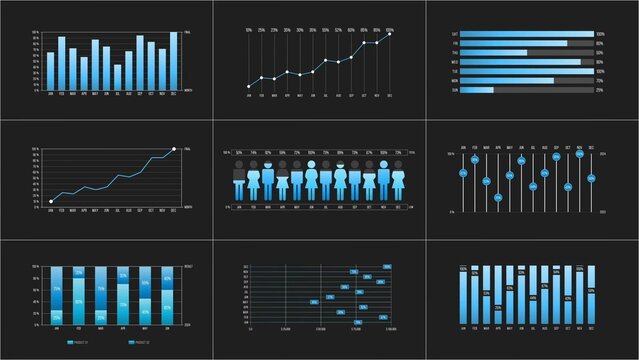
Elegant Infographic Charts
indt Business Financial Annual Report Presentation Template Slides
Glowing orange line graph shows upward trend against dark grid
00:08
ait Business Strategy Timeline Infographic Template Horizontal Stripes
Minimalist bar chart and line graph animation showing financial growth and market data analysis for business presentation
00:05
indt Minimalist Business Pitch Deck Presentation Template
ait Business Strategy Horizontal Timeline Infographic Template
ait Company Fact Sheet Template
Business intelligence and financial performance analysis report on white background, animated infographic bar chart, investment data analytic graph dashboard, success corporate market statistics trend
00:20
indt 
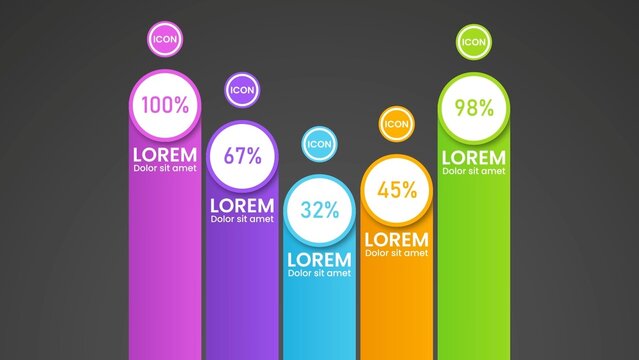
Histogram Graph Infographic Template in Modern Minimal Style
indt Project Proposal Presentation Template
ait Modern Red Corporate Business Presentation Template with Global Financial Market Theme
aet 
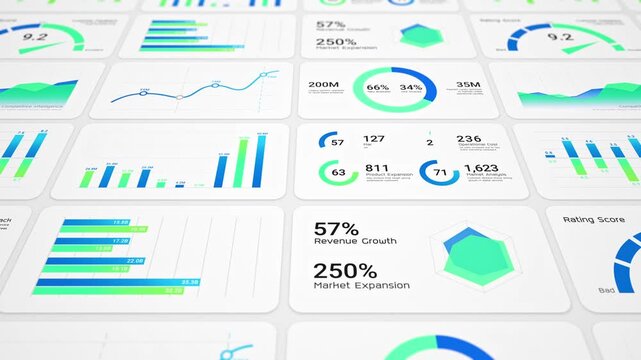
Infographic Data Visualiser Bright Colors
indt Annual Report Presentation