ระบบได้ส่งลิงก์สำหรับตั้งรหัสผ่านของคุณไปที่: ต่อไปนี้คุณจะต้องใช้รหัสผ่านในการเข้าถึงสินค้าที่คุณได้ซื้อ
รับรูปภาพ Stock 10 รูปด้วยการทดลองใช้ฟรี
เพิ่มตัวกรองใหม่แล้ว
เรียงลำดับตาม

15,048 ผลลัพธ์สำหรับ chart data graph hud ui ใน ทั้งหมด
5,179 ผลลัพธ์ในวิดีโอ
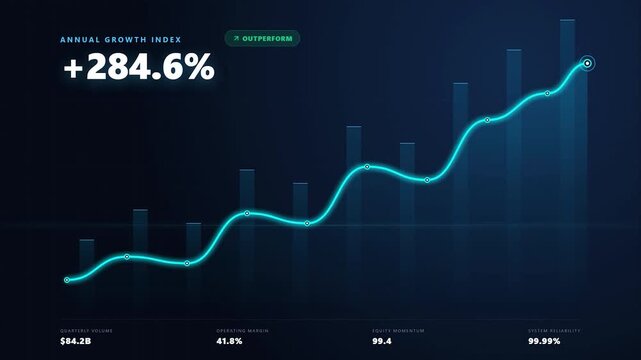
Financial growth data chart futuristic glowing blue hud ui business analytics stock market presentation
00:08
HD
Glowing financial bar chart growth and trend line graph visualizing business success data analytics
00:10
HD
Futuristic data analysis graphs and charts with progress indicators on dark background.
00:15
HD
Digital financial growth chart hud animation, rising business analytics graph with data ui
00:10
HD
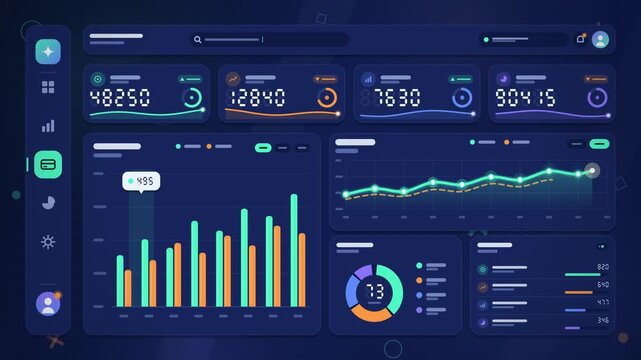
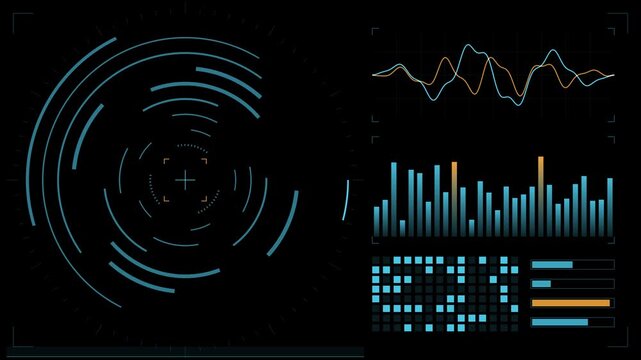
Futuristic hud ui dashboard with animated graphs, progress bars, and data analytics interface
00:16
HD
Digital data dashboard with neon blue progress rings and charts
00:10
HD
Cyan digital data dashboard UI chart graph animation loop
00:10
HD
dashboard analytics growth chart business finance graph ui animation
00:07
HD
Digital green financial graph showing stock market analytics and growth index data on black background for tech display.
00:10
HD
Digital dashboard interface with financial data charts line graph and statistics display
00:08
HD
Futuristic UI interface with graphs and data visualization
00:06
HD
Growth chart rising line graph with percentage data futuristic hud digital infographic ui style financial presentation data visualization business analysis dashboard
00:08
HD
Animated wavy line graph with red data point marker on black background, chart visualization animation
00:10
HD
Futuristic HUD data visualization dashboard animation, glowing blue financial growth chart interface, modern digital analytics infographics display.
00:10
HD
Digital financial market data analytics with stock charts, graphs, and world map
00:10
HD
Digital financial growth chart with upward trend line and data analytics hud interface graph business
00:10
HD
Futuristic Sci Fi HUD Processing Dashboard with turbulence graph to monitor system scan and network server data status
00:20
HD
Financial candlestick chart with glowing trend lines and data growth animation trading stock market graph
00:10
HD
AI data analytics grid perspective dashboard monitoring blue user growth statistics, calendar schedules, and pie graphs in 9:16.
00:11
HD
Animated financial dashboard ui with real-time data analytics
00:13
HD
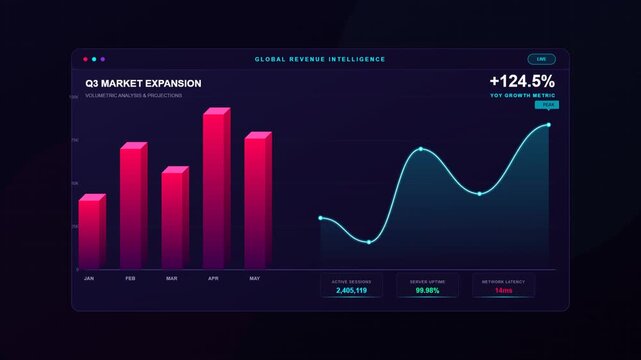
Business growth performance metric bar chart and line graph futuristic cyan neon hud ui interface corporate data visualization finance analytics presentation
00:08
HD
Advanced artificial intelligence data analytics dashboard interface displaying animated graphs and statistics in digital motion footage loop
00:08
HD
financial chart graph growth analysis business data animation loop
00:06
HD
UI dashboard interface animation with financial data graphs and charts loading
00:15
HD
Business growth graph icon rotates within hud circle on black background dynamic footage.
00:05
HD
Digital financial growth chart animation: rising bar graph with hud interface for business analytics and data visualization
00:10
HD
Futuristic HUD interface elements with rings, graphs and bars on black, seamless loop
00:10
HD
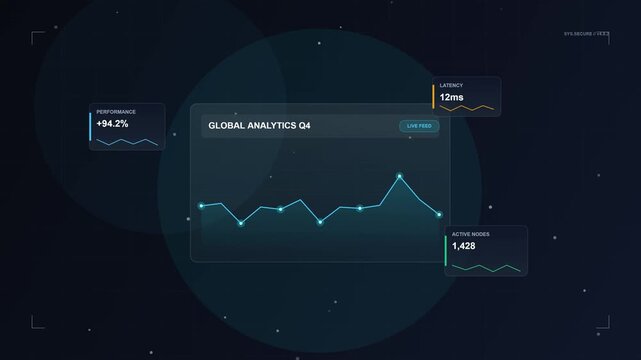
Digital analytics dashboard interface displaying business performance data and charts with glowing nodes and metric panels against a dark technological background
00:05
HD
growth chart growth bar chart chart bar financial graph growth analytics data progress index indicator statistics finance analysis
00:06
HD
Arrow graph animation rises across positive financial metrics. Corporate business revenue expansion analytics guide active arrow graph animation. Trade desks use graph.
00:10
HD
Animated data dashboard ui with dynamic charts and graphs
00:11
HD
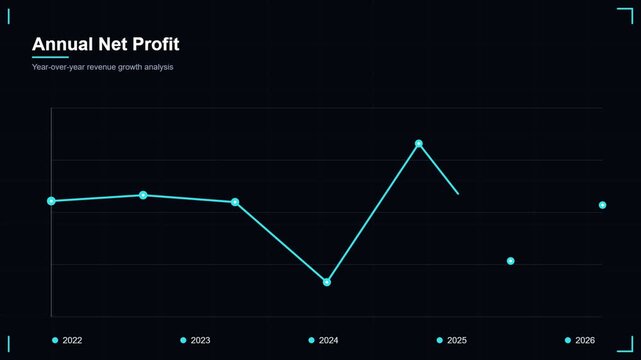
Annual net profit line graph motion graphic, corporate financial data display UI, modern business performance analytics chart
00:15
HD
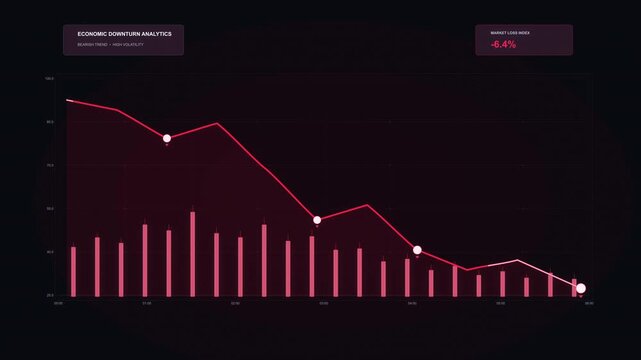
Dashboard animation displays financial market data with a downward arrow on dark. Business revenue downturn analytics track on dashboard. Consoles monitor dashboard.
00:21
HD
Futuristic dashboard displaying business data analytics and financial growth charts
00:10
HD
Red chart graph data analytics motion graphic
00:06
HD
Animated financial bar chart with fluctuating red line graph for business data analysis and market trends
00:10
HD
Futuristic hud interface with digital globe and data visualization elements on black background
00:20
HD
Digital financial growth chart with rising line graph and data analytics hud interface business
00:10
HD
Futuristic digital interface with glowing data charts and graphs in a dark environment
00:08
HD
Amber retro sci-fi cockpit HUD with rings, graphs and bars, seamless loop
00:10
HD
Tech dashboard panels with live bar chart and graphs on green screen
00:15
HD
Set of animated digital data visualization charts on white
00:10
HD
Futuristic analytics dashboard user interface animation with charts and data graphs
00:08
HD
Digital hud interface with animated data charts and circular network scanning elements
00:10
HD
Digital financial chart with candlesticks and data points on a dark background
00:18
HD
Cyan and pink hud dashboard technology background  animation for scifi user interface design. It features modern neon glowing data charts. Ideal for high tech video overlays.
00:32
HD
Quantum data core system interface with glowing blue digital charts and graphs
00:08
HD
Futuristic neon hud interface displaying animated data charts for technological dashboard.
00:10
HD
financial analytics dashboard chart graph data growth market statistics
00:06
HD
Animated financial bar chart with fluctuating red line graph for business data analysis and market trends
00:10
HD
Futuristic hud interface with data charts, scanning circles, and digital information displays for scifi technology, gaming, and hightech ui design elements
00:13
HD
Digital financial growth chart hud animation, rising business analytics graph with hud interface for corporate data visualization
00:10
HD
Futuristic digital user interface animation featuring glowing blue data charts and graphs in motion video clip
00:08
HD
Abstract scientific data visualization with glowing graph curve on digital screen.
00:10
HD
Corporate annual growth bar chart data visualization futuristic hud digital ui neon glow financial analytics presentation dashboard animation
00:08
HD
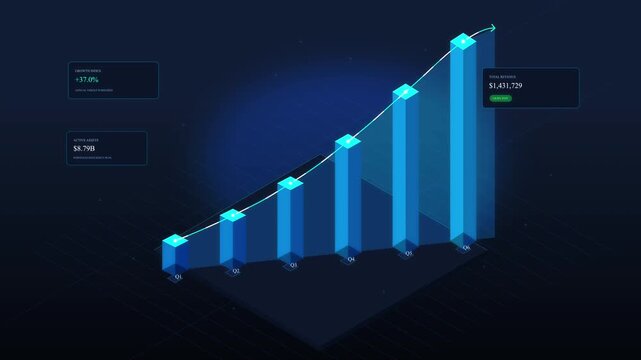
Futuristic blue glowing 3D bar chart graph and digital data visualization technology
00:10
HD
Abstract digital data visualization with animated blue bar graph and geometric background, analytics business
00:10
HD