ระบบได้ส่งลิงก์สำหรับตั้งรหัสผ่านของคุณไปที่: ต่อไปนี้คุณจะต้องใช้รหัสผ่านในการเข้าถึงสินค้าที่คุณได้ซื้อ
รับภาพประกอบ 25 ภาพหรือวิดีโอ 3 รายการเมื่อทดลองใช้ฟรี
เพิ่มตัวกรองใหม่แล้ว
เรียงลำดับตาม

53,243 ผลลัพธ์สำหรับ visualise ใน วิดีโอ

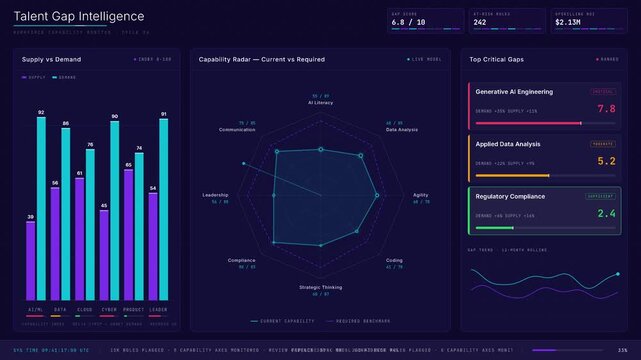
A cinematic 4K digital dashboard visualizing AI talent gaps with animated charts and KPI metrics on a deep indigo background, showcasing skill supply and demand dynamics.
00:15
HD
Animated documents with green check-mark moving left to right, perfect for visualizing success. Get this stock footage with Black background 4k animation video.
00:10
HD
Glowing digital puzzle pieces connect over reflective surface with shimmering blue circuitry, visualizing ai data flow, network integration and future
00:10
HD
3D medical animation visualizing the intense pain and inflammation of plantar fasciitis
00:05
HD
visualise ampere twisting whirlpool of smooth rainbow speck engrossed indium magnetised waveforms, radiate lively tints that wave done the beam ilk fluid silk, apiece ripple wrestle and
00:05
HD
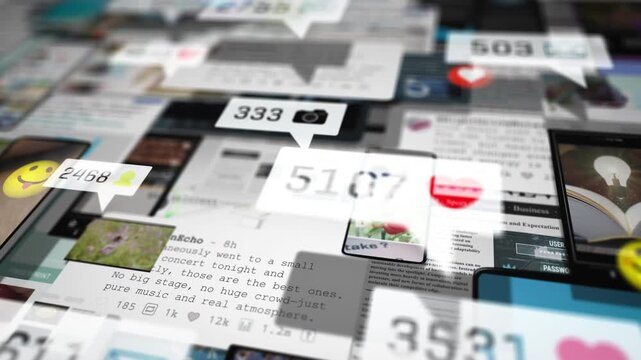
Layered collage of blurred screens and notifications with counters and icons, visualizing social media overload, constant engagement and the overwhelming flow of digital content.
00:10
HD
Overweight businessman in a white shirt visualizing the gut brain axis with a glowing blue hologram
00:10
HD
Health insurance and healthcare protection concept animation with copy space for text. It visualizes safety, medical coverage, and financial security against illness and accidents.
00:15
HD
Digital network connections and supply chain analytics visualize global data flow and technology driven connections across continents with advanced
00:05
HD
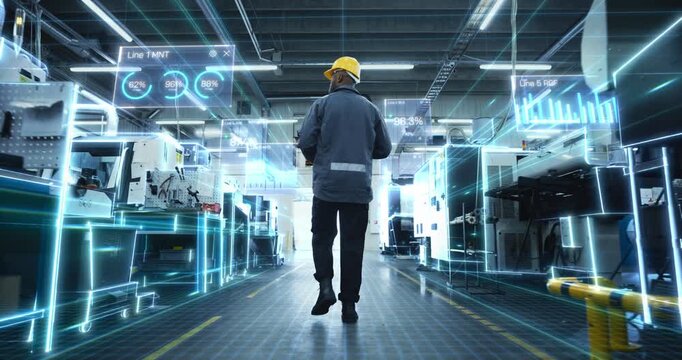
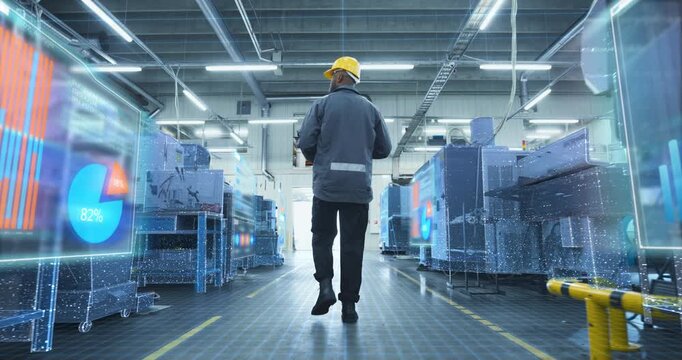
Male Factory Worker Through Modern Production Hall as AR Dashboards and Digital Twin Overlays Map Machines, Track KPI Percentages, Visualize Iot Data. Industry 4.0 Smart Manufacturing, Automation
00:11
HD
Digital Soundscape: A vibrant, abstract representation of sound waves, visualized as colorful columns rising from a dark, textured base.
00:10
HD
Capitol Building facade with a digital overlay of stock prices and economic forecasts, visualizing the relationship between government and Wall Street.
00:10
HD
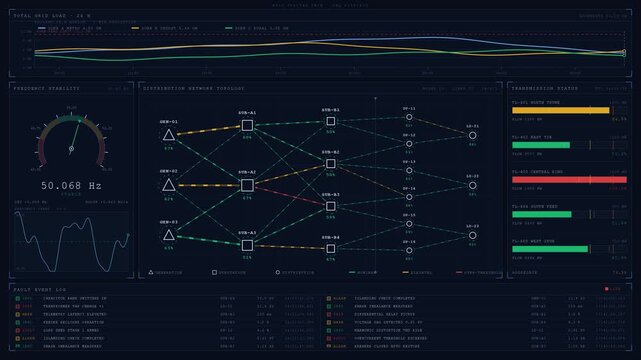
A digital twin network load dashboard visualizing an electrical grid and power distribution system with interactive elements and a cool navy color palette for technical analysis.
00:15
HD
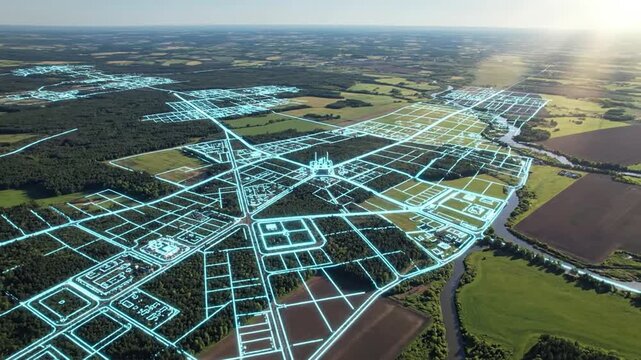
Drone survey visualizes futuristic city planning over lush green landscape with holographic urban grid overlay
00:08
HD
Space asteroid gravity wave galaxy universe cosmos orbit science astronomy field pattern deep space visualizing gravity ripple futuristic energy grid curvature with dynamic motion and mysterious
00:08
HD
A sleek 3D sports car is wrapped in flowing orange and blue particle streams that visualize airflow and aerodynamics sweeping over its body.
00:20
HD
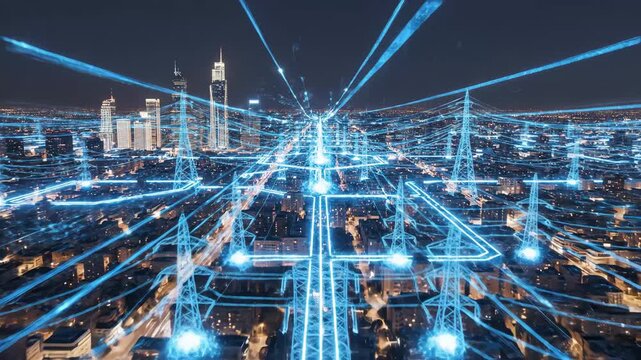
Futuristic City Power Grid Concept - An overhead view of a city at night with stylized glowing blue power lines and electricity pylons visualized above the buildings.
00:08
HD
Glowing file icons float in network. Digital data nodes link through connection. Cloud storage and server cluster visualize transfer. Security and blockchain concept represented by glowing paths.
00:07
HD
Minimalist white line graph with data points showing monthly revenue progression a clean linear chart design visualizing financial metrics over four months with labeled
00:12
HD
Node spawning new nodes then connecting into clusters while camera shifting to visualize network
00:15
HD
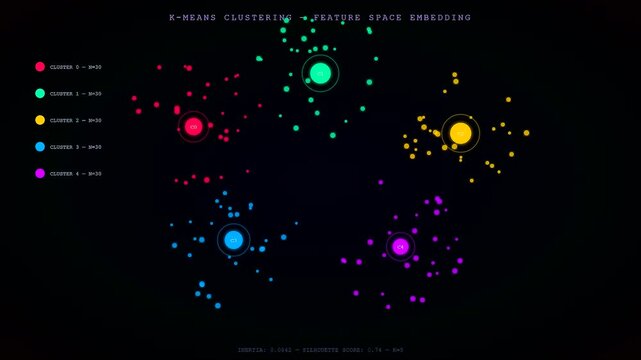
A dynamic neural network diagram visualizes data points clustering around five glowing centroids in a dark virtual space with subtle floating particle motion.
00:06
HD
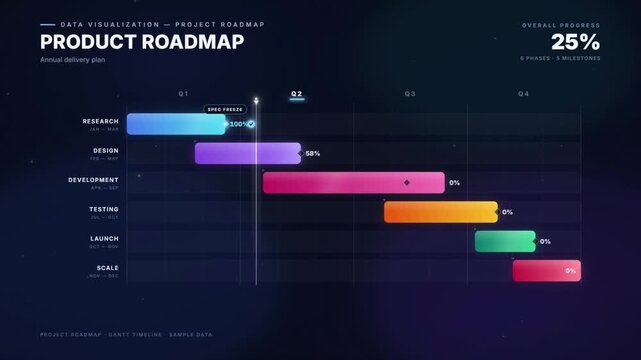
Product roadmap timeline with gantt chart bar and project phase schedule on a dashboard
00:12
HD
Extreme close up of eye in glasses reflecting smartphone content. Algorithm influence concept visualizes how AI algorithms shape content feeds decisions behavior and digital consumption patterns
00:17
HD
Medical 3D animation visualizing thigh muscle pain and strain
00:05
HD
isometric data center model visualizes modular facility expansion
00:10
HD
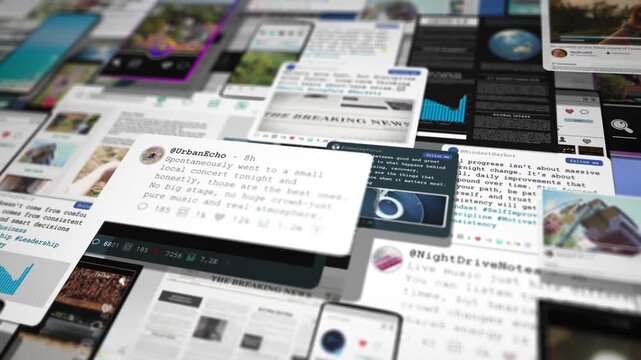
Cinematic collage of social media feeds, news and digital interfaces floating in layered perspective, visualizing online overload for marketing, media and tech campaigns
00:10
HD
Animated world map with spreading virus symbols visualizes a global outbreak, highlighting transmission, expansion, and pandemic risk
00:11
HD
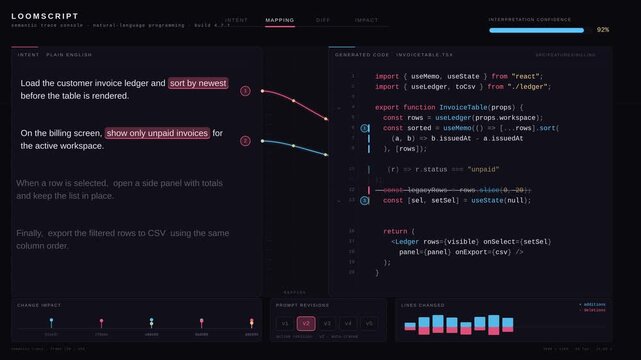
A dynamic dashboard visualizing natural language programming prompts and corresponding generated code changes with animated connections and vibrant color accents.
00:15
HD
Vibrant neon sound wave pulses with electric energy, visualizing audio or data flow
00:08
HD
Woman Relaxes on Bed Using Smartphone. Social Media Content, Livestreams, Video Call Graphics Float, Visualizing Immersive Digital Communication, Influencer Culture, Augmented Reality Entertainment
00:05
HD
a stunning high-tech interface (HUD), focused on visualizing audio and biometric data.
00:10
HD
This animation features an abstract, wireframe pie chart representing data or statistics. The modern technology is visualized with connected poly lines and a futuristic design
00:10
HD
Medical doctor writing on clipboard with holographic medical report completed interface, visualizing digital healthcare data integration, hospital administration, and patient record management.
00:07
HD
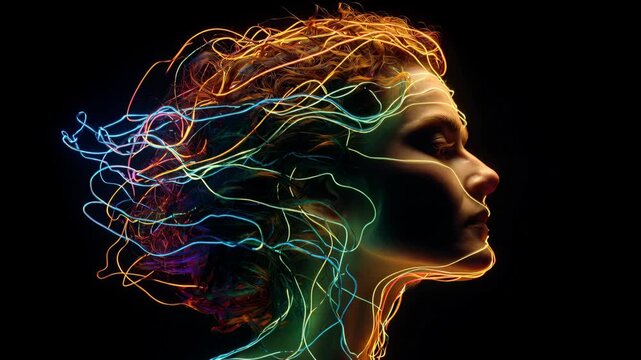
Profile Portrait with Vibrant Light Trails Surrounding Head in Dark Studio
00:10
HD
Official red rejected stamp graphics signify denied application requests. Circular red rejected stamp visualizes disapproval decisions. Compliance workflow with a red rejected stamp.
00:12
HD
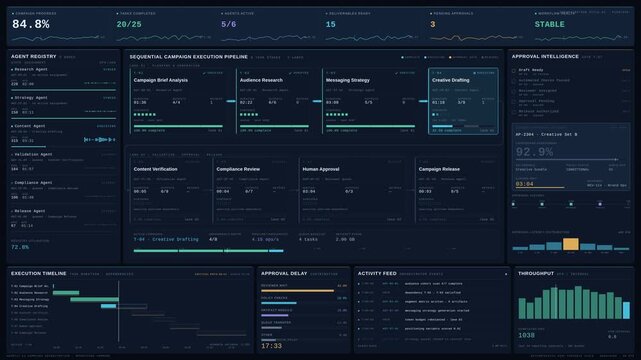
Cinematic 4K agentic AI campaign dashboard visualizing sequential marketing tasks, autonomous agent workflows, and human approval gates with dynamic enterprise data visualization.
00:15
HD
Animation of multiple charts visualizing the analysis of large amounts of data
00:14
HD
City Street Reconstruction with Combination Roller and Workers. This industrial concept video visualizes urban infrastructure development, civil engineering, and municipal public works.
00:14
HD
Futuristic circuit brain with blue HUD rings and connected paths visualizes generative AI, machine learning, neural processing, automation, algorithms and digital transformation for secure technology.
00:25
HD
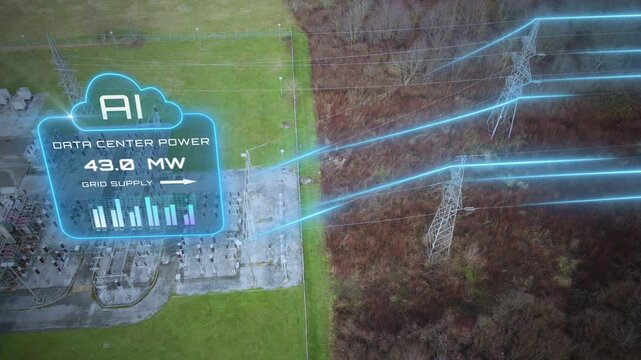
AI data center power demand visualized over electrical substation with animated electricity flow and energy monitoring
00:08
HD
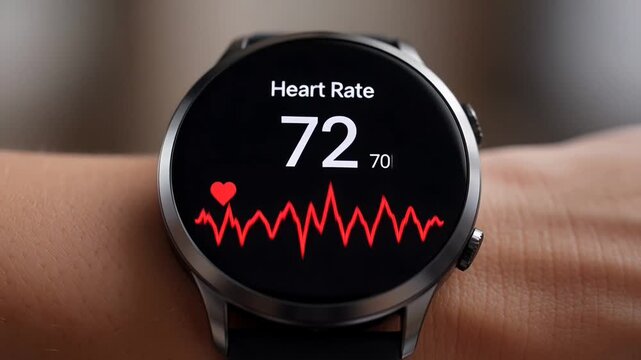
?Smartwatch tracks heart rate in realtime: visualizing health monitoring
00:06
HD
Animated Gantt chart project roadmap timeline visualizing development phases and progress tracking
00:12
HD
4K cinematic abstract animation visualizing human thinking process as soft glowing neural lines forming and dissolving inside a transparent head silhouette made of light particles.
00:08
HD
Medical video visualizing inflammation of the prostate and bladder, and pain in the male genitals using 3DCG
00:05
HD
Abstract waveform graphic visualizes audio waves, Abstract sound waves pulse with rhythm and energy., Digital tracks audio frequency , Digital signal processing drives modern technology.
00:12
HD
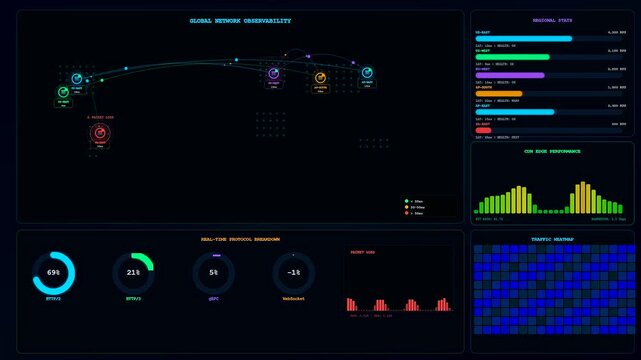
This Realtime Observability Dashboard animates complex global connectivity patterns through shifting neon metrics and holographic telemetry to visualize immense quantities of corporate network traffic
00:06
HD
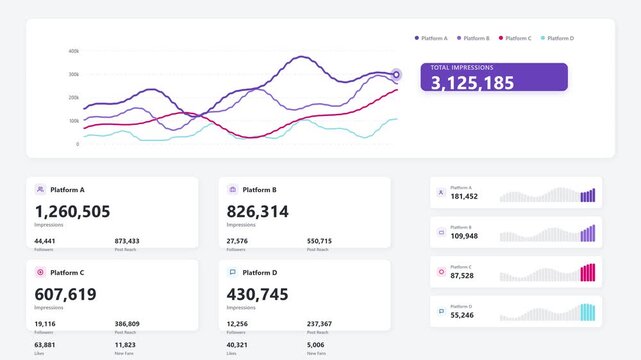
Modern social media analytics dashboard visualizing impressions, engagement metrics, platform performance, and audience growth through animated charts and business intelligence data.
00:08
HD
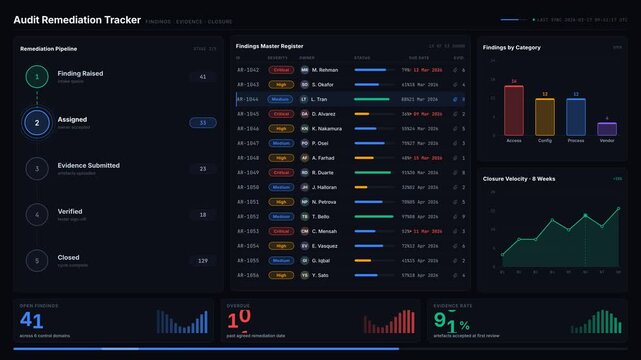
Audit Remediation Dashboard visualizes tracking findings through evidence verification and closure with dynamic stages, data tables, and animated KPI metrics for effective management.
00:15
HD
padlock hologram hovers above microchip and motherboard. circuit traces wrap around chipset surface. encryption algorithms visualize data flow across board. security concept rendered as lock.
00:07
HD
Factory Engineer Walks Through Production Factory as Holographic Overlays Machines, Data Grids, Visualizing Industry 4.0 Monitoring, Predictive Maintenance, Smart Manufacturing Analytics
00:11
HD
Central blue flare pulsing, sending streaks, chalk axes, curve and cone appearing, visualizing math
00:12
HD
Synapse, microscopic biological structure facilitates neural signal transmission, visualizing chemical messaging exchange, neurotransmitter release, receptor binding.
00:08
HD
Man typing on laptop with holographic AI robot chatbot, visualizing virtual assistant customer support, automated messaging technology, and artificial intelligence communication concept.
00:09
HD
Connections Between Users in a Network Visualized With Dots and Lines Over a Dark Background Showing Different Colors and Patterns
00:05
HD
Professional dashboard visualizing financial growth trends and key market data analytics.
00:11
HD
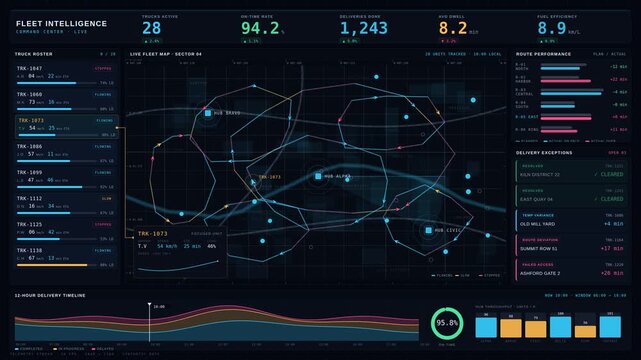
A dynamic fleet intelligence command center visualizes live truck locations, route performance, and delivery exceptions with vibrant colors and interactive data panels.
00:15
HD
Digital envelope icon displays incoming customer communication alerts. Modern envelope icon visualizes corporate newsletter email marketing strategies. Contact information with envelope icon.
00:12
HD
Dynamic neon gauge meter visualizing integrity levels with glowing blue and red indicator needle motion for corporate ethics, business compliance, standards, and trustworthy data analysis
00:10
HD
Programmer in data center using holographic simulation to visualize AI LLM with VFX HUDs. IT specialist in server hub oversees artificial intelligence infrastructure using digital twin visualization
00:22
HD
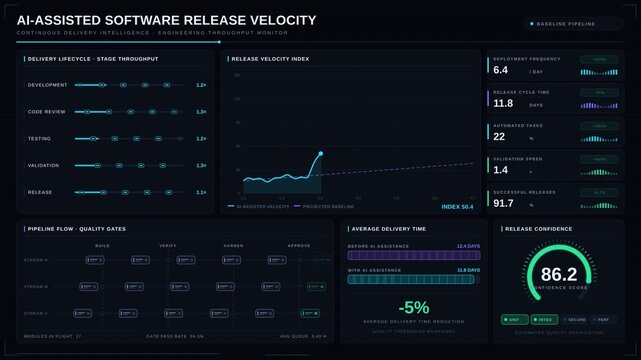
Cinematic 4K dashboard visualizing AI-enhanced software release velocity with dark graphite and electric cyan metrics. professional stock footage for technology, business, and editorial use.
00:15
HD
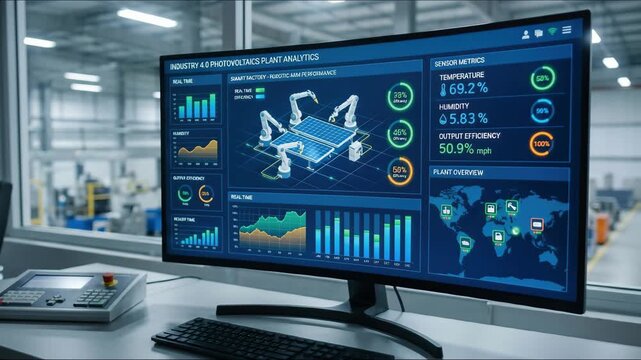
Monitor displaying industrial analytics dashboard for Industry 4.0 photovoltaics plant equipment. Solar panels smart factory display visualizing robotic arms performance and metrics from sensor data
00:10
HD
Close-up of blue light pulses traveling through transparent optical fibers into a connector, visualizing high speed data transmission and telecommunications technology.
00:05
HD
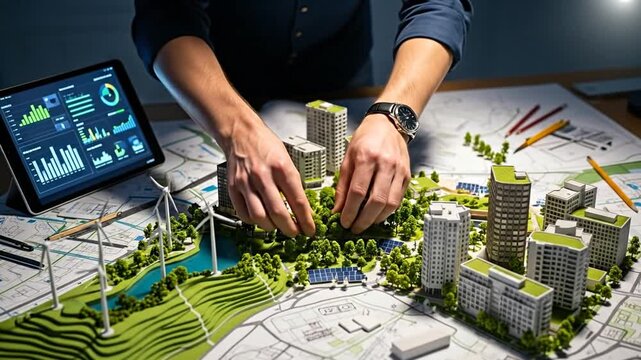
Architect's hands designing sustainable city plan, envisioning future eco-friendly urban growth
00:08
HD
Medical 3D illustrations visualizing chest pain and lung diseases
00:05
HD
Customer centric review and rating system support product review, digital rating concept, and customer give good trust by visualizing people choice through stars and feedback content technology Marrow
00:10
HD
Cinematic macro of an energy efficiency rating label for electrical appliances. Defocused background, soft daylight. Visualizes carbon footprint reduction, appliance econom shopping.
00:11
HD
Abstract digital sound waves in vibrant blue and purple colors dynamically pulse and flow across a futuristic data grid, visualizing music in a compelling motion animation clip.
00:10
HD
An abstract Edge AI deployment and inference dashboard visualizes network connections between a central cloud cluster and various edge devices on a dark slate background.
00:15
HD
Macro 3D animation of golden serum penetrating scalp and coating hair strands. Visualizes follicle nourishment, smoother texture and thicker healthy hair in cosmetic hair care concept.
00:10
HD
Cinematic Data Center, Server Racks with Glowing Blue Information Lines Stream Overhead. Visualizing Cloud Computing, Network Traffic, cybersecurity, cyber security, Cyber Secure Infrastructure
00:12
HD
Data pulse sending cyan binary panels sliding and expanding, visualizing system output
00:12
HD
Modern business analytics dashboard visualizing operational efficiency
00:15
HD
Experience the captivating beauty of soundwaves visualized in brilliant blue hues. The digital art exhibit showcases intricate designs that dance to the rhythm of music.
00:08
HD
Angled perspective of digital interface visualizing credit card security code and encrypted pin entry.
00:11
HD
High tech digital dashboard visualizing key performance indicators and growth metrics for business monitoring.
00:11
HD
A detailed smart grid dashboard visualizing distributed energy resource management with a multi-layer network diagram and a twelve-stream time-series chart for energy utilities and grid operators.
00:15
HD
Starting frames, neon grid mesh shifting in void, magenta cyan particles flowing, visualizing data
00:05
HD
AI Enabled Decision Framework Roadmap Visualizing Adaptive Intelligence Flows, Dynamic Data Routing, Real Time Decision Orchestration, Autonomous Business Logic, Predictive Analytics Integration.
00:10
HD
Deep-sea sonar style interface with fluctuating waves and mapping data. Versatile for geological scans or visualizing market volatility.
00:20
HD
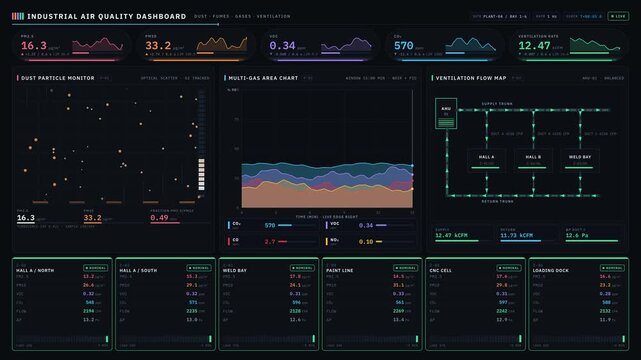
An industrial air quality dashboard visualizing dust, fumes, gases, and ventilation metrics in a dark-mode design with animated elements for real-time monitoring.
00:15
HD
Glowing 6g network lines connecting digital data points on a dark abstract background , Futuristic 6G network visualizes digital data, Glowing lines and circuits enhance global connectivity .
00:10
HD
Digital twin technology visualizes industrial process temperature data futuristic factory setting enhancing monitoring control with advanced real time digital twin integration for efficient production
00:08
HD
Milk Product Analysis in Supermarket: A hand holds a milk product, visualizing data overlays in a grocery store, symbolizing freshness and digital insight.
00:10
HD
A medical 3D illustration visualizing pain and muscle inflammation throughout a woman's back
00:05
HD
Abstract digital brain with glowing neural connections and pulsing light nodes on a dark background, cinematic and futuristic, visualizing intelligence, networks, and high-tech neural activity.
00:05
HD
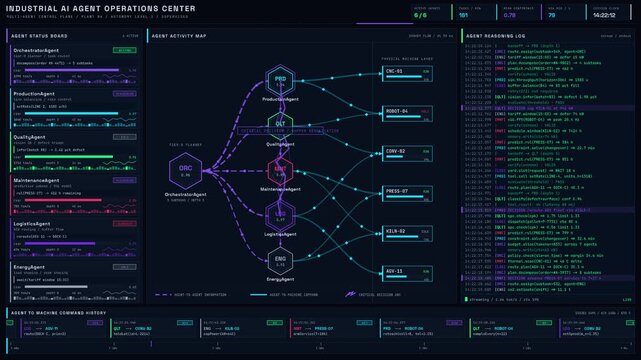
Ultra-high resolution industrial AI agent operations center dashboard visualizing multi-agent system workflows in a futuristic factory control room. professional stock footage for technology,.
00:15
HD
Futuristic 4K tech motion graphic visualizing a complex network of luminous digital nodes and interconnecting data lines pulsing with energy representing global cloud database connectivity and modern
00:10
HD
High-tech scientific screen visualizes DNA structures with animated charts, statistics and data analysis elements.
00:24
HD
Golden serum drop falls onto the scalp between hair strands. Visualizes follicle nourishment, ingredient absorption and supports hair growth in cosmetic hair care concept.
00:06
HD
Businessman Stands Inside Office Observing Futuristic Night City Through Glass Window With Interconnected Digital Data Lines, Visualizing Internet Connectivity, Digitalization and Information Flow.
00:14
HD
Futuristic blue UI appearing emitting lines forming shapes rotating dial pulsing visualizing data
00:11
HD
Abstract animation visualizing a network ping test with a pulsating red dot and text on a dark background, representing internet connection status, latency, and digital communication.
00:10
HD
Abstract network connections visualized with glowing orange and blue lines on a dark digital grid background
00:05
HD
AI neural network and data processing system visualizing artificial intelligence with brain structure, chip, and connected data blocks for computation and learning Marrow
00:10
HD
Digital data streams flowing between urban structures, networking technological innovation across smart city skyline, visualizing interconnected digital ecosystem
00:09
HD
Dynamic digital platform ecosystem diagram with distributed service nodes, unified central hub, and interconnected analytic elements visualizing modern technological operations.
00:12
HD
High-tech 3D animation shows human lungs and trachea in glowing red with clear, branching airways, visualizing breath and respiratory function. Perfect for medical, science, anatomy, or healthcare vid
00:05
HD
A blue torso with glowing orange liver visualizing a fatty liver disease, hepatic steatosis anatomy
00:05
HD
Glowing lines connect metallic planets on a dark tiled wall, visualizing space data.
00:10
HD
Satellites Over Earth: A mesmerizing image of satellites orbiting the Earth, linked together by a network of data streams. Visualizing technology, globalization, and scientific progress.
00:10
HD