ระบบได้ส่งลิงก์สำหรับตั้งรหัสผ่านของคุณไปที่: ต่อไปนี้คุณจะต้องใช้รหัสผ่านในการเข้าถึงสินค้าที่คุณได้ซื้อ
รับภาพประกอบ 25 ภาพหรือวิดีโอ 3 รายการเมื่อทดลองใช้ฟรี
เพิ่มตัวกรองใหม่แล้ว
เรียงลำดับตาม

1,518 ผลลัพธ์สำหรับ variance analysis ใน วิดีโอ

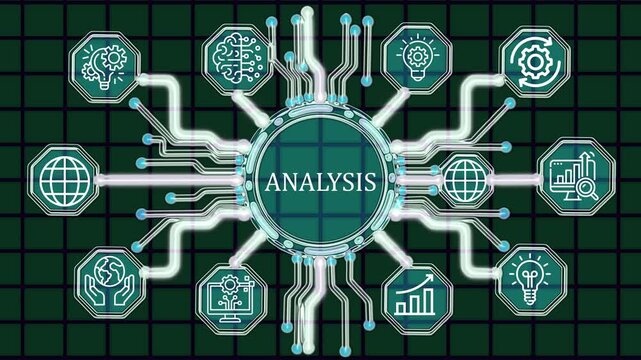
Advanced Statistical Analysis and Diagnostic Data Evaluation Architecture with AI-Powered Deep Examination for Modern Enterprise Research Methodologies and Insights Concept 4K video
00:10
HD
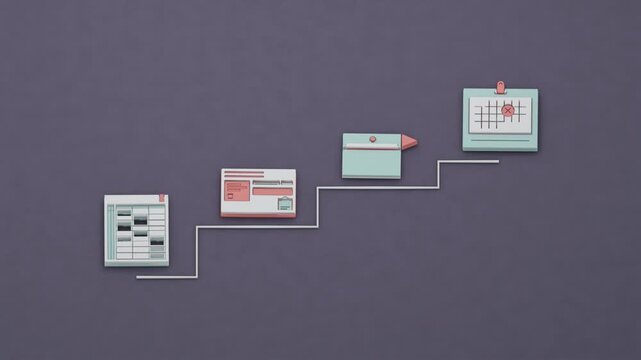
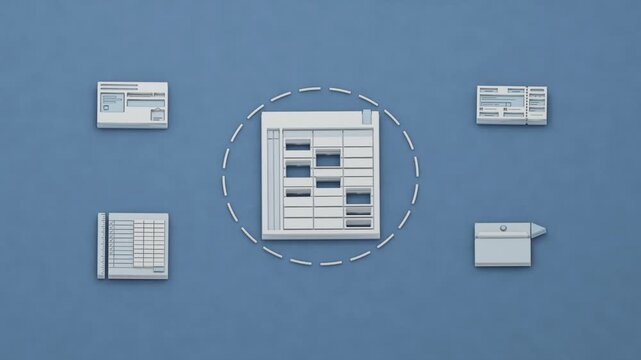
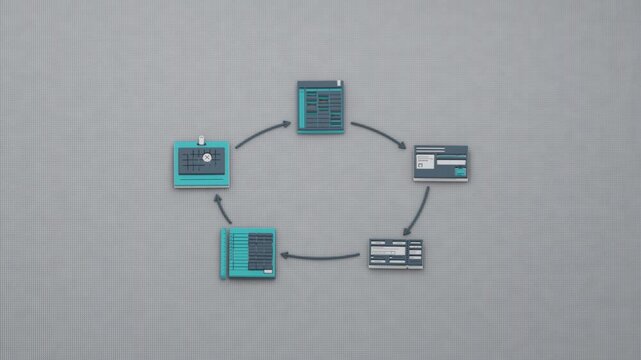
An expense accrual progresses through a chargeback variance and reconciliation to a correcting journal entry for close. Flat 3D style.
00:08
HD
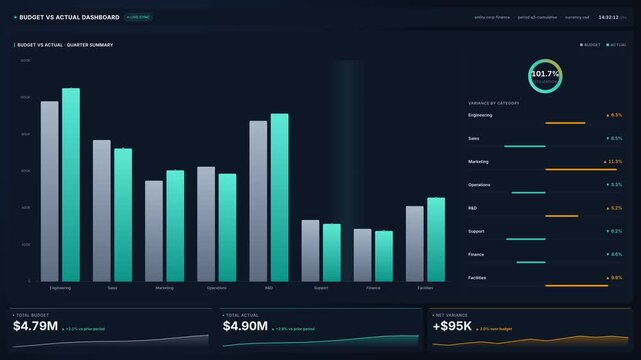
Animated budget versus actual dashboard displays quarterly bars utilization gauges, for financial planning, cost tracking, variance analysis, business performance
00:20
HD
Analyst and manager check budget report at computer. A man compares a paper printout with financial data on the screen while a colleague advises. Teamwork in budget planning and analysis.
00:09
HD
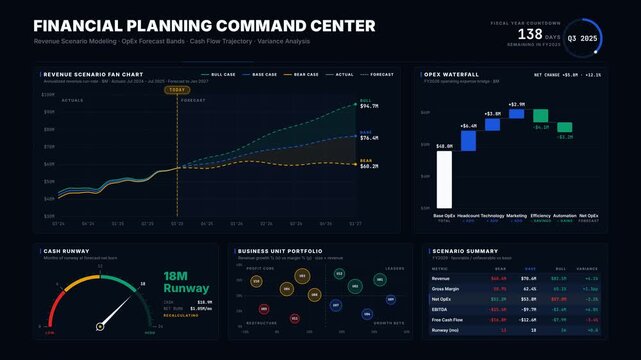
Financial planning dashboard animation with revenue scenarios, OpEx waterfall, cash flow gauge, and variance analysis in 4K navy interface style for commercial creative technology and business use.
00:15
HD
Mathematical statistics symbols and normal distribution curve on blue chalkboard for educational presentation and data science analysis
00:10
HD
Financial Analyst Woman Reviewing Corporate Budget And Forecasting
00:19
HD
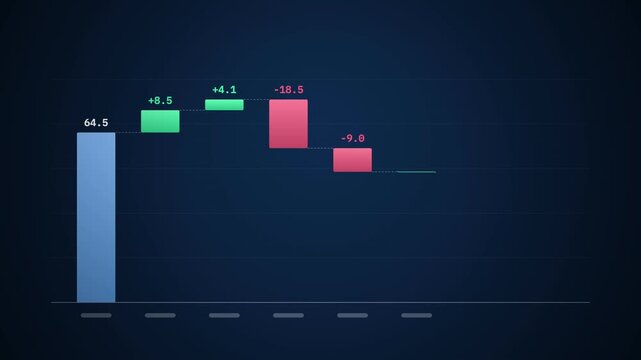
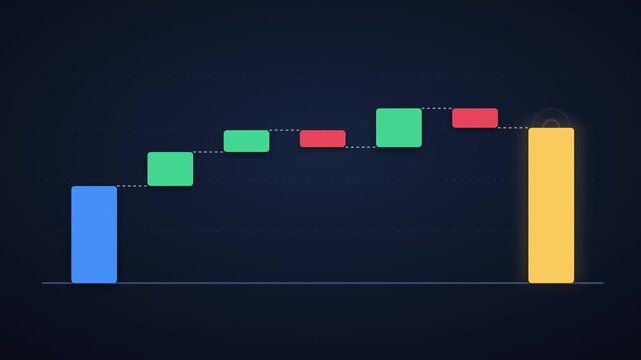
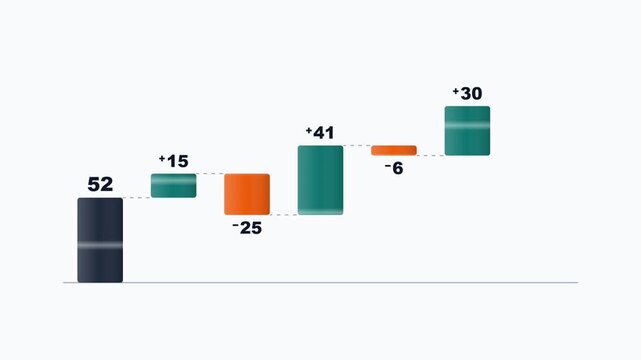
Waterfall chart building step by step from revenue through gains and costs to final profit dark blue, financial statement, income analysis and business report
00:10
HD
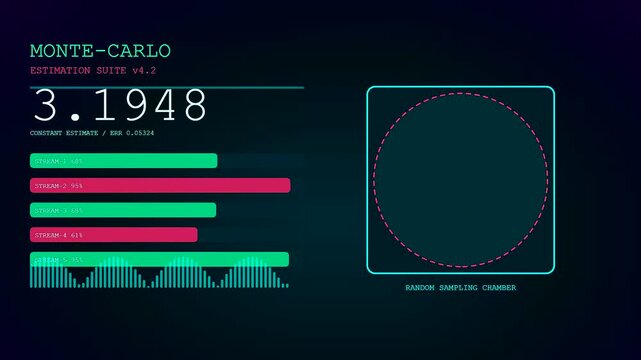
Digital displays showing probability modeling with animated statistical charts and circular geometric graphs visualizing data variance across three separate user interface panels in dark mode
00:06
HD
Business performance variance analysis concept data evaluation, budget control, and metrics measurement for strategy management and reporting
00:17
HD
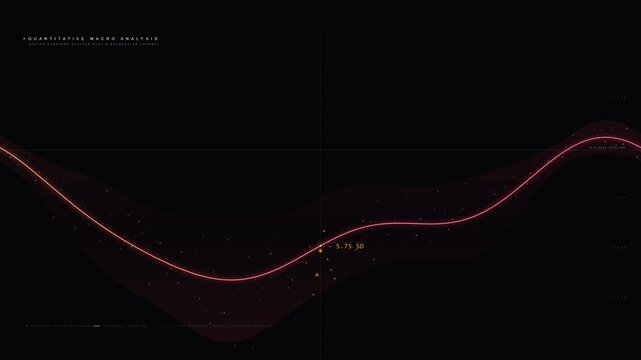
Quantitative macro analysis scatter plot chart animation showing deviation spread HUD screen.
00:10
HD
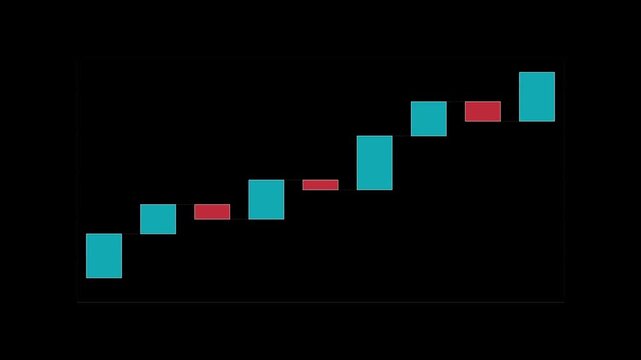
Bridge chart totals each movement in turn, upright loop
00:15
HD
Financial Waterfall Chart Cash Flow Earnings Infographic 4K
00:12
HD
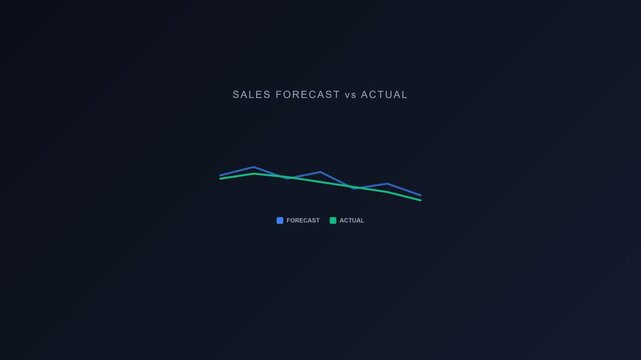
Sales Forecast vs Actual Dual-Line Chart Animation
00:12
HD
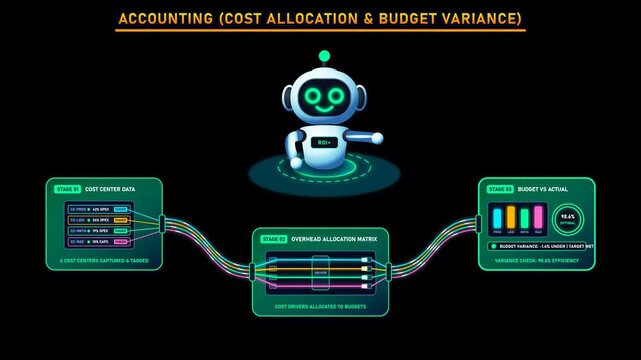
Accounting cost allocation and budget variance analysis workflow
00:10
HD
Operating Budgets Word Cloud
00:11
HD
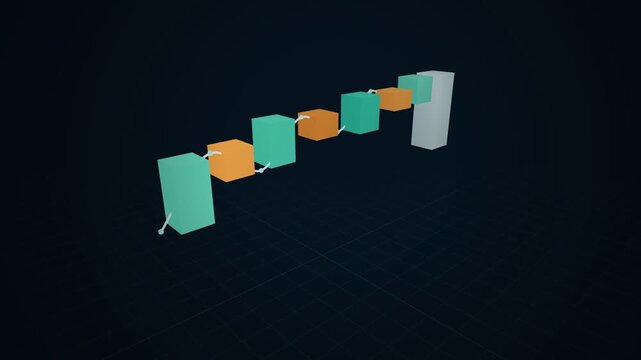
Cumulative step blocks and connector ties cascading from left to right with positive and consolidating bars.
00:06
HD
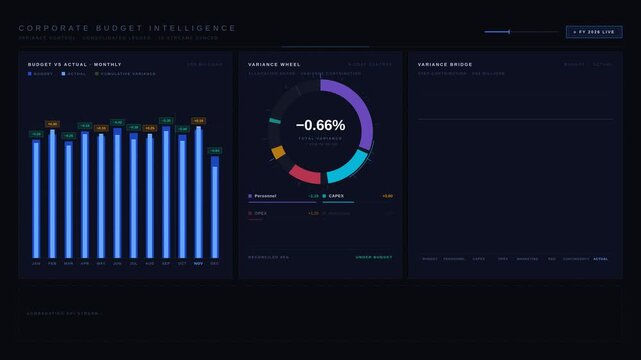
Corporate budget dashboard animation with actual spending, financial variances and KPIs
00:15
HD
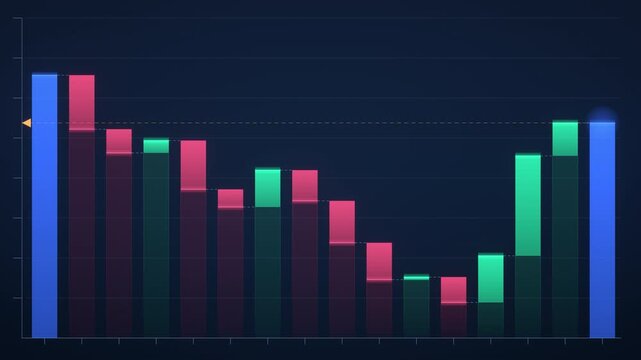
4K Animation of a Waterfall Chart Stepping Down and Recovering Between an Opening and Closing Total
00:10
HD
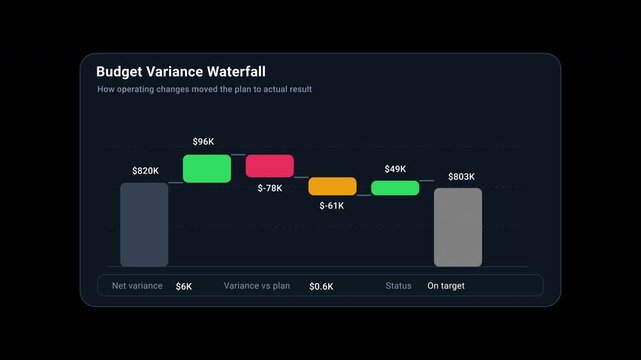
Budget variance waterfall dashboard showing planned budget, revenue impact, payroll, marketing, other operating changes and actual result.
00:10
HD
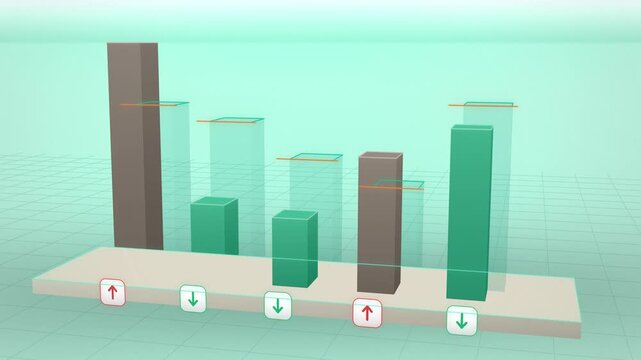
Teal budget versus actual bars isometric view reveal coming to life
00:12
HD
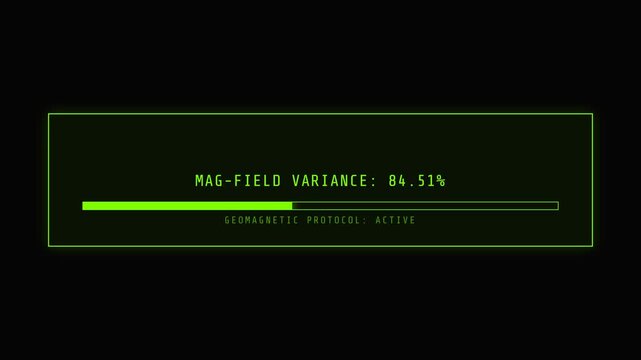
Sci-fi HUD interface green warning screen for POLAR SHIFT DETECTED and mag-field variance
00:10
HD
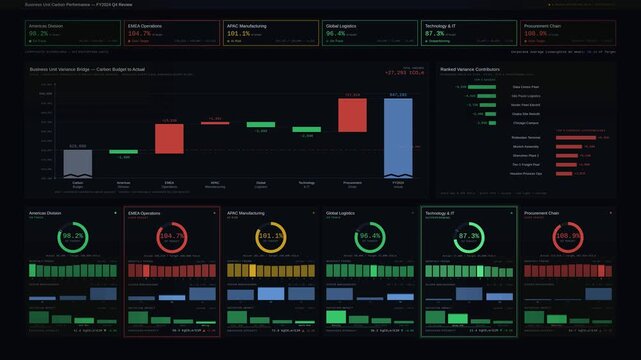
Executive 4K dark mode carbon performance dashboard with waterfall variance analysis, RAG status chips, and animated circular gauges for corporate board reporting.
00:15
HD
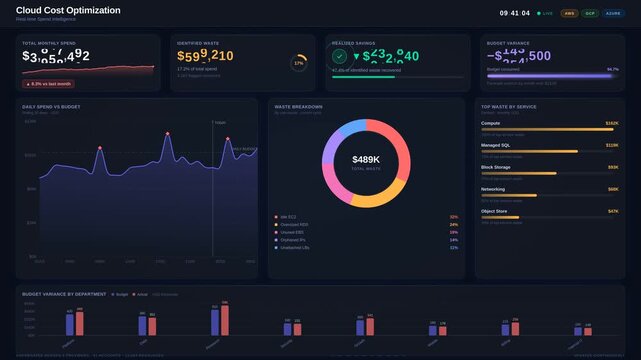
Dark mode cloud cost optimization dashboard with animated spend charts, waste metrics, savings data, and budget variance visualizations in 4K for commercial creative technology and business use.
00:15
HD
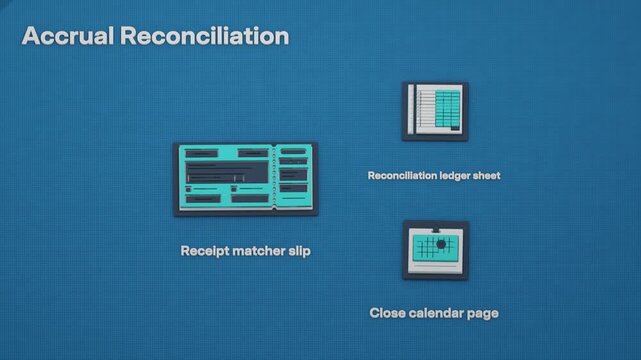
Accrual reconciliation isolates the expense for attention, with chargeback variance matching and correction posting still pending. Flat 3D style.
00:08
HD
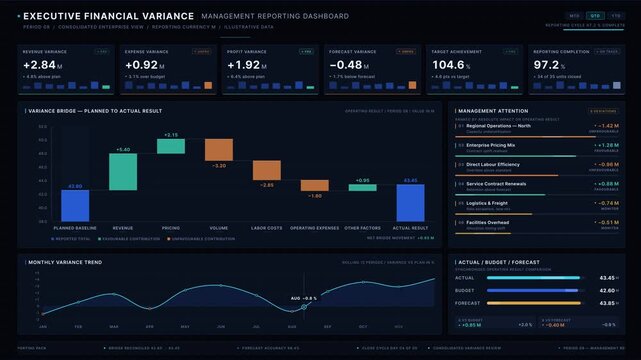
Premium 4K executive financial variance analysis dashboard with KPI cards, waterfall chart, and trend line for CFO board reporting. professional stock footage for technology, business, and editorial.
00:15
HD
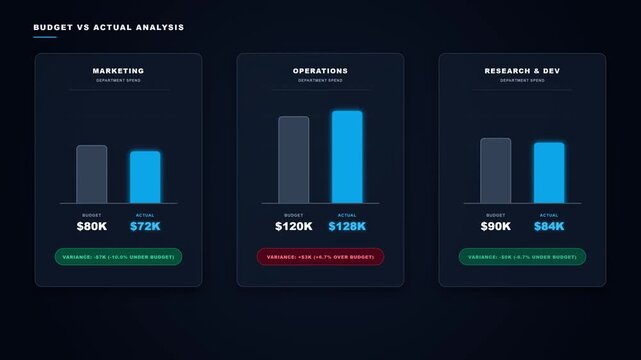
A cinematic dark-mode financial intelligence dashboard tracking department spending variance across Marketing, Operations, and R&D. Features explicit budget vs actual comparison, dynamic variance calc
00:12
HD
Waterfall chart bridging gains and losses to a final total
00:12
HD
Comprehensive Strategic Budget Planning and Fiscal Allocation Framework with AI-Powered Financial Forecasting for Modern Enterprise Resource Management and Cost Optimization Concept 4K video
00:10
HD
Process variance analysis operational differences, team collaboration, data charts, and measurement indicators for business improvement and risk management
00:17
HD
Budget versus actual bars detail view endless loop
00:12
HD
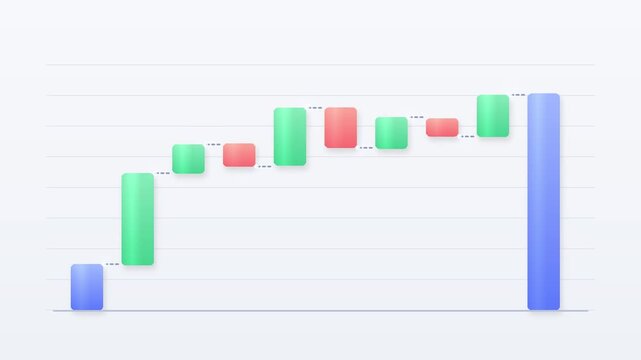
Waterfall chart columns stepping up and down in soft gradients with floating connector lines, financial analysis concept, no labels, 4K
00:10
HD
Variance analysis is a specialized financial planning and analysis workflow.
00:08
HD
Abstract animated budget variance balance drawn as blue and cyan lines and shapes on a bright, clean light background. Seamless looping 4K motion graphics video with free space for text, ideal for bus
00:07
HD
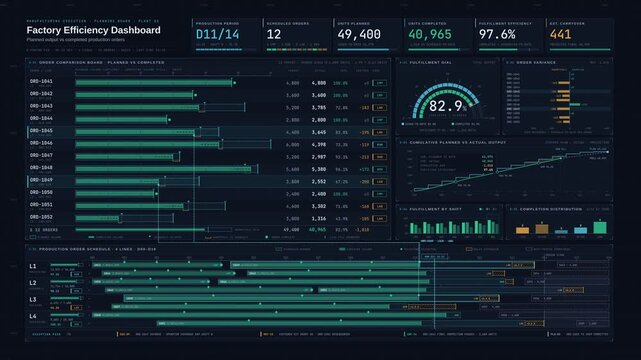
Cinematic 4K factory efficiency dashboard comparing planned output and completed production orders with Gantt charts, variance dials, and real-time manufacturing execution metrics on a dark navy.
00:15
HD
Animated budget variance dashboard card displaying financial performance against plan for corporate budgeting
00:08
HD
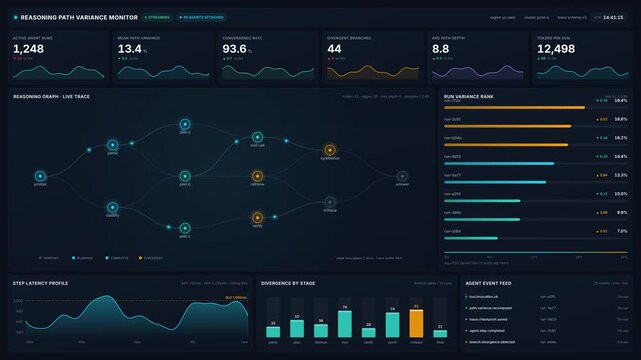
Dark futuristic dashboard for reasoning path variance monitor with live agent trace graph metrics, for artificial intelligence monitoring performance analysis
00:20
HD
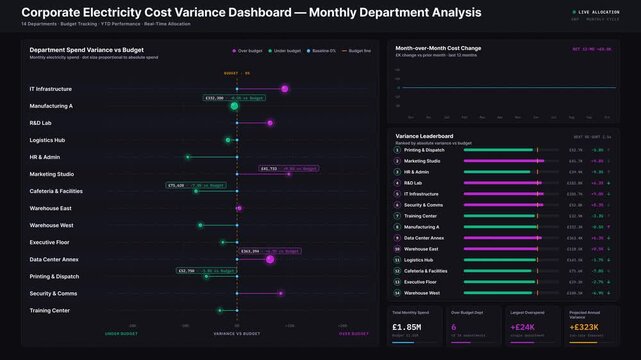
4K corporate electricity cost dashboard ranking departments by monthly energy spending variance with animated lollipop charts and KPIs on dark background.
00:15
HD
4K green screen STOCKTAKE DONE animated text - every shelf gets counted and the variance comes back at nothing, kinetic typography pub and cellar overlay for licensed trade content, chroma key
00:05
HD
Business beige budget planning motion background loop
00:10
HD
Various mathematical and scientific formulas displayed in white font against a dark blue .
00:10
HD
Sci-fi HUD interface green warning screen for MAGNETIC FIELD WEAKENING and mag-field variance
00:10
HD
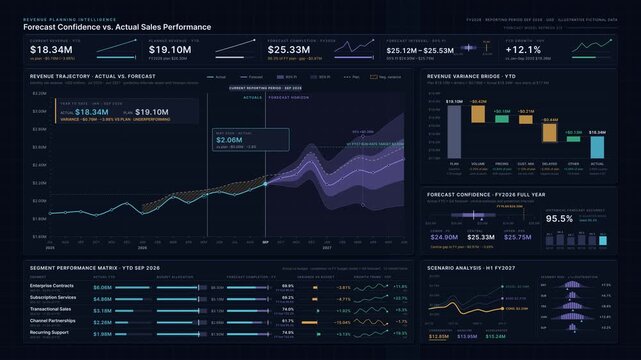
Executive revenue planning dashboard animation comparing forecast confidence intervals and actual sales performance variance across business segments.
00:15
HD
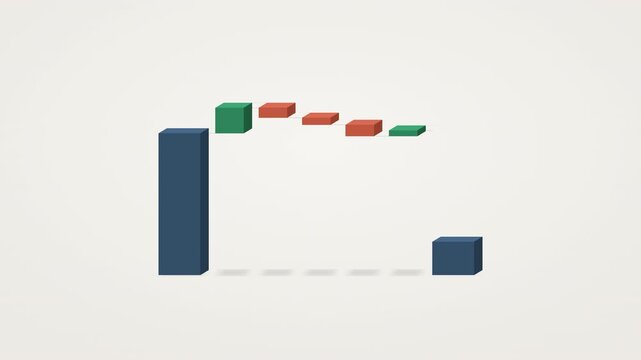
A premium 3D motion graphics asset displaying a true financial variance waterfall chart, transitioning from Budget to Actual results through positive and negative impacts.
00:08
HD
An accrued expense develops a variance after a chargeback, and reconciliation posts the correction, with the recommended approach emphasized. Flat 3D style.
00:08
HD
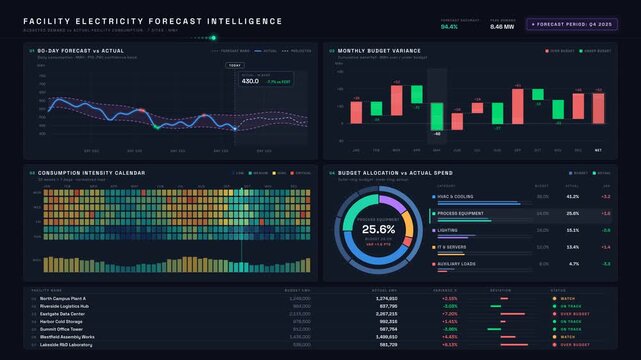
Premium 4K electricity forecast dashboard comparing budgeted demand and actual facility consumption with animated charts, heatmap, and variance tables on dark background.
00:15
HD
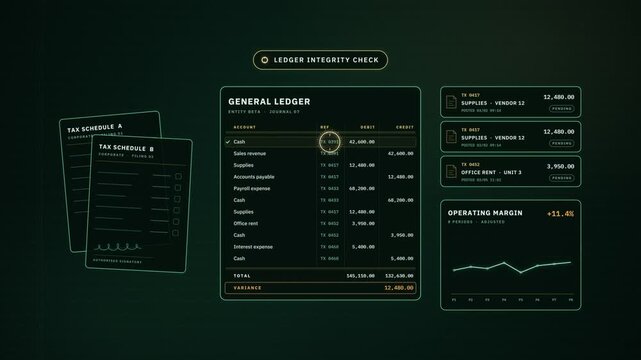
General ledger audit animation, scan finds a duplicate entry, clears variance and balances debit and credit
00:14
HD
2D physics animation comparing a pendulum clock at the base and top of a mountain to illustrate gravitational time variance simulation.
00:34
HD
Blue data analysis spine grid with glowing pattern nodes motion
00:08
HD
Process variance concept with a business planning system showing financial analysis, project development, and a data management strategy for optimizing company workflows
00:17
HD
Cumulative step blocks and connector ties cascading from left to right with positive and consolidating bars.
00:06
HD
Financial waterfall chart building profit variance bridge
00:10
HD
Synthetic data visualization showing statistical variance and dynamic parameters changing across digital interface screens with abstract colorful particle animations
00:06
HD
Profit margin variance tracking matrix monitoring institutional cost efficiency, perfect asset for corporate board meetings and fiscal budget review loops
00:17
HD
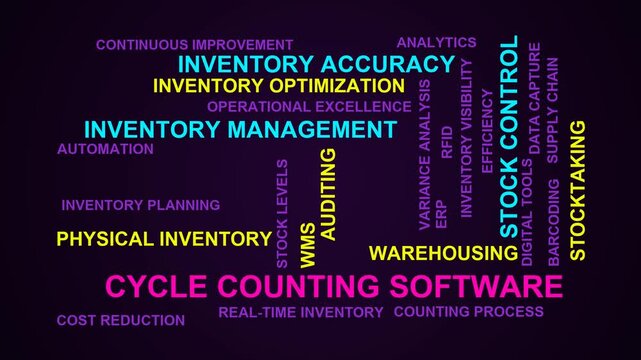
Cycle Counting Software Word Cloud
00:11
HD
Manager and analyst review budget data on computer. A businesswoman leans over a young colleague who points at a budget variance report on the screen. Mentoring and financial control at work.
00:08
HD
Animated budget variance dashboard card displaying financial performance against plan for corporate budgeting
00:08
HD
Cinematic 4K procurement dashboard visualizing supplier cost versus fulfillment performance with animated dark analytics interface for commercial creative technology and business use.
00:15
HD
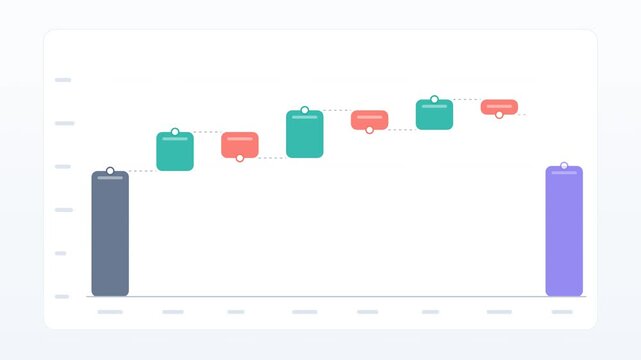
Colorful waterfall bridge chart with teal gains orange losses and gray totals connected by joint bars
00:10
HD
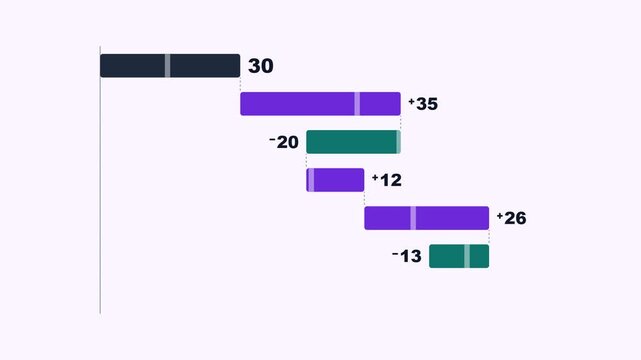
Violet and teal horizontal bridge graph of budget changes on lilac
00:10
HD
Debate, scientists and computer analysis as two laboratory colleagues discuss molecular data face to face beside a research monitor, for problem solving, critical review and scientific communication.
00:15
HD
Sci-fi HUD interface green warning screen for GLOBAL NAVIGATION ERROR and mag-field variance
00:10
HD
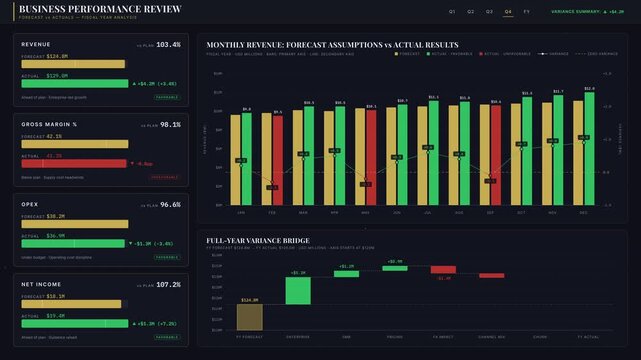
Executive business performance dashboard animation comparing financial forecast assumptions against actual quarterly results with premium dark interface design.
00:15
HD
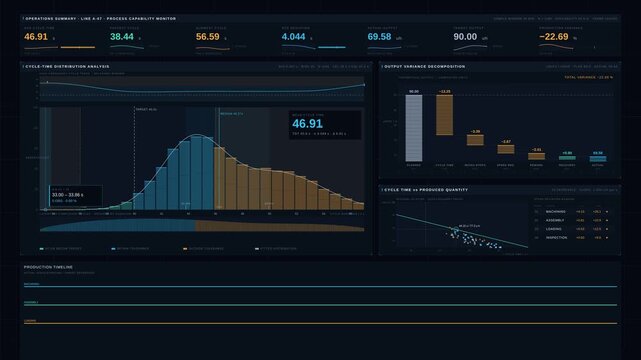
Cinematic smart factory performance dashboard visualizing cycle times and output variance with animated histograms, waterfall charts, and process timing diagrams in a premium midnight blue.
00:15
HD
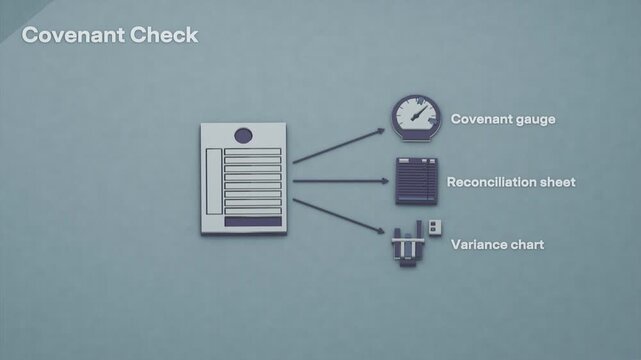
Monthly accrual postings feed book reconciliation, variance analysis and a covenant test that flags a waiver request. Flat 3D style with English labels.
00:08
HD
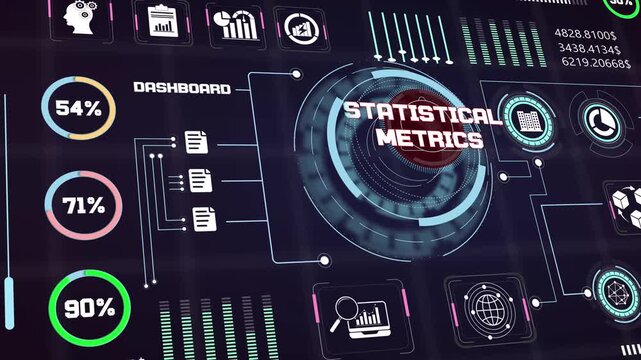
Quantitative analysis system evaluating precise statistical metrics values along with modern corporate network interfaces
00:15
HD
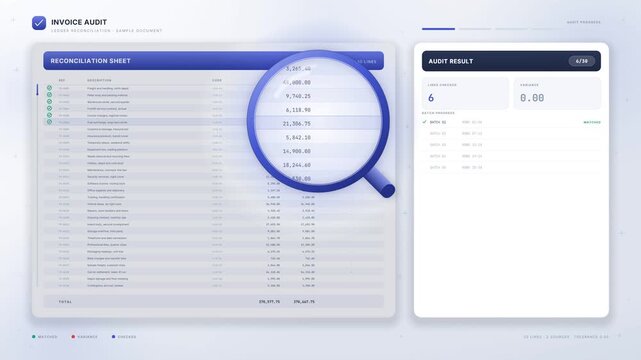
Invoice audit interface with magnifying glass checking ledger rows and flagging a variance
00:24
HD
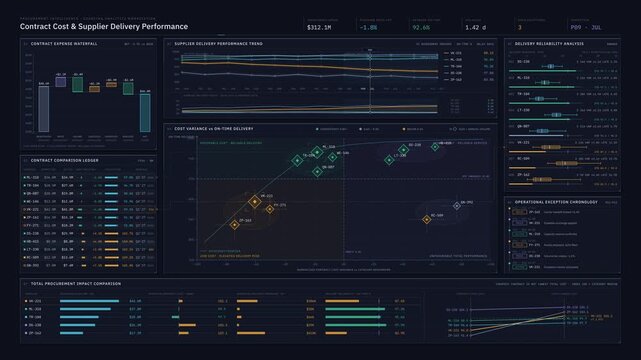
Premium enterprise procurement dashboard animation comparing supplier contract costs, purchase price variance, and on-time delivery performance trends in 4K UHD.
00:15
HD
Blue data analysis wave grid with pattern detection motion background
00:12
HD
Performance variance analysis evaluating business indicators and financial data for business growth, strategy, improvement, and effective management, tracking project metrics and operational goals
00:17
HD
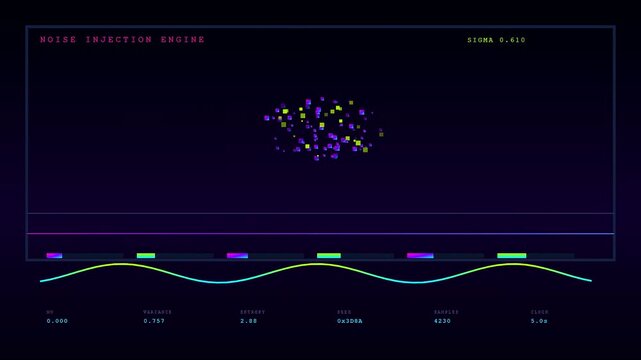
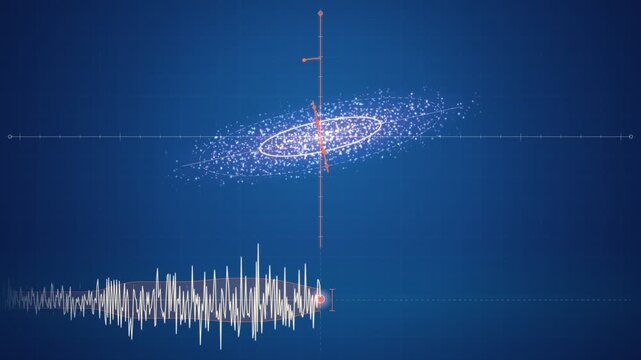
Noise blob squeezing into a slim ellipse on a phase axis
00:15
HD
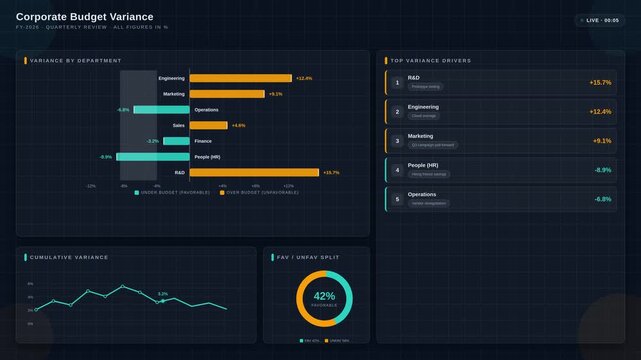
Corporate budget variance dashboard showing financial data charts on a dark digital screen
00:15
HD
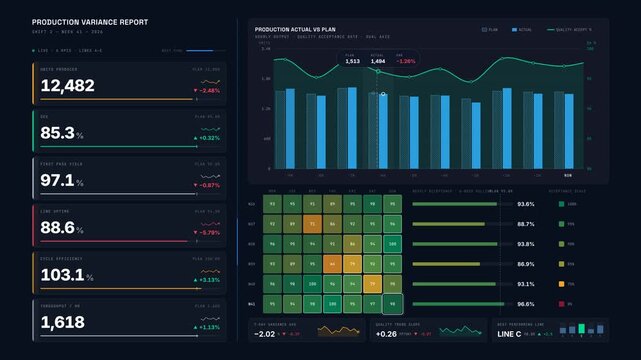
Premium 4K manufacturing performance dashboard displaying production variance KPIs and quality acceptance trends with animated dual-axis charts and heatmap grid in dark mode.
00:15
HD
Manager, woman and laptop in office for advice on expense tracking, budget variance or tax portal. Accountant, mentor and happy on tech for accounting software, explain payroll info or revenue report
00:08
HD
Fp And A Word Cloud
00:11
HD
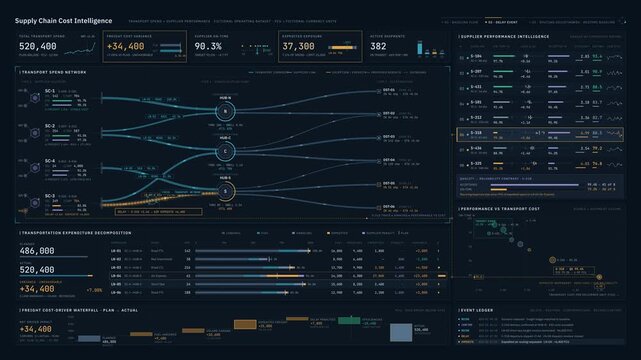
Supply chain cost dashboard animation with transport spending and freight cost variance
00:15
HD
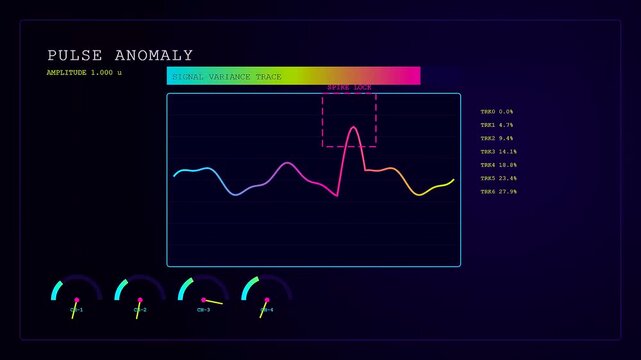
Digital anomaly detection interface showcasing fluctuating neon waveforms on a dark screen with shifting peak values and radial gauges monitoring system signal variance over time
00:06
HD
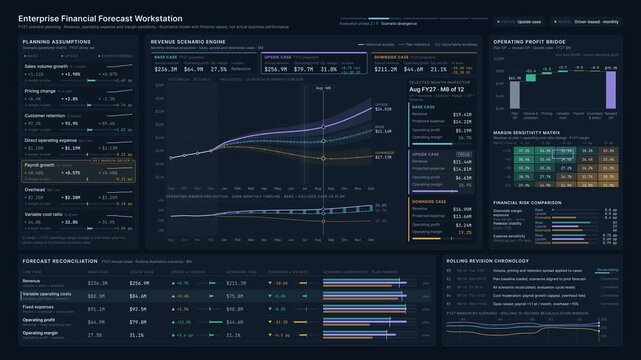
Cinematic 4K enterprise financial forecasting dashboard comparing revenue scenarios, operating margins, and profit sensitivity with animated data visualization.
00:15
HD
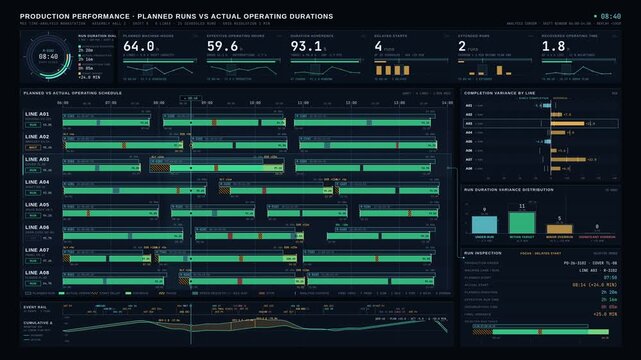
Cinematic 4K production performance dashboard comparing planned manufacturing runs against actual operating durations with Gantt timeline analysis for commercial creative technology and business use.
00:15
HD
Corporate profit bridge graph with orange decline columns on white
00:10
HD
Financial Analyst Woman Using Computer To Prepare Corporate Budget Forecasts
00:19
HD
Floating mathematical formulas, scientific equations including quadratic, calculus, probability, and physics expressions on a dark, glowing blue screen surface.
00:10
HD
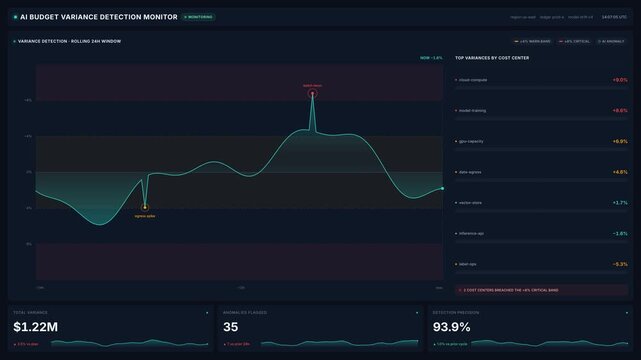
Ai budget variance detection monitor dashboard with 24 hour line chart cost center percentages, for 4k financial analytics, cloud spend tracking budget control
00:20
HD
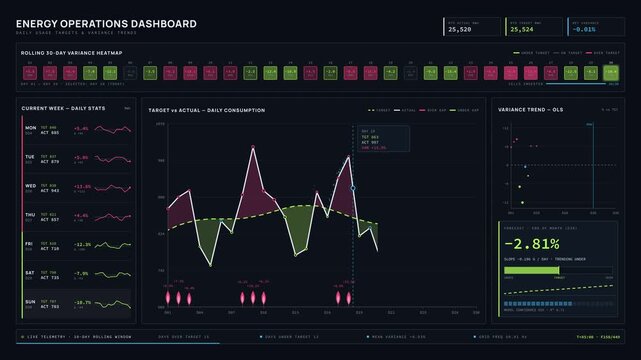
Explore an Energy Operations Dashboard showcasing daily usage targets and variance trends with dynamic charts and vibrant color-coded heatmaps for effective monitoring.
00:15
HD
Accrual reconciliation follows a standing procedure from expense recognition through chargeback variance matching to journal adjustment and close. Flat 3D style.
00:08
HD
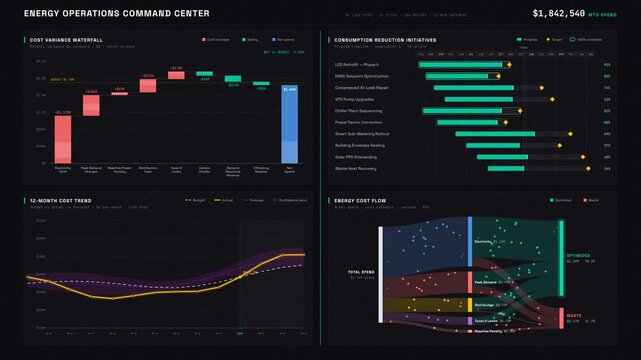
Premium dark corporate energy operations dashboard displaying cost variance waterfall charts, live consumption reduction initiative tracking, and financial metrics in a high-end command center.
00:15
HD
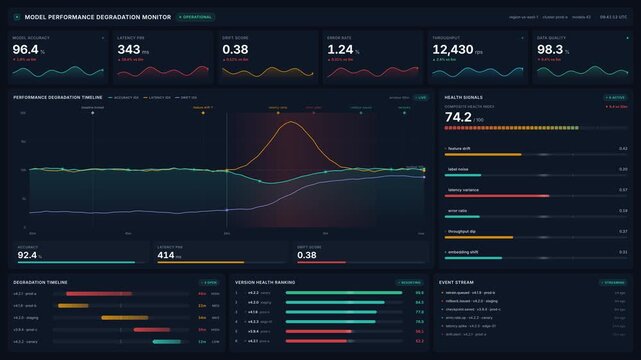
Model performance degradation monitor dashboard with metrics, for ai system monitoring, error rates, data quality tracking, software reliability analysis in tech operations
00:20
HD
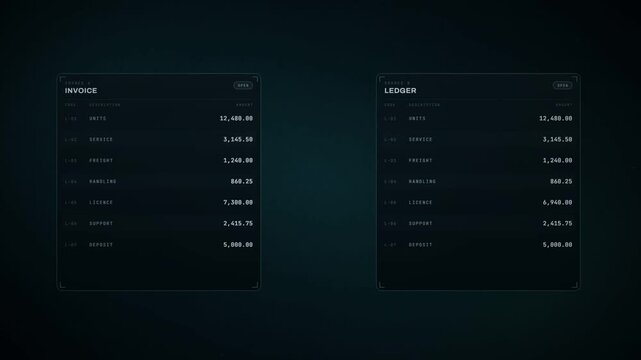
Invoice and ledger reconciliation animation with variance detection and matched line items
00:25
HD
Global Conflict Warfare and Geopolitical Tension 3D Word Cloud Animation with Risk Keywords Including Instability, Hostility, Crisis, Aggression and Sanctions on Blue Backdrop
00:10
HD
Profit margin variance analyzing business financial performance. Tracking revenue. Costs. And expenses with declining charts. Money bags. Coins
00:17
HD
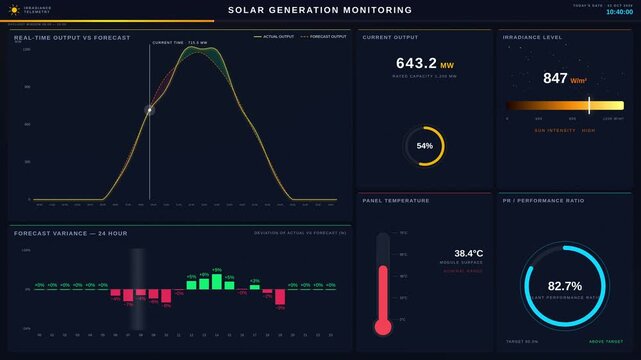
Experience a sophisticated solar generation monitoring platform showcasing real-time output and forecast variance on a sleek dark-mode dashboard with engaging animations and visualizations.
00:15
HD
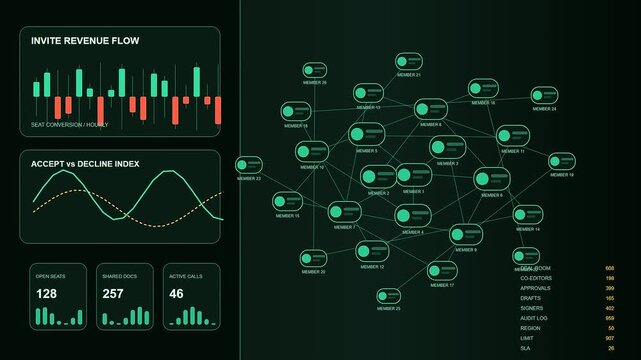
a Collaboration invite flow displays complex network node growth and financial metric variance on a digital dark dashboard screen to track team member activity levels
00:06
HD
Purple probability and statistics formulas with variance and entropy equations drift diagonally across a dark violet background
00:17
HD
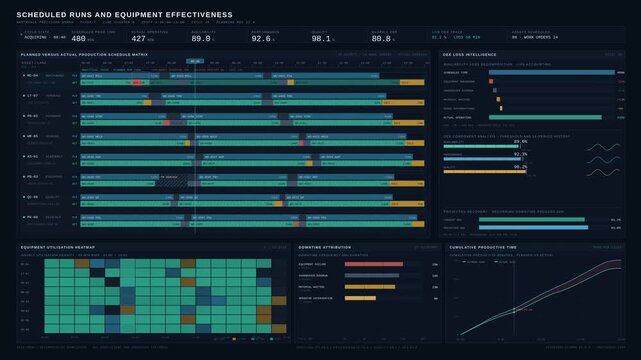
Factory OEE dashboard comparing scheduled manufacturing runs with actual operating time, unplanned interruptions, idle periods, and changeovers on a dark industrial analytical interface.
00:15
HD
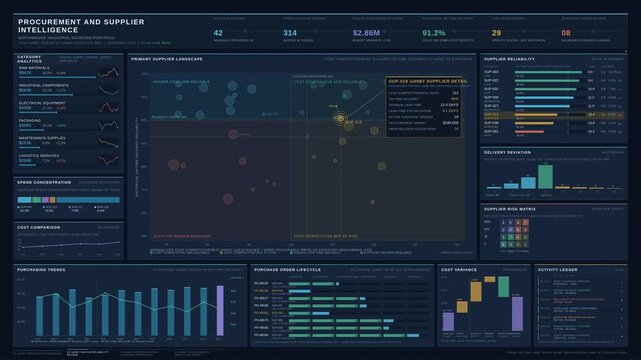
Premium enterprise procurement dashboard tracking supplier delivery reliability, cost competitiveness, and purchasing expenditure trends in dark UI for commercial creative technology and business use.
00:15
HD
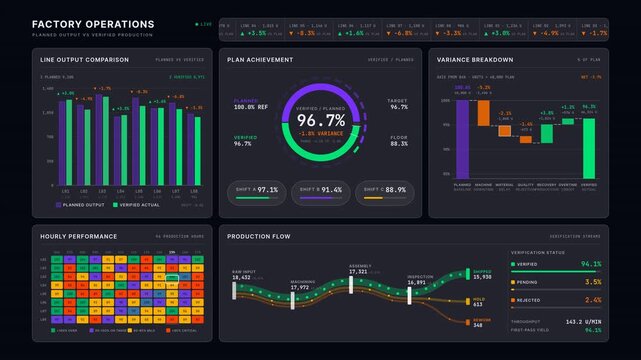
Cinematic 4K factory operations dashboard comparing planned output and verified production results with animated charts, glass panels, and neon accents in a dark industrial interface loop.
00:15
HD
Deepfake AI crimes detection technology with digital lip sync variance analysis revealing manipulated speech patterns on futuristic interface risks
00:05
HD
Animated horizontal bar chart rising to equal lengths then shifting into a shorter or disappearing pattern on white background. Business data transition infographic.
00:05
HD
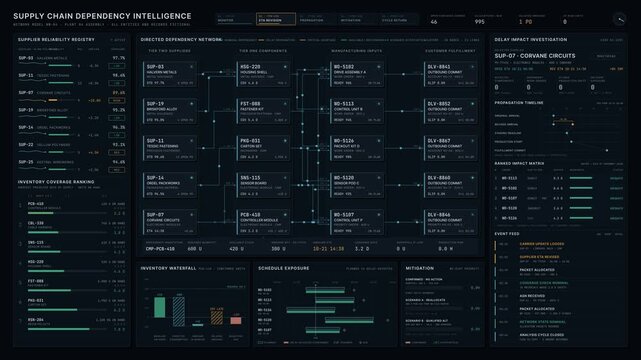
Cinematic 4K supply chain dashboard visualizing supplier delay propagation through dependency layers with amber risk highlights and inventory status metrics.
00:15
HD
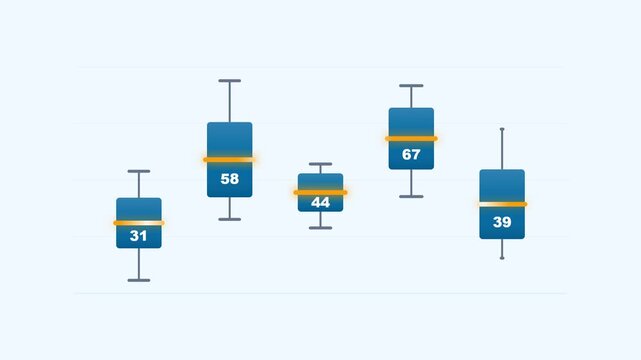
Azure data distribution boxes showing variance on pale sky page
00:08
HD