ระบบได้ส่งลิงก์สำหรับตั้งรหัสผ่านของคุณไปที่: ต่อไปนี้คุณจะต้องใช้รหัสผ่านในการเข้าถึงสินค้าที่คุณได้ซื้อ
รับภาพประกอบ 25 ภาพหรือวิดีโอ 3 รายการเมื่อทดลองใช้ฟรี
เพิ่มตัวกรองใหม่แล้ว
เรียงลำดับตาม

47 ผลลัพธ์สำหรับ quadrant graph ใน วิดีโอ

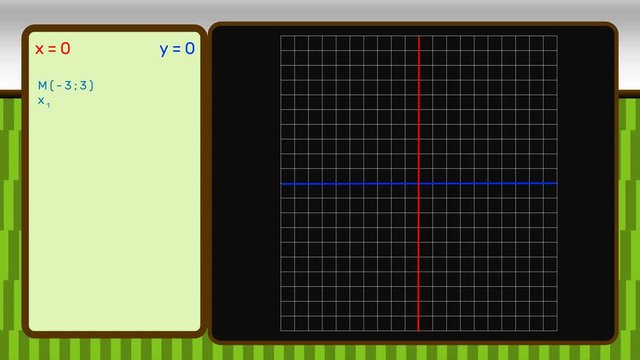
Algebra. Primary School. Basic school. Visual animation of the construction of points on the coordinate area of Cartesian
00:37
HD
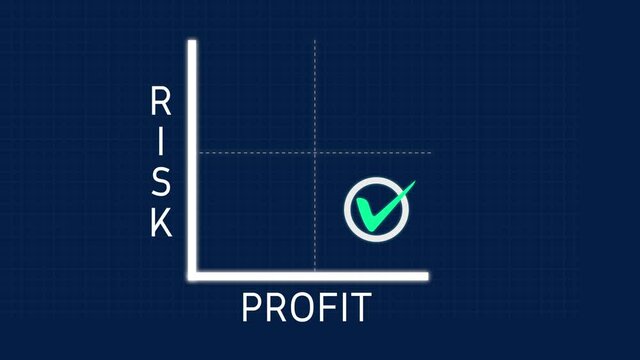
Risk and Profit Matrix Diagram Chart with Checkmark on Risk Animation on Solid Background and Green Screen
00:20
HD
Colorful scatter plot graph illustrating mathematical Cartesian coordinate system with four distinct quadrants on a dark grid
00:09
HD
Sector Rotation Quadrant Chart with Orbiting Data Dots Seamless Loop
00:15
HD
High-tech cooling water dashboard visualizing circulation efficiency, losses, and pump demand with animated metrics and sleek dark-mode design for industrial applications.
00:15
HD
On launch radial HUD pulsing spinning rings graph rising turning green candles showing data
00:12
HD
Priority quadrant comparing effort and business impact in cyan
00:10
HD
Animated matrix quadrants infographic in a modern flat vector style, quadrants assembling together in a smooth 4K loop. Blank text placeholders and fresh green accents sit on a bright light background
00:07
HD
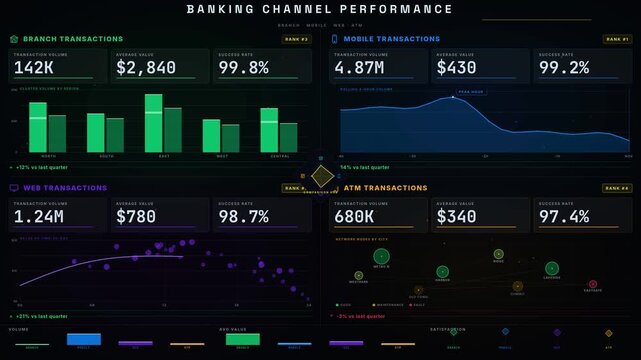
Visualize the Banking Channel Performance Dashboard comparing Branch, Mobile, Web, and ATM transactions with a dark aesthetic and vibrant color-coded quadrants.

00:15
HD
Tech dashboard with compact bar charts and neon lines
00:11
HD
Market Analysis Bubble Quadrant Chart Animation
00:10
HD
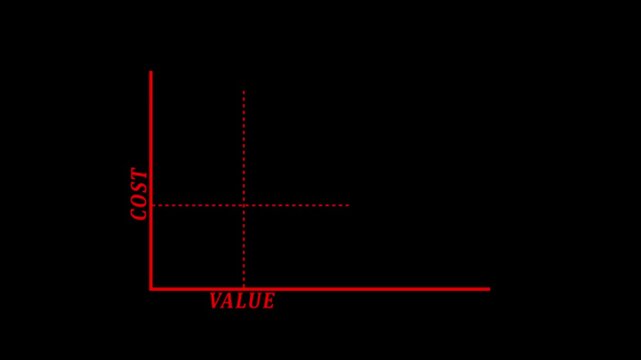
Cost benefit analysis. Concept about the relationship between Low Cost and High Value.4k
00:10
HD
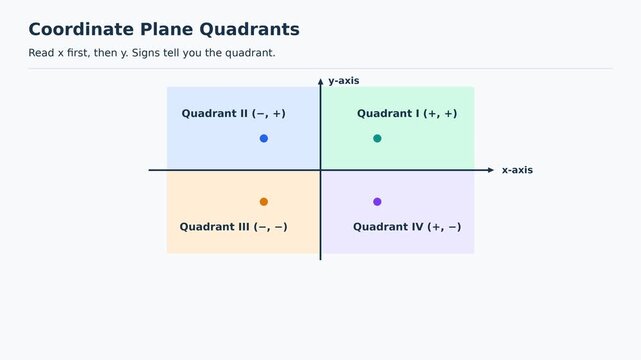
Coordinate Plane Quadrants, X Axis, Y Axis and Origin Explained, Educational Maths Animation, Easy to Learn Mathematics for Kids, Classroom Explainer Video
00:10
HD
An animated scatter plot visualizes a risk-return matrix with data points dynamically converging from the origin, showcasing investment analysis in a modern design.
00:15
HD
Cost benefit analysis. Concept about the relationship between Low Cost and High Value.4k motion graphics video
00:06
HD
Team Discussing Concept of Growth Share Matrix or Product Portfolio Matrix - Animation Illustration as MP4 file
00:10
HD
Geometric Shapes Moving into a 2D Cartesian Coordinate System with Axis on a Green Screen Background
00:08
HD
ROI - Return On Investment
00:08
HD
A checkered pattern of light blue and deep purple creates a precise geometric crosshair design that conveys a message of technical accuracy and systematic mathematical structure at once
00:10
HD
Animated circular business infographic with data icons for financial reports.
00:10
HD
Algebra. Primary School. Basic school. Visual animation of the construction of a line if the coordinates of two points on a given line are given.
00:37
HD
Risk and Profit Matrix Diagram Chart with Checkmark on Profit Animation on Solid Background and Green Screen
00:20
HD
2D mathematical animation showing Cartesian coordinate system grid setup with animated axes X and Y mapping points in space, conceptual geometry visualization
00:56
HD
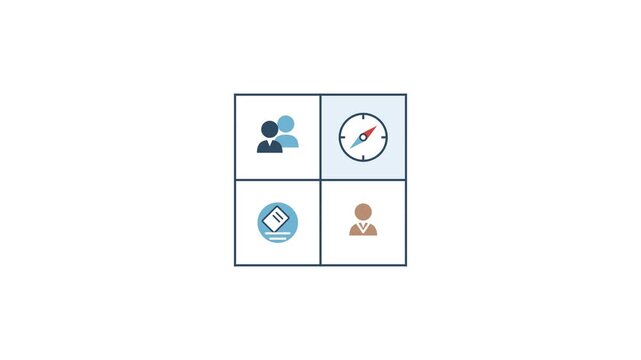
Strategic Business Matrix Diagram with Corporate Icons Animation
00:05
HD
Progetto quadrati con luci daykrim
00:13
HD
On interface launch GUI panels animating while central node network growing visualizing data flow
00:15
HD
Priority quadrant comparing effort and business impact in white
00:10
HD
Vertical 9:16 animated quadrant chart animation point in green and teal on a dark background. Seamless looping 4K data visualization in portrait format for reels, shorts, stories and mobile presentati
00:07
HD
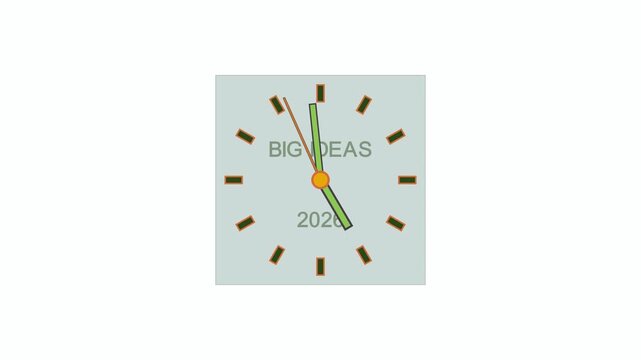
Clock faces move with Big Ideas and the years 2026. Four clock quadrants show a concept about business time
00:12
HD
animated video scattered with the words ABSCISSA on a white background
00:11
HD
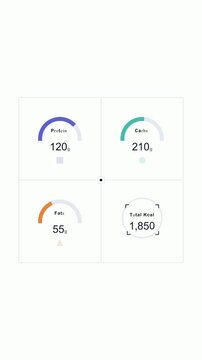
Grid layout dashboard showing macro nutrient gauges
00:10
HD
4k Cost benefit analysis. Concept about the relationship between Low Cost and High Value.
00:10
HD
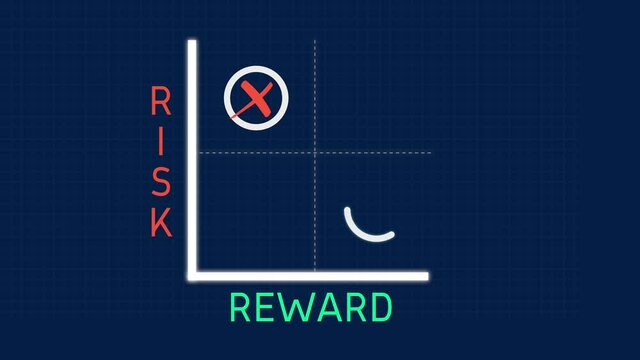
Risk and Reward Matrix Diagram Chart with Checkmark on Reward and Risk Animation on Solid Background and Green Screen
00:20
HD
Priority quadrant comparing effort and business impact in cobalt
00:10
HD
Risk and Profit Matrix Diagram Chart with Checkmark on Profit and Risk Animation on Solid Background and Green Screen
00:20
HD
Priority quadrant comparing effort and business impact in teal
00:10
HD
Grid-triggered bars emerging and expanding into quadrants with line graphs tracing trends rotating
00:11
HD
Team tapping tablet, placing sticky notes on clear grid glass, making data overlay for product plan
00:12
HD
Algebra. Primary School. Basic school. Visual animation of the construction of lines on the coordinate square of Cartesian
00:21
HD
3D Earth globe popping against starry grid, rotating as charts and labels updating tracking trends
00:12
HD
Cost benefit analysis. Concept about the relationship between Low Cost and High Value.4k motion graphics video
00:08
HD
Cost benefit analysis. Concept about the relationship between Low Cost and High Value.4k motion graphics video
00:10
HD
Cost benefit analysis. Concept about the relationship between Low Cost and High Value.4k motion graphics video
00:10
HD
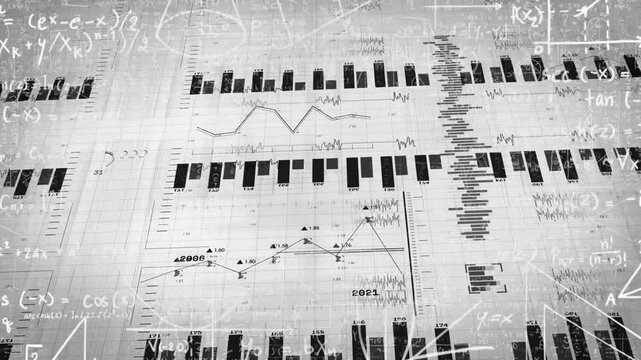
Starting white bars rising on grid, splitting quadrants, overlaying line graphs highlighting trends
00:11
HD
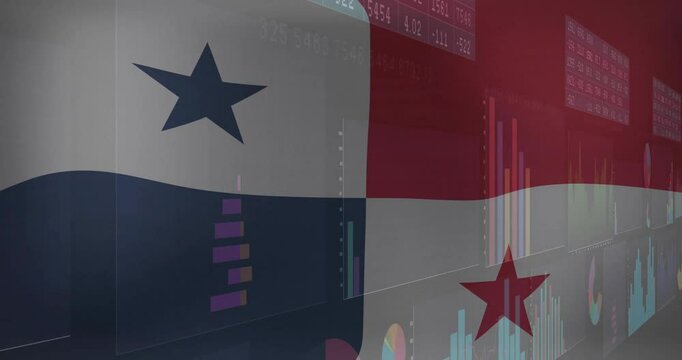
Panama flag graphic being overlaid with colorful financial dashboards and charts in flat design
00:12
HD
Growth Share Matrix or Product Portfolio Matrix - Animation Illustration as MP4 file
00:10
HD
Vertical video: Neon green zigzag appearing on frame4, growing and tracing peaks visualizing data
00:12
HD