ระบบได้ส่งลิงก์สำหรับตั้งรหัสผ่านของคุณไปที่: ต่อไปนี้คุณจะต้องใช้รหัสผ่านในการเข้าถึงสินค้าที่คุณได้ซื้อ
รับภาพประกอบ 25 ภาพหรือวิดีโอ 3 รายการเมื่อทดลองใช้ฟรี
เพิ่มตัวกรองใหม่แล้ว
เรียงลำดับตาม

19,774 ผลลัพธ์สำหรับ increase and decrease ใน วิดีโอ

Cost Reduction Business Growth Motion Graphics Line Chart Arrow Down Concept, Financial Loss Analysis, Budget Cut Optimization, Downward Arrow Graphic with Text Animation on Black Background.
00:10
HD
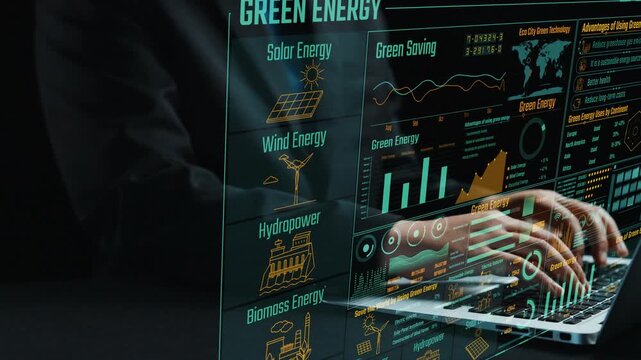
A sleek digital interface presenting various green energy solutions, showcasing trends and analytics across solar, wind, and biomass to promote sustainability and ecological awareness. Cipher
00:10
HD
Benin Crude Oil Price Drop with Oil Barrels Downward Green Arrow and 3D Financial Data Visualization Graphs for Economy and Business Concept
00:11
HD
Health care concept. Keyword weight and increase and decrease neon glowing arrow icons.
00:08
HD
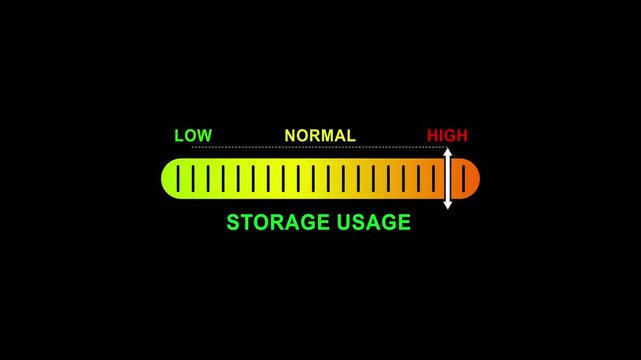
storage usage level indicator scale. Low normal high meter infographic animation on black background. Showing high pressure level color gauge indicator.4k animation video
00:10
HD
Glowing purple neon continuous line forming up and down arrows isolated on black background, perfect for finance, trade, and data exchange concept.
00:10
HD
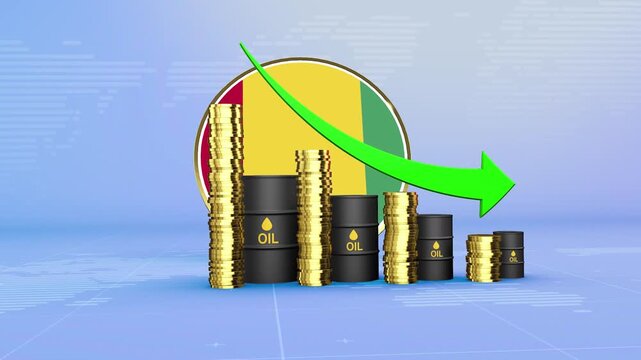
Guinea Oil Prices Decline with Oil Barrels, Gold Coins and Downward Green Arrow, 3D Economic and Financial Market Concept
00:11
HD
Animated white line graph arrow pointing downwards on black background, for financial analysis, and market trend presentation
00:10
HD
Business Profit and Loss Chart Animation
00:06
HD
Reuse level indicator scale. Low Normal High meter infographic animation on black background. Showing high reuse level color gauge indicator for sustainability and eco-friendly practices.
00:10
HD
Personal Skills Word Cloud
00:11
HD
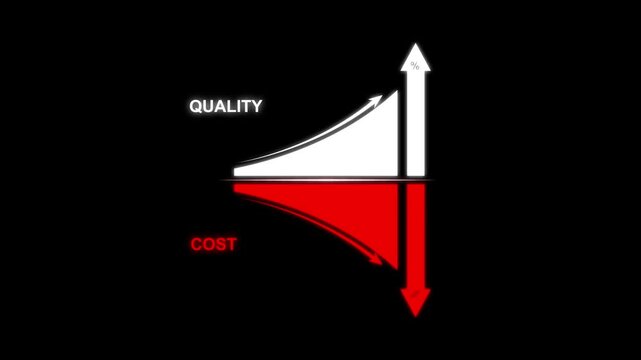
Cost control and quality improvement concept. Red bar chart with line graph showing cost reduction and improving quality. Successful business strategy, efficiency, product optimization and management
00:06
HD
Focus level indicator scale. Low normal high meter infographic animation on black background. Showing high focus level color gauge indicator for mental performance and productivity monitoring.
00:10
HD
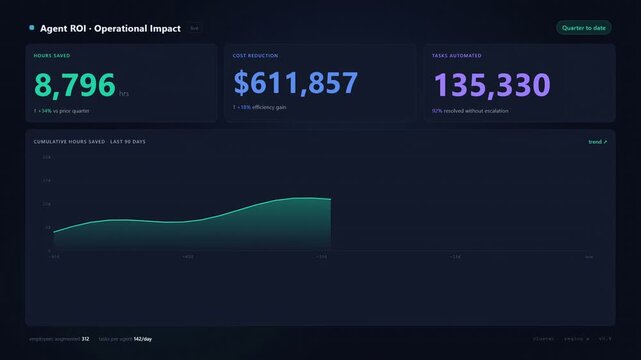
Animated Agent ROI & Operational Impact Dashboard UI. Dark mode interface showing hours saved, cost reduction, tasks automated counters, and cumulative growth charts.
00:15
HD
Vibrant Green Digital Marketing Promotional Graphics for Seasonal Retail Shopping Events and Massive Discount Sales Campaigns
00:06
HD
Financial Growth Graph Animation Featuring Increasing Business Performance Bars
00:07
HD
Business concept showing hand receiving goods, a delivery truck with dollar signs, and a gauge indicating price fluctuations influenced by market supply and economic factors
00:17
HD
glowing neon Percentage growth and decline icon with up and down arrows. financial, business, and statistical analysis. Up and down percentage arrows icon.
00:10
HD
Futuristic dollar countdown timer animation, glowing dollar symbol integrated with a circular countdown display, numbers decreasing smoothly from 0 to 60,
00:10
HD
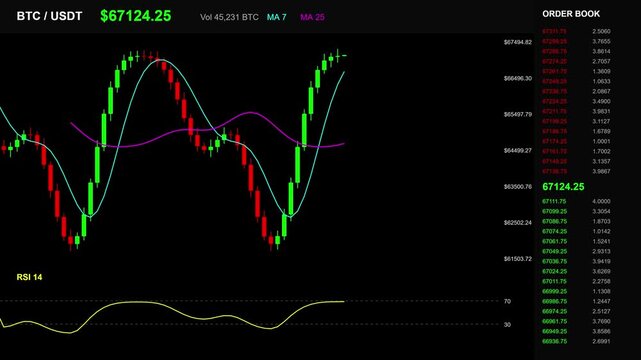
Cryptocurrency trading dashboard with multiple market price charts
00:09
HD
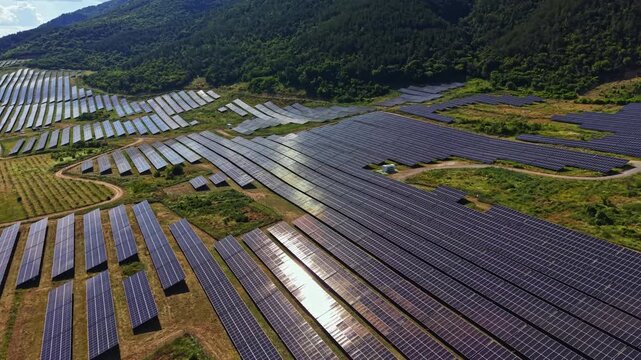
Rows of solar panels stretch across the landscape under clear skies. The sun reflects off the panels, showcasing the energy production in a rural area during daytime.
00:20
HD
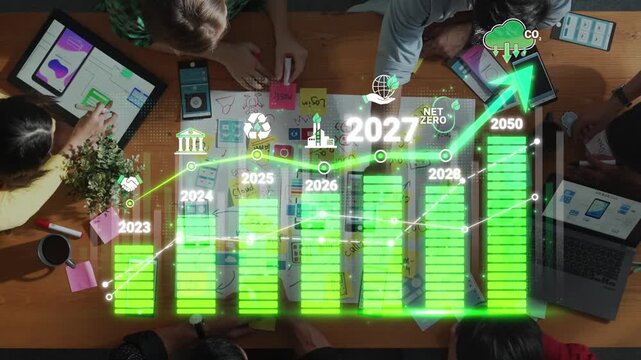
Team Collaboration on Environmental Goals and Sustainable Development with Graphs and Charts for Future Planning and Climate Action Initiatives in 2023 Sigmoid
00:20
HD
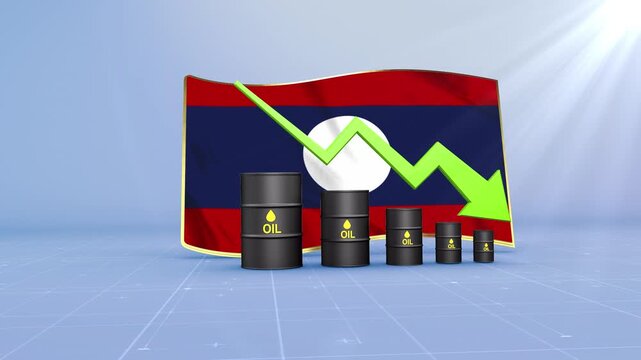
Laos Oil Price Falling with Oil Barrels Downward Green Arrow and 3D Financial Data Visualization Graphs for Economy and Business Concept
00:11
HD
Glowing neon red animated line graph illustrating a downward market trend on black background. 4K Video motion graphic animation
00:10
HD
Zigzag line with a downward arrow falling trend loss decline and negative business direction animation
00:06
HD
Glowing green neon continuous line forming up and down arrows isolated on black background, perfect for finance, trade, and data exchange concept.
00:10
HD
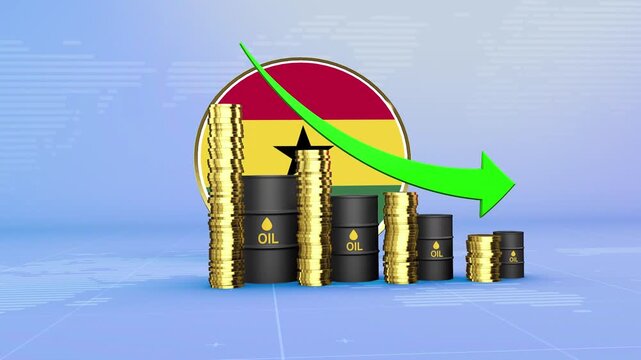
Ghana Oil Prices Decline with Oil Barrels, Gold Coins and Downward Green Arrow, 3D Economic and Financial Market Concept
00:11
HD
Down arrow business graph chart animation. Loss business graph icon animation.  on black background. 4k video
00:10
HD
hydration index level indicator scale. Low normal high meter infographic animation on black background. Showing high pressure level color gauge indicator.4k quality animation video
00:10
HD
Animated down graph icon designed in flat icon style. Finance, Business Info graphic animation, Bar down graph Animated down graph icon, business or finance, down graph bar,4k video
00:10
HD
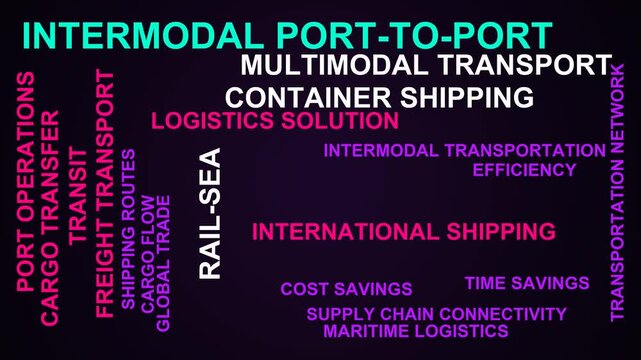
Intermodal Port-To-Port Word Cloud
00:11
HD
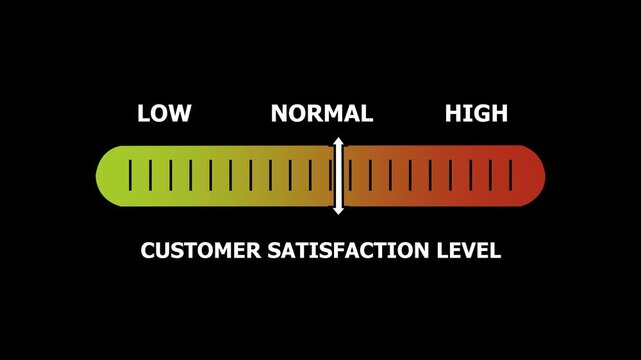
coustomer satisfaction level indicator scale. Low normal & high meter infographic animation. Showing high coustomer satisfaction level color gauge indicator. on a black background 4k animation video
00:10
HD
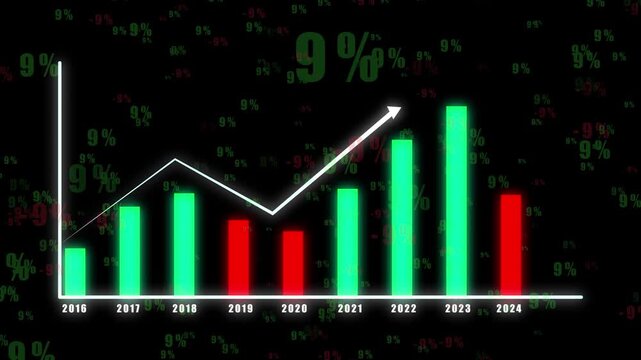
Bar chart animation shows declining percentages on black. Negative economic trading analytics track on bar chart animation. Financial investment downturn marks the chart.
00:07
HD
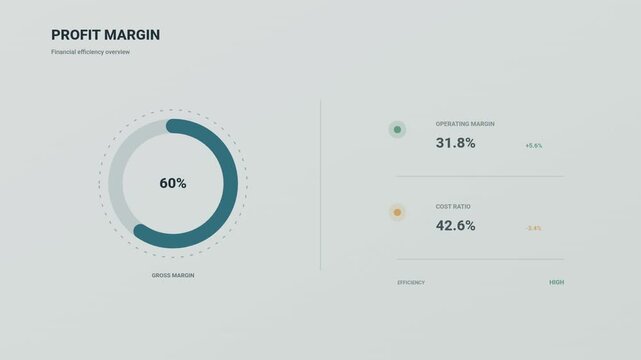
Financial profit margin analysis with circular progress bar and data charts showing performance metrics
00:10
HD
Business Person Calculating Financial Budget and Debt Reduction Strategy
00:15
HD
Revenue and Profit Growth Animation for Corporate Business Reports
00:08
HD
Analyzing price fluctuations showing various financial indicators. Including a decreasing value graph. A risk warning. A computer monitor with performance charts
00:17
HD
policy level indicator scale. Low normal & high meter infographic animation. Showing high policy level color gauge indicator. on a black background 4k animation video
00:10
HD
Bright white 3D number 2012 text animation floating against a deep black void offering a vibrant and modern visual for the year with a sense of digital energy.
00:10
HD
Glowing white bar chart and downward arrow illustrating business decline, financial loss and economic downturn. Concept of recession, falling profits, market crash and negative growth performance
00:12
HD
Speaker Volume Level Animation. Volume Sound Control Animation on Black Background, Audio Level Up and Down Icon.
00:10
HD
Hands Over Laptop with Digital Graph Showing Growth Projections for Future Years Including 2023, 2024, 2025, 2026, and 2027 in Business Context Sigmoid
00:10
HD
Haiti Oil Price Falling with Oil Barrels Downward Green Arrow and 3D Financial Data Visualization Graphs for Economy and Business Concept
00:11
HD
Reuse level indicator scale. Low Normal High meter infographic animation on black background. Showing high reuse level color gauge indicator.
00:10
HD
2027 New year with change to UP and Down arrow. Interest rate, GDP, stocks market, financial, deflation and Inflation, mortgage, debt, Loan and Economic Recession
00:09
HD
Urgency level indicator scale. Low normal & high meter infographic animation on black background. Showing high urgency level color gauge indicator for task priority time management and workflow.
00:10
HD
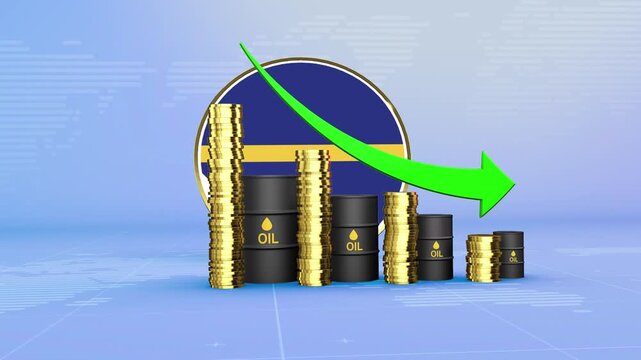
Nauru Oil Prices Decline with Oil Barrels, Gold Coins and Downward Green Arrow, 3D Economic and Financial Market Concept
00:11
HD
Neon dollar coin icon animation with up and down arrows for financial market trends on black background, 4K
00:10
HD
toxicity level indicator scale. Low normal high meter infographic animation on black background. Showing high pressure level color gauge indicator.4k quality animation video
00:10
HD
Cost Reduction Business Growth Motion Graphics Line Chart Arrow Down Concept, Financial Loss Analysis, Budget Cut Optimization, Downward Arrow Graphic with Text Animation on Black Background.
00:10
HD
Joint Mobilization Word Cloud
00:11
HD
Graph chart animation minimalist business data presentation finance statistics growth seamless loop motion graphics. Animated graph chart grid minimalist business data.
00:08
HD
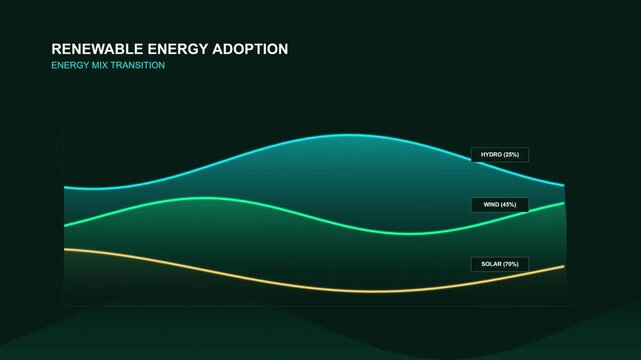
Sustainability data visualization showing renewable energy metrics
00:10
HD
Red downward arrow on digital financial graph showing declining market trend and investment data visualization
00:15
HD
Brightness slider level control animation isolated on black background, slider level adjust 0 to 100, simple brightness contrast icon animated.
00:06
HD
dollar up and down arrow animation, money icon, dollar sign, up and down arrows, 4k video.
00:10
HD
Proactive risk prevention strategy involves identifying potential threats. Managing hazards with strategic planning
00:17
HD
Glowing Neon Percentage Growth and Decline Icon Animation with Up and Down Arrows on Black Background, Financial Business Statistics, 4K Motion Graphics Loop..
00:10
HD
Bright white 3D number 2019 text animation floating against a deep black void offering a vibrant and modern visual for the year with a sense of digital energy.
00:10
HD

Hand drawn fluctuating line chart animation showing changing values, market volatility, financial analysis, data trends, uncertainty and performance movement.
00:07
HD
Sugar at high levels, displayed on a barometer or tachometer, illustrating excess sugar intake, potential impact on health, and the need for balanced dietary regulation and moderation
00:10
HD
A collaborative business environment showcasing a digital globe with eco-friendly icons, charts, and graphs illustrating innovative strategies for sustainable development and growth. Raster
00:12
HD
Grenada Oil Price Falling with Oil Barrels Downward Green Arrow and 3D Financial Data Visualization Graphs for Economy and Business Concept
00:11
HD
Thermometer Temperature Increase and Decrease Animation Clinic and Weather Alpha Channel 4K Resolution
00:10
HD
Money reduction icon animation on black background. Dollar currency price drop concept. circle with down arrow moving animation. 4k video
00:10
HD
Efficiency level indicator scale. Low normal & high meter infographic animation on black background. Showing high efficiency level color gauge indicator for Performance and productivity monitoring.
00:10
HD
Bosnia and Herzegovina Oil Prices Decline with Oil Barrels, Gold Coins and Downward Green Arrow, 3D Economic and Financial Market Concept
00:11
HD
Glowing red downward arrows pulsing on dark background with subtle particles, concept for financial decline, market crash and negative growth


00:10
HD
network quality level indicator scale. Low normal high meter infographic animation on black background. Showing high pressure level color gauge indicator.4k animation video
00:10
HD
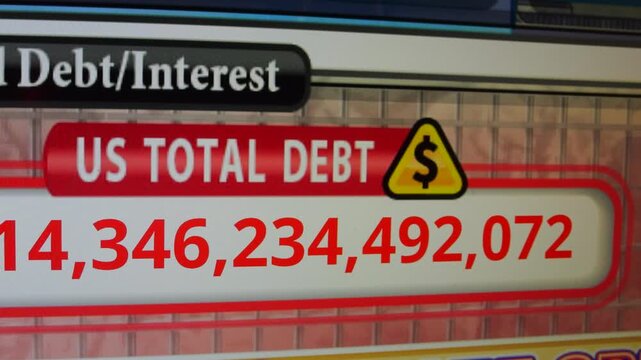
Visual Breakdown of U.S. Total Debt Data Over Time
00:15
HD
Mental Stimulation Word Cloud
00:11
HD
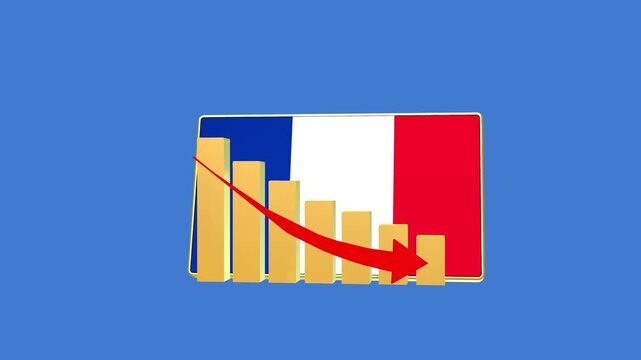
France economic bar chart graph showing decreasing downturn with national Flag 3D animation on black background.
00:16
HD
Zoom in and out animation the image symbol. Large black symbol in the center and four small symbols around. Seamless looped 4k animation on white background
00:12
HD
Red stock market line graph motion graphics on black triangle over green screen background loop
00:10
HD
Spinning gold coin stack with rising and falling arrows
00:10
HD
weather level indicator scale. Low normal & high meter infographic animation. Showing high weathe level color gauge indicator. on a black background 4k animation video
00:10
HD
Automated manufacturing process focusing on efficiency, cost reduction, and quality control, optimizing industrial operations and increasing business productivity with smart planning
00:17
HD
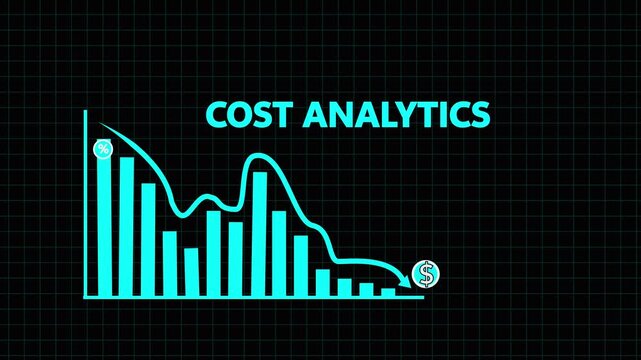
 blue line graph showing a downward trend with percentage and dollar symbols indicating cost analytics and financial reduction on a dark grid background .4k
00:10
HD
Bright white 3D number 2035 text animation floating against a deep black void offering a vibrant and modern visual for the year with a sense of digital energy.
00:10
HD
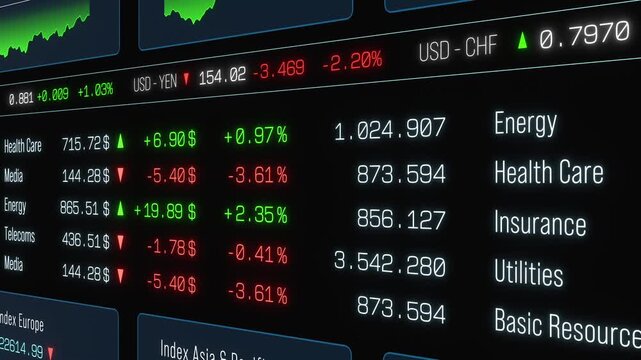
Stock market sector data, trading board, prices and changes, up and down. Financial market, sector data, prices, trading volume, investment information.
00:10
HD
Decarbonization, featuring a vibrant green plant in the foreground with a CO2-emitting industrial chimney in the background, symbolizing the balance between industry and environmental sustainability.
00:15
HD
A professional individual holds a glowing globe representing net zero emissions. Surrounding icons symbolize eco-friendly concepts and innovations in sustainability. Qubit
00:15
HD
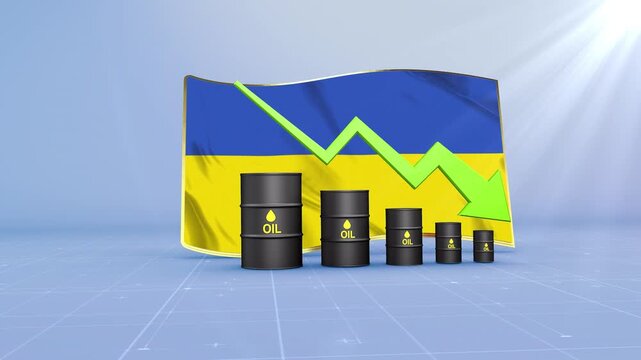
Ukraine Oil Price Falling with Oil Barrels Downward Green Arrow and 3D Financial Data Visualization Graphs for Economy and Business Concept
00:11
HD
Abstract financial chart with falling bars downward market trend and low performance with grid and world map details animation
00:10
HD
Red neon sign financial bar chart falling with downward arrow. Illustrating stock market crash, business loss, economic recession, financial decline, and negative investment trend. 4k motion videos
00:10
HD
Colorful Bar Chart Illustrating Business Data and Financial Growth Trends.
00:05
HD
Poland Oil Prices Decline with Oil Barrels, Gold Coins and Downward Green Arrow, 3D Economic and Financial Market Concept
00:11
HD
Fullscreen icon animation on green background. Exit full screen mode, multimedia player animation. Increasing and decreasing screen size animation. Zoom expand for screen scaling and full screen mode
00:08
HD
connection strength level indicator scale. Low normal high meter infographic animation on black background. Showing high pressure level color gauge indicator.4k animation video
00:10
HD
A symbol representing business collaboration. Business partnerships to enhance development and gain a competitive advantage. Cost reduction and improved economies of scale. Business leadership.
00:10
HD
Angular Acceleration Word Cloud
00:11
HD
Carbon molecules morph into green leaves in this abstract illustration, representing the vital process of CO2 being converted to oxygen through photosynthesis. Carbon reduction
00:10
HD
Zoom in and out animation the giraffe head symbol. Large black symbol in the center and four small symbols around. Seamless looped 4k animation on white background
00:12
HD
Neon Dollar Sign with Downward Arrows in a Circle
00:10
HD
Opening neon-green map starting shifting bar chart and expanding pie segment presenting global data
00:12
HD
Animated business data visualization bar chart purple pink neon grid background. Animated bar graph chart data visualization business finance purple pink neon 4k loop.
00:09
HD
Child centered play therapy developing children's communication skills and emotional regulation through engaging activities, fostering growth and reducing stress
00:17
HD
Fading in translucent data panels animating line graphs and bar charts in office displaying metrics
00:05
HD
A colorful 3D bar graph with pastel bars is displayed on a round white platform against a minimal background.
00:09
HD
A Bitcoin Coin placed on a Financial Chart Background representing its market dynamics and trends
00:13
HD