ระบบได้ส่งลิงก์สำหรับตั้งรหัสผ่านของคุณไปที่: ต่อไปนี้คุณจะต้องใช้รหัสผ่านในการเข้าถึงสินค้าที่คุณได้ซื้อ
รับภาพประกอบ 25 ภาพหรือวิดีโอ 3 รายการเมื่อทดลองใช้ฟรี
เพิ่มตัวกรองใหม่แล้ว
เรียงลำดับตาม

19,770 ผลลัพธ์สำหรับ increase and decrease ใน วิดีโอ

HUD particle and elememt three graph radar pointer with percent text and radar reletion with scale bar on the black screen
00:14
HD
Malta Oil Price Falling with Oil Barrels Downward Green Arrow and 3D Financial Data Visualization Graphs for Economy and Business Concept
00:11
HD
Man holding smartphone displaying a financial graph with downward trend and percentages shown
00:10
HD
Business graph growth concept in allusive graph chart showing marketing sales profit decreasing to future target. Downfall financial status of corporate business going down.
00:20
HD
Screen Brightness Increase and Decrease Animation.
00:07
HD
Green color up and down business graph chart with growing business concept. Bar chart animation with decreasing trend perfect for financial downturn.
00:06
HD
Grow chart business concept. Financial data and diagrams showing a steady increase in profits.growing business graph with arrow
00:10
HD
CO2 reduce.Net Zero 2050.Green energy zero emission carbon co2 reduction graph charts,business virtual touch screen to show alternative energy growth.4k video.Place for text or logo
00:15
HD
Uruguay economic bar chart graph showing decreasing downturn with national Flag 3D animation on black background.
00:16
HD
Finger pressing green eco mode button at auto panel. Safety concept
00:07
HD
Mix data Minimal Bar Charts, Financial Business Analytics, Performance, growth, loss, profit, decrease, increase, random data, motion graphic on a dark classic abstract background
00:08
HD
A modern business setting showcasing a smartphone displaying a glowing digital earth, symbolizing commitment to net zero and sustainability through technology and innovation. Qubit
00:12
HD
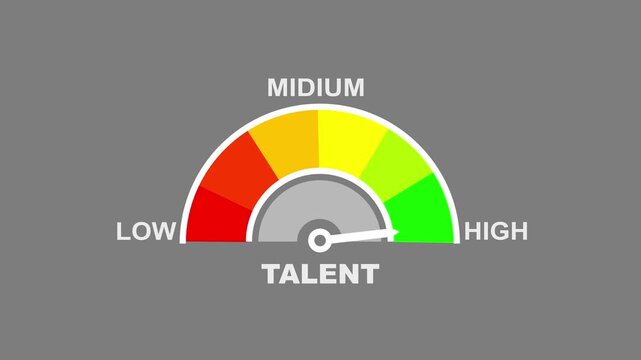
A colorful gauge talent levels from low to with a needle pointing towards medium on a black background. talent level text or word low and medium to high meter concept.
00:10
HD
Hand Drawn Profit Growth Graph Animation with Business Finance Chart and Coin Icons
00:16
HD
Abstract 3D number 1945 text animation floating against a deep black void offering a vibrant and modern visual for the year with a sense of digital energy. 4k motion video.
00:10
HD
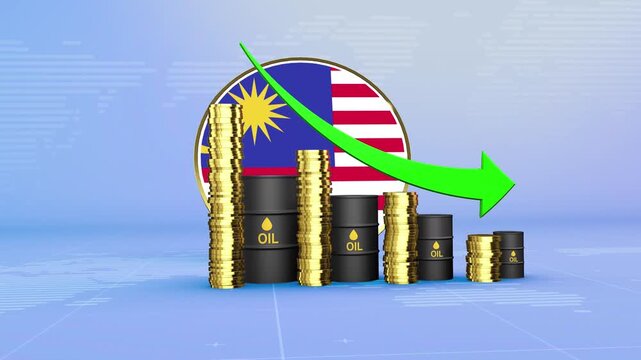
Malaysia Oil Prices Decline with Oil Barrels, Gold Coins and Downward Green Arrow, 3D Economic and Financial Market Concept
00:11
HD
Three-word text animation featuring Feel The Power with sequential word reveal, spacing reduction effect, and zoom transition in 3840x2160 format.
00:12
HD
White Vertical Double- Ended Arrow on a Black Background down direction
00:06
HD
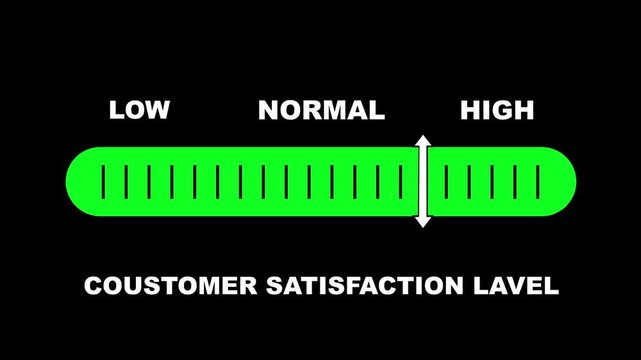
Customer satisfaction level indicator scale. Low normal & high meter infographic animation on black background. Showing high level color gauge indicator for business service quality and experience.
00:10
HD
Green pixel block dissolving with particles and red bar declining. Data visualization of asset reduction and value decrease for business.
00:08
HD
Neon line Percentage icon Quality control growth graph and cost reduction animation. Percentage quality with up arrow, cost with down arrow.
00:10
HD
Bolivia country flag and bar chart graph showing decreasing values a red arrow economic crisis concept. Flag of Bolivia
00:11
HD
White Percentage Symbol Icon with Horizontal Arrows on Black Background discount sale
00:10
HD
Zoom in and out animation the spade symbol. Large black symbol in the center and four small symbols around. Seamless looped 4k animation on white background
00:12
HD
Finance and statistics motion. Blue bar graph animation perfect for corporate videos. Abstract financial data visualization. Animated blue bar graph with dark background.
00:14
HD
Animation of statistics and digital data processing over orange background
00:12
HD
Neon stock market growth with warning sign on black background animation
00:08
HD
Animated bar graph chart data business finance growth success statistics minimalist black white abstract motion graphics presentation template financial report infographic visualization economic.
00:08
HD
Animation of down business graph icon. business or finance loss concept icon ,Animated downward statistical curve with a loss sign.cyan color business graph,cyan grid line and white background .
00:08
HD
A business graph up to a down blue arrow with an animated. Animation of a blue arrow chart graph on a black background with a grid. Video footage
00:10
HD
Golden wheat sways gently in the breeze under a warm sun, with a slow pan across the field, creating a cinematic, serene agricultural scene ideal for nature and farming themes.
00:10
HD
A visual representation of hands uniting, symbolizing the collaborative effort needed to achieve carbon neutrality by 2050. The image emphasizes teamwork and environmental responsibility. Raster
00:15
HD
A bar graph with red and green bars arranged in a rising and falling pattern on a neutral background
00:08
HD
Animation of Progress Bar With Percentage Increase/Decrease.
00:20
HD
Arrow continuous line 4K animation video showing downward direction on a minimal background
00:10
HD
Dominican Republic Oil Prices Decline with Oil Barrels, Gold Coins and Downward Green Arrow, 3D Economic and Financial Market Concept
00:11
HD
Video with the phrase Optimize Your Campaigns in Spanish, animated word by word with letter spacing reduction and sharp zoom transitions, delivered in four background and outline versions.
00:12
HD
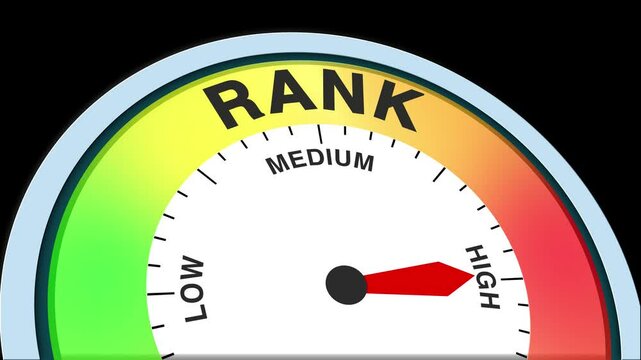
Rank Level Text or Word Low and Medium to High Meter Concept Animation on Black Background and Blue Screen
00:58
HD
Life expectancy level indicator scale. Low Normal High meter infographic animation on black background. Animation showing high life expectancy level color gauge indicator for health and longevity.
00:10
HD
glowing neon Percentage growth and decline icon with up and down arrows. financial, business, and statistical analysis. Up and down percentage arrows icon. Perfect for reports and dashboards 4k.
00:10
HD
Sales Growth Gauge Meter Indicating Normal Level on White Background indicator measurement
00:10
HD
Khakassia Country Flag and Bar Chart Graph Showing Decreasing Values a Red Arrow Economic Crisis Concept
00:11
HD
Arrow going down tradingtone, animated in neon light
00:10
HD
Neon glowing regression meter showing big risk levels. Dangerously increasing values of regression, critical overload. Too much, off the charts. Abstract meter scale with arrow. Business concept.
00:10
HD
Business efficiency concept, how much a company or organization can produce as it relates to time, cost and quality. Glowing neon line of scalability solutions icon isolated on transparent background.
00:15
HD
Red neon glowing economic downturn chart. Falling stock market graph. Financial crisis and decline business concept footage.
00:05
HD
Directional neon arrow icon animation.
00:08
HD
difficulty level indicator scale. Low normal & high meter infographic animation. Showing high difficulty level color gauge indicator. on a white background 4k animation video
00:10
HD
Animated growth hormone level meter decreasing from normal to low level for low growth hormone, hormone imbalance, and health awareness
00:10
HD
server status level indicator scale. Low normal high meter infographic animation on black background. Showing high pressure level color gauge indicator.4k animation video
00:10
HD
Black color arrow rising transparent channel. Abstract arrow growth chart of economy icon black color animated down to up arrow animation, on a white background, direction animation,with video
00:05
HD
AI supports net zero goals via virtual assistant insights, AI-based green strategies, and artificial intelligence for climate-aware business planning. Kernel
00:13
HD
Shopping in grocery store, couple with basket over bar chart animation
00:12
HD
Abstract dollar sign icon and up arrow animation on a black background. Upward arrow and dollar icon. High pricing icon. profit, investment, growth business, economy, finance and success concept
00:10
HD
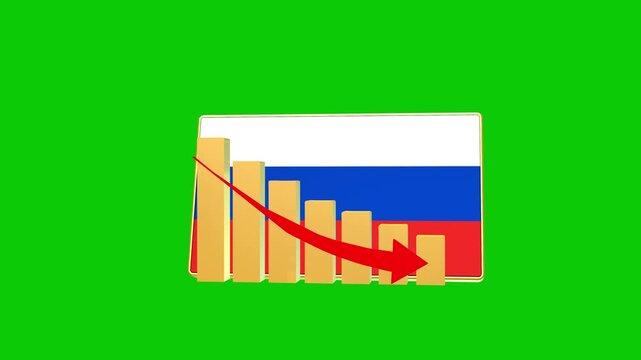
Russia economic bar chart graph showing decreasing downturn with national Flag 3D animation on black background.
00:16
HD
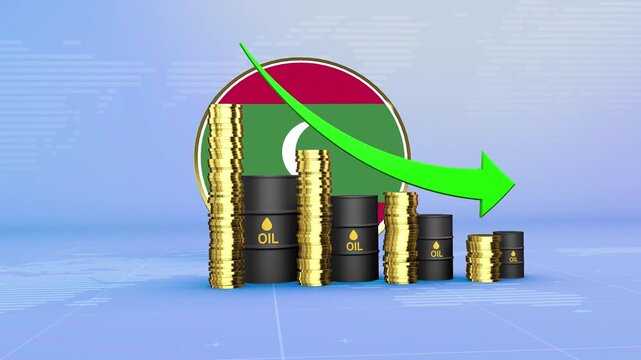
Maldives Oil Prices Decline with Oil Barrels, Gold Coins and Downward Green Arrow, 3D Economic and Financial Market Concept
00:11
HD
Three-word text animation featuring Increase Team Efficiency with sequential word reveal, spacing reduction effect, and zoom transition in 3840x2160 format.
00:12
HD
Green dollar bill with a downward arrow, symbolizing financial decline. Suitable for finance, economy, recession, and moneysaving concepts.
00:06
HD
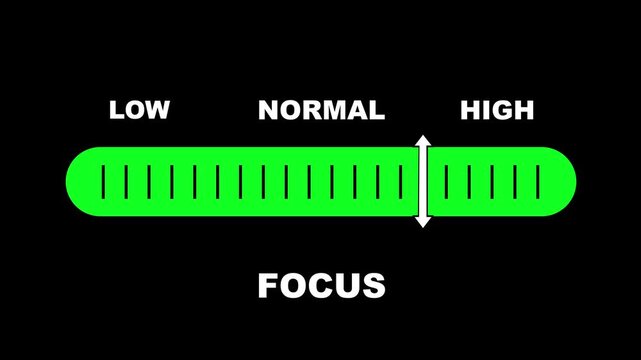
Focus level indicator scale. Low normal high meter infographic animation on black background. Showing high focus level color gauge indicator for mental performance and productivity monitoring.
00:10
HD
Hygiene level indicator scale. Low normal high meter infographic animation on white background. Showing high hygiene level color gauge indicator for personal health and wellness monitoring.
00:10
HD
A hand-drawn red arrow pointing upwards with a gritty, brush-stroke texture on a black background
00:09
HD
Tonga Oil Price Falling with Oil Barrels Downward Green Arrow and 3D Financial Data Visualization Graphs for Economy and Business Concept
00:11
HD
Bar chart with red arrow showing rapid economic decline
00:15
HD
Abstract business growth and graph chart icon animation. business graph showing growth on blue  grid background.
00:10
HD
Falling red bar graph showing financial decline on dark digital background, business analytics and data loss visualization
00:06
HD
Screen Brightness Increase and Decrease Animation.
00:07
HD
Financial Growth Graph Animation Featuring Increasing Business Performance Bars
00:07
HD
Modern line graph displays falling investment market trends. Technical line graph monitors negative corporate revenue data. Financial crisis concept with digital line graph.
00:10
HD
Red color up and down business graph chart with growing business concept. Bar chart animation with decreasing trend perfect for financial downturn.
00:06
HD
system load level indicator scale. Low normal high meter infographic animation on black background. Showing high pressure level color gauge indicator.4k animation video
00:10
HD
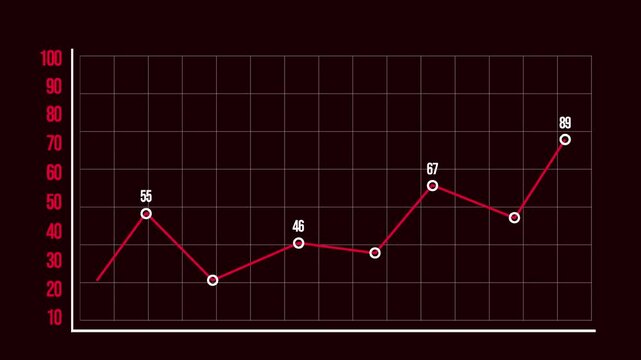
Red line graph against black background
00:05
HD
Businessman wears virtual reality headset while engaging with cost trend analysis in a modern office, showcasing the intersection of technology and finance. Raster
00:16
HD
Red arrow, pointing down, with white outline, motion, graphic, on, Alpha channel, isolated, directional, indicator, downward, trend, decrease, negative, growth, download, icon.
00:07
HD
Zoom in and out animation the server symbol. Large black symbol in the center and four small symbols around. Seamless looped 4k animation on white background
00:12
HD
Increasing brightness bar animation, Brightness level slider animation for light intensity adjustment.
00:10
HD
Liberia Oil Prices Decline with Oil Barrels, Gold Coins and Downward Green Arrow, 3D Economic and Financial Market Concept
00:11
HD
Three word kinetic typography sequence displaying Scale Your Business with sequential letter spacing reduction and sharp zoom transition
00:12
HD
Growth reduction process concept - Detail of hand removing blocks from pyramid
00:10
HD
Dopamine level indicator scale. Low normal & high meter infographic animation on black background. Showing high dopamine level color gauge indicator for brain neurotransmitter mental health.
00:10
HD
Response level indicator scale. Low normal & high meter infographic animation on black background. Showing high response level color gauge indicator for customer service and communication analysis.
00:10
HD
Green Neon Outline of Bar Chart with Upward Trend and Downward Arrow on Black Background graph statistics
00:10
HD
Congo Republic Oil Price Falling with Oil Barrels Downward Green Arrow and 3D Financial Data Visualization Graphs for Economy and Business Concept
00:11
HD
Abstract financial chart with upward trend line and bar graph data background
00:10
HD
Office icon. Web icon set. Office, great design for any purposes. Motion graphics.
00:36
HD
Price reduction. Manager of street cafe changes price tag for menu on chalkboard.
00:16
HD
Creativity Meter Animation: Track and Compare Creativity from Low to High Levels with Dynamic Increasing/Decreasing Gauge for Data Visualization, Performance Insights, and Motion Graphics
00:10
HD
Animated financial chart starting with rising bars drawing trend lines illustrating market shift
00:15
HD
Animation of several red downward arrows.
00:05
HD
arrow rising and down transparent channel with grid background.
00:10
HD
Percentage growth and decline icon with up and down arrows. financial, business, and statistical analysis. Up and down percentage arrows icon.
00:10
HD
Grwoing and decreasing Dynamic Line Graph Motion Pack | Stock Market & Investment Trends, growth, loss, Financial simple Analytics Stats, currency, gold,symbolic, motion graphic on a transparent BG
00:15
HD
Futuristic robots interact with visual data displays, showcasing global cost analysis trends. A sleek design illustrates declining metrics, highlighting financial insights. Synapse
00:14
HD
Quality and cost .Business concept of quality control and cost reduction  animation video.
00:10
HD
Futuristic city skyline with lush green rooftop gardens
00:10
HD
Noisy leaves rustling footage for noise reduction
00:06
HD
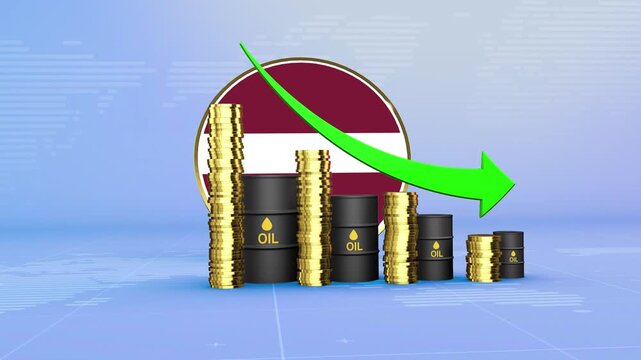
Latvia Oil Prices Decline with Oil Barrels, Gold Coins and Downward Green Arrow, 3D Economic and Financial Market Concept
00:11
HD
Dynamic Line Graph Finance and Economy Animation.
00:16
HD
Zoom in and out animation the wrench symbol. Large black symbol in the center and four small symbols around. Seamless looped 4k animation on white background
00:12
HD
dollar increases icon,dollar increases icon,
00:10
HD
2D animation of a bar chart with a rising trend on a transparent background. Ideal for business growth, data visualization, finance, and success-themed content. Loss bar chart, financial decrease stat
00:04
HD