ระบบได้ส่งลิงก์สำหรับตั้งรหัสผ่านของคุณไปที่: ต่อไปนี้คุณจะต้องใช้รหัสผ่านในการเข้าถึงสินค้าที่คุณได้ซื้อ
รับภาพประกอบ 25 ภาพหรือวิดีโอ 3 รายการเมื่อทดลองใช้ฟรี
เพิ่มตัวกรองใหม่แล้ว
เรียงลำดับตาม

19,768 ผลลัพธ์สำหรับ increase and decrease ใน วิดีโอ

Down business graph icon .business or finance concept icon. Abstract decreasing business graph chart animation background.
00:10
HD
Energy Healing Level Text or Word Low and Medium to High Meter Concept Animation on Black Background and Blue Screen
00:58
HD
Quality control and company cost reduction. Cost and quality control concept. Percentage icon of quality and cost with up and down ,neon line blinking animation. Successful organization strategy .
00:10
HD
Digital Globe Concept Ecological Green Energy Icons on Young plant springing up out of the moss soil
00:10
HD
Fresh green shoots grow out of the ground in the pouring rain
00:10
HD
Animated growth hormone level meter decreasing from normal to low level for low growth hormone, hormone imbalance.
00:10
HD
Wellness level indicator scale. Low normal & high meter infographic animation on white background. Showing high wellness level color gauge indicator for health and lifestyle monitoring.
00:10
HD
 Animated down graph icon designed in flat icon style, business or finance concept icon. Finance, Business Info graphic animation, Bar graph.
00:08
HD
A striking video featuring a human hand and a robotic hand nearing each other, surrounded by digital icons related to cost reduction and financial metrics in a modern workspace. Auvana
00:12
HD
Financial Data Chart Overlaid on Urban Skyline at Night Representing Real Estate Investment Concepts
00:10
HD
Coin Stacks on Graphic Interface with Financial Chart in Background for Trade.
00:09
HD
Energy audit smart home management delivers cost savings and business growth with improved rating system for energy use control and reduced expenses in residential and commercial hand
00:05
HD
Dynamic stock market chart with fluctuating data and financial analysis
00:10
HD
Horizontal Row of Blue Chevron Arrows Pointing Leftward on Black Background direction
00:10
HD
The outbreak of covid-19 has had a significant impact on the global economy
00:15
HD
forest with a digital overlay showing a bar graph and numerical data representing carbon offset values, carbon credit concept.
00:05
HD
Abstract 3D number 1910 text animation floating against a deep black void offering a vibrant and modern visual for the year with a sense of digital energy. 4k motion video.
00:10
HD
Zoom in and out animation the bird symbol. Large black symbol in the center and four small symbols around. Seamless looped 4k animation on white background
00:12
HD
Green energy zero emission carbon co2 reduction graph charts,business virtual touch screen to show alternative energy growth....Generative AI
00:15
HD
Colorful Bar Graph Demonstrates Data Analysis on Desktops at Office
00:07
HD
Black numbers count down from one with three decimal nambers. Digital figures on LCD screen in detail.
00:33
HD
Carbon neutrality concept. increasing loading with carbon reduction for decrease CO2 or carbon neutral. Net zero greenhouse gas emissions target. Climate neutrality long term strategy.
00:10
HD
Rapid change of stock market with Exchange and bid, offer, volume on screen display
00:13
HD
Looped animation of business chart with fluctuating line icons illustrating profit gain and loss in finance sectors. Smooth animated line chart with increasing and decreasing icons for financial.
00:12
HD
Financial data analysis on screens. Charts, graphs, stock market info, and trends are displayed
00:05
HD
Recycling symbol emerging from lush green foliage
00:05
HD
The Rapid Oxygen Production of Jungle Vines: Aiding Environmental Solutions for Cleaner Air. Concept Environmental Science, Oxygen Production, Jungle Vines, Cleaner Air, Rapid Growth
00:04
HD
3.1% colorful percentage numbers formed of multicolored spheres isolated on white for use as a decorative design template for business or advertising
00:10
HD
Cost reduction and cost saving through digital transformation, business cost optimization, operational cost reduction, financial savings, and resource efficiency strategies for business success. Spire
00:20
HD
Observing financial charts, this man performs Tick Data Analysis on multiple screens in his home office.
00:08
HD
Beautiful 3D animation of rising blue bar graph following the arrow, ultra HD 4K
00:13
HD
Business growth concept in graph chart showing marketing sales profit increasing to future target . growing business concept. Clean Hi-tech style technology chart with a grid.
00:08
HD
Arrow continuous line 4K animation video showing downward direction on a minimal background
00:10
HD
Handy arrows for editing use for pointing.
00:09
HD
Colorful Stock Market Graph with Candlestick Chart and Data Lines
00:05
HD
Businessmen with a businesswoman in front forming arrow shape pointing down, 4K, Alpha Channel
00:29
HD
Abstract 3D number 1985 text animation floating against a deep black void offering a vibrant and modern visual for the year with a sense of digital energy. 4k motion video.
00:10
HD
Zoom in and out animation the around the clock symbol. Large black symbol in the center and four small symbols around. Seamless looped 4k animation on white background
00:12
HD
Businessman moves finger up, various animated Stock Market charts and graphs. Increase blue line. 4k animation.
00:18
HD
Trade Stock market business and exchange financial growth graph Chart arrow . Business chart data graph diagram, business trading graph investment growth global trend arrow up and down icon animation
00:12
HD
Future business growth potential. Abstract business growth icon. white  color business graph with up arrow. Arrow rising graph scale symbols on black background.
00:10
HD
coins money stack growing with magnifier glass. Money saving, Inflation, tax, cash flow, Job search, hiring and research development concepts
00:08
HD
Finger touching mitigation icon with globe and document on blurred green natural background
00:10
HD
Animated bar graph chart showing decline and downward trend in business financial market. Business infographic motion graphics of bar chart decrease and financial market drop.
00:08
HD
Business growth chart with rising trend line. Digital stock market data visualization for investment analysis 4k video .
00:10
HD
Animation of a red color share market line is moving downwords.
00:08
HD
Animation of Percent icon and arrow moving downwards, Indicating a price decrease or decrease in revenue target.
00:07
HD
55 percent sign formed of vibrant spheres or balls closely packed in a festive design for use as a template for advertising and marketing
00:10
HD
A robotic hand interacts with digital graphs and icons, illustrating cost reduction in a business setting. This video symbolizes innovation and efficiency in modern finance. Auvana
00:12
HD
Quality control and company cost reduction arrow sign animation. quality with up arrow and cost with down arrow. Cost and quality control concept with black screen. 4k motion video.
00:10
HD
Bars appearing on translucent 3D candlestick chart flowing left over plaza indicating upward trend
00:12
HD
4K multi coloured colour pencils flip animation time lapse time-lapse picture animation colourful increasing colour pens and decreasing them
00:16
HD
Rising arrow glow transparent channel. arrow rising glow   business growth arrow and graph chart, Business line arrow.
00:10
HD
Bad Economy Recession Graph Chart Chalkboard Style Animation
00:12
HD
white colour Business graph chart & business growth animation in black background,glowing business graph animation with red background.
00:10
HD
High-tech greenhouse with systems optimizing plant growth, symbolizing advanced agriculture techniques for reducing carbon emissions. Carbon footprint reduction technology
00:06
HD
Abstract 3D number 1929 text animation floating against a deep black void offering a vibrant and modern visual for the year with a sense of digital energy. 4k motion video.
00:10
HD
Zoom in and out animation the credit card symbol. Large black symbol in the center and four small symbols around. Seamless looped 4k animation on white background
00:12
HD
Lots of young green shoots grow out of the soil
00:10
HD
Animated Expansion and Contraction of red quarter circle on plain blue color only. Raw animation background for presentation, projects, news. Beautiful, colorful looping motion backdrop.
00:15
HD
A glowing light bulb on a blue background, with an upward graph line representing growth or innovation.
00:05
HD
Red colorful downward trend arrow graph on black background symbolizing representing financial and market loss, market decline, business decrease, economic crisis, and negative growth concept.
00:06
HD
Dynamic candlestick chart depicting volatile stock market trends and analysis
00:08
HD
Financial Data Analysis on Digital Tablet with Colorful Graphs and Bokeh Lights in Background
00:10
HD
glowing neon Percentage growth and decline icon with up and down arrows. financial, business, and statistical analysis. Up and down percentage arrows icon. Perfect for reports and dashboards.
00:10
HD
graph down.graph up and down animation with Canadian flag background. Stock Market Concept Moving Animation.
00:11
HD
A man is made of leaves and branches walking forward. ESG Environmental, social, and governance, carbon reduction decarbonization net zero and climate change
00:10
HD
Four point one percent number. Digits of colorful shiny marbles, isolated on white background
00:10
HD
A professional businessman dressed in a suit stands confidently in a modern office, with holographic graphs and charts illustrating innovative cost reduction strategies. Qubit
00:12
HD
Cost reduction strategy with futuristic digital interface
00:08
HD
A rising chart, golden columns, and pen resting on financial data. Depicts analysis of market sales, transaction information, and investment strategies
00:10
HD
Diamond Shape Film Matte Overlay increasing and decreasing size Animation. Rhombus element Film Frame. Geometric rhomb design symbol border. 4K Seamless loop.
00:10
HD
Animated graph appearing on screen. Blue graph displaying rapidly increasing share prices on the stock market. Business and finance themed animation.
00:10
HD
A microfinance office word sign displayed on a commercial building under a clear blue sky, symbolizing financial inclusion, small loans, and economic empowerment
00:20
HD
Falling Chart with Arrow Animation, Animated Financial Crisis Chart with Trend Line Graph, Down business graph icon animation on black background.footage of Graph showing fluctuate downward trend.4k
00:10
HD
Nature's beauty illustrated by a sea of clouds above a large forest, underlining the importance of carbon capturing and storage. Carbon reduction
00:06
HD
graph with arrow indicating upward rise. Business growth concept in graph chart showing marketing sales profit increasing to future target.
00:10
HD
Zoom in and out animation the boxer girl symbol. Large black symbol in the center and four small symbols around. Seamless looped 4k animation on white background
00:12
HD
Market Volatility: A red line representing financial fluctuations dramatically charts the ups and downs, with grid lines hinting at market analysis and data trends.
00:10
HD
Quality and cost control concept on transparent background. Successful organization strategy and management quality control. Percentage icon of quality with up arrow and cost with down arrow.
00:10
HD
Glowing yellow and orange fractal star pattern, in full loop
00:15
HD
interest rates and inflation texts and graphs showing rates going up and consumer spending going down
00:15
HD
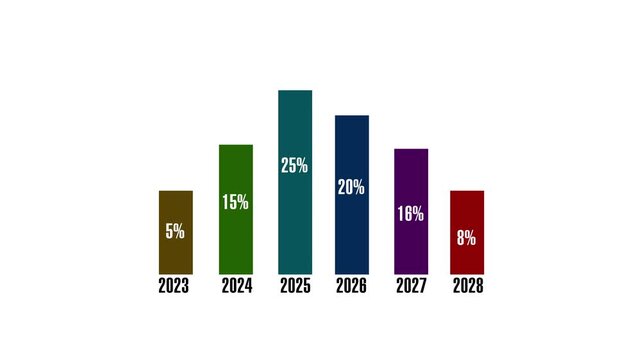
Annual bar chart animation tracks multi year percentage growth data. Corporate financial progress metrics update the bar chart. Long term investment success drives this bar chart.
00:06
HD
Hand change wooden block of Dow Jones Index text to UP and Down arrow symbol icon. stock market index, trade, trade company in the United States, financial growth and Cut loss concept
00:09
HD
Annual tax reduction planning concept. Person typing on keyboard with calculator, tax form deduction and financial savings icons, smart corporate and personal income tax strategy.
00:10
HD
Carbon Footprint Reduction and Net Zero Emissions Target Infographic Animation
00:15
HD
Chart and graph moving up and down, stock market and exchange data. Trading, business, market research, investment, finanical data and information. 3D illustration
00:23
HD
Cost reduction and cost saving through digital transformation, business cost optimization, operational cost reduction, financial saving, and resource efficiency 4k video animation.
00:10
HD
Net zero goals and CO2 reduction strategy driving sustainability, green energy integration, net zero emissions policies, and climate-friendly sustainability solutions for business and society. Muxer
00:20
HD
Neon dollar Business Graph Chart Icon Animation. Abstract neon line dollar business graph animation. Money, profit, investment, growth business, economy, finance
00:10
HD
Green energy concept help reduce global warming.Carbon dioxide emission in industry zero carbon concept. 4K loop
00:08
HD
Growth medium, text, word level concept. 4K video. on transparent background.
00:10
HD
Selenium level indicator scale. Low normal & high meter infographic animation on black background. Showing high selenium level color gauge indicator for nutrition and antioxidant health monitoring.
00:10
HD
Business efficiency concept, business shows how much a company or organization can produce as it relates to time, cost and quality with on background
00:10
HD
Woman Inspecting With Magnifying Glass With Plus Minus Graphic Black Shirt and Neutral Background
00:08
HD
Neon bar graph animation showing business financial market fluctuations and economic trends
00:08
HD
Abstract 3D number 1907 text animation floating against a deep black void offering a vibrant and modern visual for the year with a sense of digital energy. 4k motion video.
00:10
HD
Zoom in and out animation the lotus symbol. Large black symbol in the center and four small symbols around. Seamless looped 4k animation on white background
00:12
HD
Analysis of financial data to improve business efficiency
00:14
HD
Greenland Country Flag and Bar Chart Graph Showing Decreasing Values a Red Arrow Economic Crisis Concept
00:11
HD