ระบบได้ส่งลิงก์สำหรับตั้งรหัสผ่านของคุณไปที่: ต่อไปนี้คุณจะต้องใช้รหัสผ่านในการเข้าถึงสินค้าที่คุณได้ซื้อ
รับภาพประกอบ 25 ภาพหรือวิดีโอ 3 รายการเมื่อทดลองใช้ฟรี
เพิ่มตัวกรองใหม่แล้ว
เรียงลำดับตาม

19,767 ผลลัพธ์สำหรับ increase and decrease ใน วิดีโอ

Financial bank graph with down arrow and dollar sign with up arrow suitable for finance concepts, economic downturn, stock market analysis.
00:06
HD
Moving digital Business Growth Financial Trading Chart and Stock Market Data Animation looping Seamless Motion Background. Business stock data concept
00:25
HD
Visual representation of cost analysis with a declining graph on a laptop screen, emphasizing financial trends and data visualization in a modern business environment. Salient
00:12
HD
Digital Volume Control Animation Increasing and Decreasing, Isolated on Green Screen
00:10
HD
Animated progress bar: cyan percentage counter on black background, animation loading
00:10
HD
Phosphate Solubilization Word Cloud
00:09
HD
Animated down graph icon designed in flat icon style. Finance, Business Info graphic animation, Bar down graph Animated down graph icon, business or finance, down graph bar,4k video
00:10
HD
Animated vertical volume control slider on dark background
00:07
HD
Animated speedometer gauge measuring oil and gas prices surges to maximum red zone creating global inflation and economic crisis, then quickly drops down indicating market stabilization.
00:40
HD
Arrow up business graph icon animation. Increasing business growth chart animation. Going up business graph concept.
00:07
HD
Business growth concept in graph chart showing marketing sales profit increasing to future target . growing business concept.
00:10
HD
Animated Downward Financial Trend Chart Green Screen
00:10
HD
Animated Financial Bar Chart Analytics Display Green Screen
00:10
HD
Glowing Corporate Performance Growth Animation with Modern Business Statistics
00:09
HD
Money growth and decline icons with arrows indicating financial trends
00:06
HD
Abstract animation on tree leaves icon symbol CO2 icon.
00:10
HD
Business growth concept in graph chart showing marketing sales profit increasing to future target . growing business concept.
00:06
HD
Business graph chart with growing business concept. cyan colors Abstract decreasing business graph chart animation business chart, icon, decreasing graph, motion graphic animation..
00:10
HD
Businessman moves a wooden block with the symbol CBAM Carbon Border Adjustment Mechanism. A business environmental concept. The EU border carbon tax for imported goods. copy space
00:22
HD
Sustainable renewable energy illustration showing the motion and functional process of a modern industrial biogas plant
00:10
HD
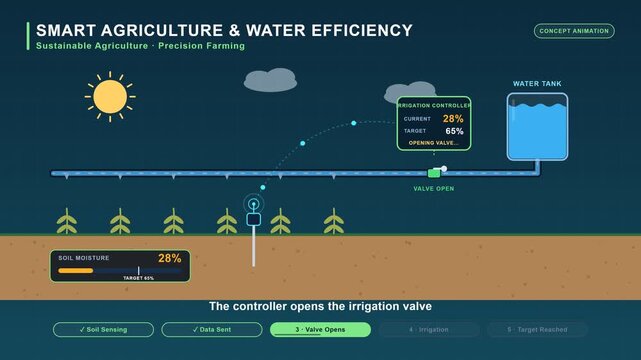
Conceptual illustration of a smart irrigation system for precision agriculture and sustainable water management in modern farming
00:10
HD
Glowing blue business bar chart with downward arrow and declining line curve. Symbolizing revenue drop, financial loss, negative growth, market downturn 4K
00:07
HD
A robotic hand showcases dynamic data visualizations related to cost reduction and financial strategies, set in a sleek, modern business environment. Auvana
00:11
HD
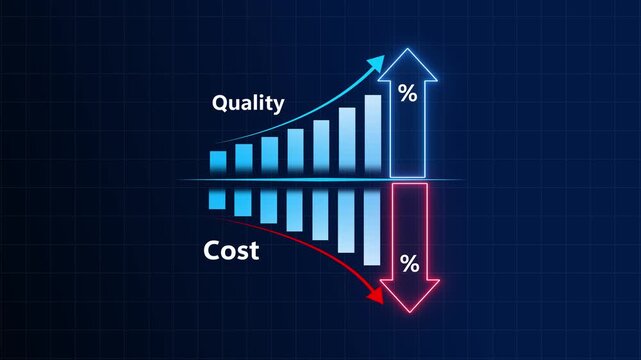
Neon 3d Arrow Animation Displaying Quality One Hundred Percent Increase And Cost Decrease With Floating Particles Transparent Alpha Channel For Business Infographics Loop Motion Graphics
00:12
HD
digital financial decline animation: red downward trend arrow over a negative growth bar graph, visualizing bankruptcy and economic downturn.
00:10
HD
Virtual Try-On Word Cloud
00:11
HD
A glowing teal-to-green neon icon featuring side-by-side vertical elements resembling a directional or up-and-down arrow symbol against a dark background.
00:10
HD
Bar Chart Decline Animation
00:06
HD
Animated bar graph chart data visualization business finance financial report growth marketing technology. Animated bar graph chart business finance data visualization abstract background.
00:05
HD
Glowing red cost chart animation with a descending arrow, declining prices, financial loss, market trends, and economic changes on a black background, 4K video
00:21
HD
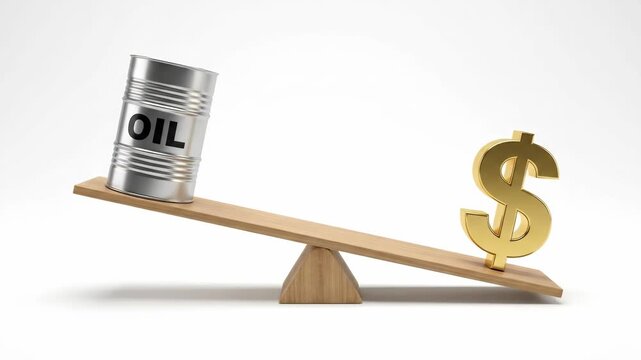
Oil price dollar sign balance scale barrel finance market economic inflation cost weight shift versus golden Inflation crisis global economic recession, risk bankruptcy, struggle, poverty
00:06
HD
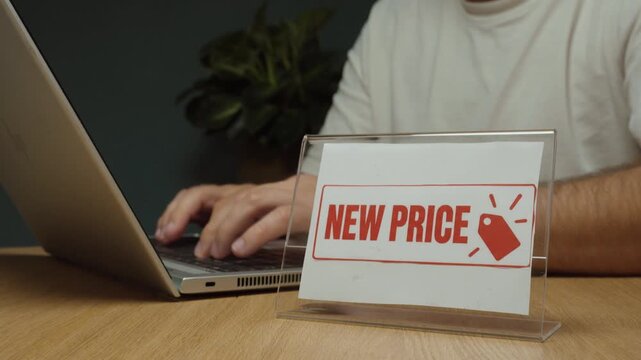
Man works on a laptop and then places a “New Price” sign on the desk, representing price changes, retail pricing, sales and updated costs.
00:17
HD
Performance objectives concept icon highlighting a range of business goals, from agile development and process optimization to achieving quality benchmarks and evaluating outcomes
00:17
HD
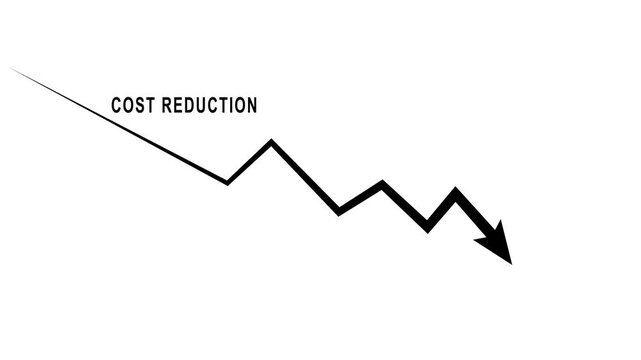
Cost reduction business finance concept. Businessman cost reduction icon with down arrow for budget management and cost management.4k video animation.
00:10
HD
Stock Market Candlestick Price Fluctuation Chart
00:07
HD
Zoom in and out animation the share arrow symbol. Large black symbol in the center and four small symbols around. Seamless looped 4k animation on white background
00:12
HD
Bright white 3D number 2022 text animation floating against a deep black void offering a vibrant and modern visual for the year with a sense of digital energy.
00:10
HD
Improving Quality While Reducing Costs Concept Showing Rising Quality Performance and Declining Operational Expenses for Greater Efficiency, Productivity, Profitability and Business Competitiveness
00:10
HD
Line graphs animation displays fluctuating financial market data on dark. Corporate business revenue performance metrics update on line graphs. Investment drives graphs.
00:06
HD
Framed Volume Slider Animation from Zero to Maximum with Mute Control for Digital Audio Interfaces
00:08
HD
Business Analytics Dashboard Motion Graphic with Growth Statistics
00:10
HD
graph chart up down business statistics
00:07
HD
A robotic hand interacts with digital graphics displaying cost reduction strategies in a modern office setting, illustrating innovation and technology in business processes. Auvana
00:12
HD
Focal length decreases as dry branches frame golden foliage and soft green woodland bokeh.
00:15
HD
Business graph crash down white arrow. Motion graphics of down business arrow with transparent background .
00:10
HD
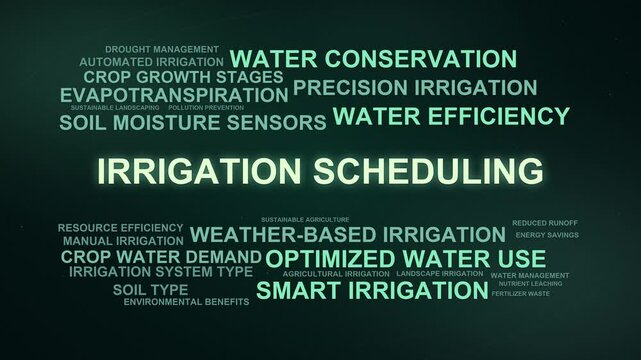
Irrigation Scheduling Word Cloud
00:09
HD
Minimalist Animated Bar Chart Displaying Business Financial Data Growth Concept Isolated on Black
00:08
HD
Red Bar Chart with Downward Arrow Indicating Financial Decline and Business Loss.
00:10
HD
3D Blue Upward Arrows Animation on Black Background, Declining Trend and Business Loss Concept
00:08
HD
Minimalist solid style action to full screen solid icon animation on black background. Increasing and decreasing screen size graphic animation. Zoom icon expand for screen scaling and full screen mode
00:08
HD
Vertical bar graph analytics statistics neon financial metric icon 4k video graphics
00:06
HD
Corporate loss statistic chart animation with down arrow hud screen
00:06
HD
Downtrend Line Chart Animation, Declining Stock Market Graph, Falling Business Performance, Financial Loss, Bear Market, Negative Growth, Revenue Decrease, Economic Downturn Motion Graphic
00:10
HD
Housing market trend motion with city skyline and fluctuating graph. 4k
00:08
HD
Restrictions gauge rises from low to high before falling, presenting changing limits, regulation, pressure, risk, recovery, and improving business conditions with copy space
00:40
HD
Bar chart animation displays declining columns with a downward arrow on dark. Financial market loss reflects on this bar chart. Negative economic data marks chart.
00:07
HD
Dynamic motion of a price drop indicator in financial market analysis video.
00:09
HD
Animated thermometer showing temperature rising from cold to hot on a green screen.
00:10
HD
Blue neon downward bar graph animation with negative growth trend representing financial decrease, analytics performance drop and business risk visualization
00:05
HD
Money increases icon, dollar rate increase arrow up icon .Glowing up arrow black blackground Glowing neon line of dollar sign icon and up arrow isolated on transparent motion animation 4k video...
00:10
HD
Business Analytics Dashboard Motion Graphic with Growth Statistics
00:10
HD
Cost reduction business finance concept. Businessman cost reduction icon with down arrow for budget management and 4k Animation video on Black Background
00:10
HD
A business professional working on a laptop, analyzing cost reduction strategies. The image features digital graphs and finance-related icons, symbolizing effective management. Qubit
00:14
HD
Bar Graph Growth Chart Line Art Vector Icon Featuring Cross Cancel Mark Badge for Financial Business Analytics Failure Data Decline Market Drop Corporate Loss Report and Economic Trend Concept
00:05
HD
Businessman analyzing profit and quality management concepts long term cost planning, product quality, budgeting, financial forecasting, and company revenue and expense projections.4k video
00:10
HD
Revaluation Word Cloud
00:11
HD
Animated declining bar chart data visualization on dark background
00:08
HD
Animated Speaker Icon Showing Volume Levels Increasing and Decreasing.
00:05
HD
Glowing blue bar chart and downward arrow illustrating business decline, financial loss and economic downturn. Concept of recession, falling profits, market crash and negative growth performance

00:10
HD
Bright white 3D number 2005 text animation floating against a deep black void offering a vibrant and modern visual for the year with a sense of digital energy.
00:10
HD
Curved arrow pointing down and to the right with a flowing shape animation
00:06
HD
Pulsating neon pink line graph animation on black background, representing fluctuating financial market trends and data visualization
00:05
HD
graph chart up down business statistics
00:06
HD
Minimal zigzag line falling downward trend or decline animation, Line and upward arrow growth rise and progress
00:06
HD
Declining Financial Market Performance Illustrated by Red Falling Bar Chart, Downward Arrow, and Negative Business Growth Trend
00:10
HD
Red Arrow Graph Indicating Decrease on a Soft Background
00:10
HD
Examining cost reduction strategies and financial efficiency for business growth animation.
00:06
HD
Animated glowing financial bar chart and arrow displaying market drop and stock recovery for video overlay
00:06
HD
Animated dollar sign with 55 percent indicator and green gradient fill on dark background with abstract green lines representing financial growth and data analysis
00:06
HD
Money increases icon, dollar rate increase arrow up icon .Glowing up arrow black blackground Glowing neon line of dollar sign icon and up arrow isolated on transparent motion animation 4k video...
00:10
HD
Financial Growth Graph Animation Featuring Increasing Business Performance Bars
00:07
HD
Water level increase and Decrease. Flood Level, Rain Level White
00:12
HD
Cost reduction and cost saving through digital transformation, business cost optimization, operational cost reduction, financial savings, and resource efficiency strategies for business success. Muxer
00:12
HD
Bar chart animation shows declining columns with an arrow. Business financial losses reflect on bar chart animation. Negative economic performance data marks the bar chart.
00:07
HD
Sustainable growth data visualization: co2 reduction and recycled infographic animation 4k sustainability
00:10
HD
Neon Line Drawing Arrow Animation Showing Quality One Hundred Percent Increase And Cost Decrease With Transparent Alpha Channel For Business Infographics Presentation Loop VFX
00:12
HD
Zoom in and out animation the list symbol. Large black symbol in the center and four small symbols around. Seamless looped 4k animation on white background
00:12
HD
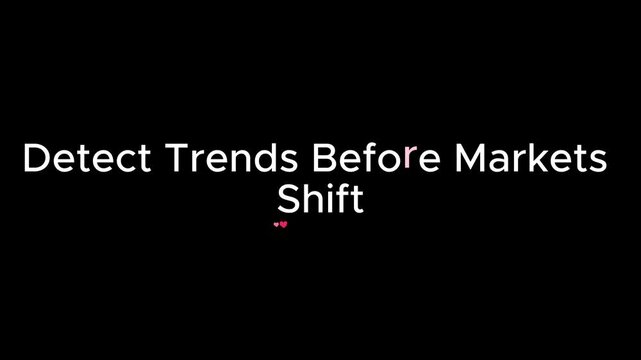
Typography text overlay featuring market trend detection slogan against simple minimal black background suitable for corporate presentations.
00:10
HD
Bar chart animation with up and down. Bar chart financial growth and decline trends. Bar chart business statistics graphic on black background for market analysis.
00:09
HD
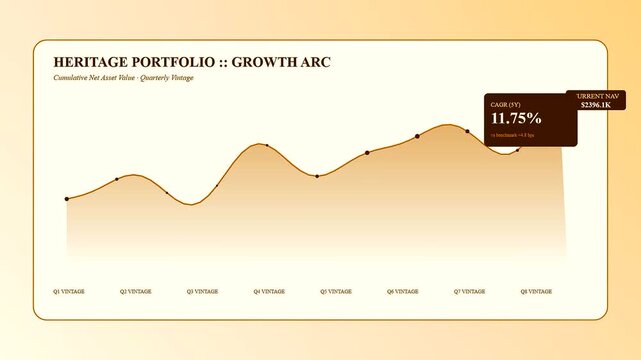
A sophisticated wealth management dashboard visually illustrating the growth arc of a heritage portfolio, detailing cumulative net asset value with quarterly vintage analysis for financial tracking.
00:06
HD
Business graph chart drop circle with down arrow moving animation on black background. Decreasing business graph and down arrow for business loss falling, bad economy recession concepts
00:10
HD
Turquoise up and down arrows animation moves with glowing neon lines. Directional user navigation telemetry routes the arrows animation. Dynamic interface selection moves these up and down arrows.
00:08
HD
Blue Circular Progress Bars Growing With Percentage Indicators In Clean White Background
00:10
HD
graph chart up down business statistics report
00:06
HD
Red stock market arrow down on financial chart displaying, bear crash and investment loss representing, economic crisis recession and business failure
00:20
HD
2026 New year with percentage change to UP and Down arrow with coin stack. Interest rate, GDP, stocks market, financial, deflation and Inflation, mortgage, debt, Loan and Economic Recession
00:12
HD
Twenty percent animation with green neon arrows. Twenty percent digital data visualization. Twenty percent financial growth graphic on black background.
00:07
HD
Negative correlation concept a cause and effect relationship where one element's increase leads to another's decrease. Impacting user ratings. Customer satisfaction
00:17
HD
Abstract increase icon on black background. Dollar rate up looped icon. Reduce costs sign and symbol. motion video 4k quality..
00:06
HD
focus level indicator scale. Low normal & high meter infographic animation. Showing high focus level color gauge indicator. on a white background 4k animation video
00:10
HD