ระบบได้ส่งลิงก์สำหรับตั้งรหัสผ่านของคุณไปที่: ต่อไปนี้คุณจะต้องใช้รหัสผ่านในการเข้าถึงสินค้าที่คุณได้ซื้อ
รับภาพประกอบ 25 ภาพหรือวิดีโอ 3 รายการเมื่อทดลองใช้ฟรี
เพิ่มตัวกรองใหม่แล้ว
เรียงลำดับตาม

19,605 ผลลัพธ์สำหรับ increase and decrease ใน วิดีโอ

Real estate investment abstract business growth and graph chart icon animation background. Business graph chart with growing business concept. percentage symbol symbolizing rising interest rate.
00:10
HD
Cost reduction and cost saving through digital transformation, business cost optimization, operational cost reduction, financial savings, and resource efficiency strategies for business success. Spire
00:20
HD
In the restaurant business, delivery employees are actively implementing barcode scanning technology using laser scanners, which helps minimize losses and increase work efficiency
00:19
HD
Financial stock market numbers. Business success and growth concept. Abstract economy data on screen display. Loop animation.
00:15
HD
isolated motion graph with gold coins on white background
00:08
HD
Neon glowing medical thermometer icon animation. That's indicates weather temperature 35 degree increase or decline. Thermometer equipment showing hot or cold weather.
00:10
HD
Screen price developments on crypto market. Red and green numbers show price increases and decreases. Stock Market Monitor.
00:06
HD
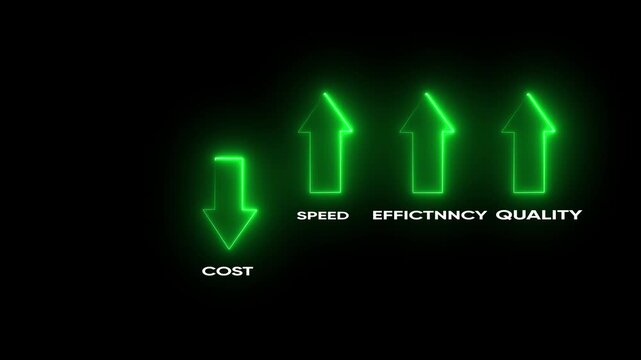
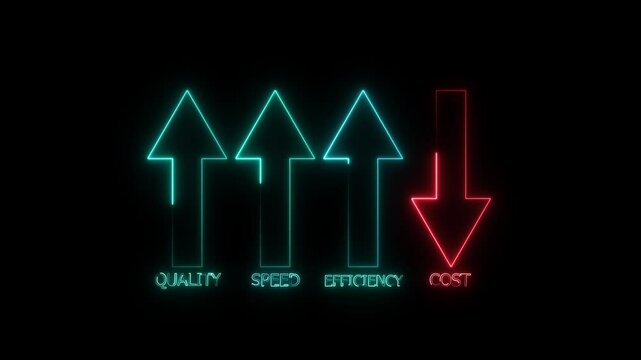
Green neon arrows illustrating business efficiency concept with increasing speed efficiency and decreasing cost
00:10
HD
discount icon
00:06
HD
4k Footage of a sad and desperate forex trader because she loses a lot of money.
00:08
HD
3d rendering of a financial exchange Board with blue numbers. Stock market background. 4k loop animation
00:30
HD
Businessman holding circular economy icon Circular economy concept for future business growth and environmental sustainability and reduce pollution for future business and environmentaL.4K VIDEO
00:15
HD
neon bitcoin with arrows up and down icon. bitcoin price increase and decrease. bitcoin rate up and down. creating a dynamic representation of Cryptocurrency Market fluctuations or profit and loss.
00:10
HD
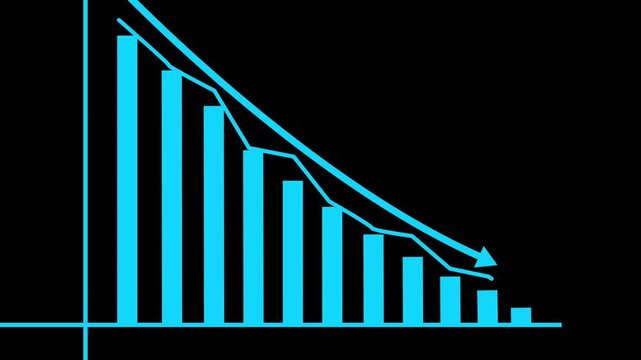
Cyan Bar Graph with Declining Bars on Black Background chart data. Minimal cyan chart showing downward trend on dark background, clean analytics interface for data.
00:06
HD
Close up orange candle stick chart and blue line chart with market data. Investment, finanical data, trading information and business. 3D animation
00:20
HD

Bar chart animation showing changing data values, representing business analytics, statistics, performance comparison, financial reporting, growth and market trends.
00:06
HD
3D animation MLM networking growing rapidly and quit from the business until entire network gone bankrupt (fast version)
00:16
HD
Circular economy concept for future business growth and environmental sustainability and reduce pollution for future business and environmental growth.Globe Glass with Net zero icons In Green Forest.4
00:15
HD
Mood Speedometer Sentiment Rising Good Feeling 3d Animation
00:09
HD
Business Growth and Success Concept. Business growth graph with dollar icon, Financial dollar growth icon. Financial business dollar progress. Business growth infographic animation.
00:10
HD
Real estate investment abstract business growth and graph chart icon animation background. Business graph chart with growing business concept. percentage symbol symbolizing rising interest rate.
00:10
HD
A dynamic business meeting showcasing teamwork and analysis focused on sustainable practices and carbon neutrality in a modern office setting. Raster
00:12
HD
Rising arrow transparent channel. arrow rising transparent channel, business growth arrow and graph chart, Business line arrow and grid line background.
00:06
HD
Percentage sign on black background for financial data representation. Percentage sign shows financial numbers. This percentage sign makes a somber, memorial statement.
00:05
HD
Girl works at the computer in a homely atmosphere and watches graphics. Stocks increase and decrease.
00:19
HD
Neon glowing medical thermometer icon animation. That's indicates weather temperature 68 degree increase or decline. Thermometer equipment showing hot or cold weather.
00:10
HD
Gold coins falling into a pile
00:12
HD
Red stock market tickers going up to green, with digital animation of the board of the evolution of stock market prices. Financial chart of stock exchange data - 4K animation
00:15
HD
Cyan bar chart animation displays fluctuating market trend lines. Trading volatility analytics track on this cyan bar chart. Corporate economic investment revenue drives the bar chart.
00:10
HD
Infographic, Chart Vertical Bars Moving Up and Down in Modern Minimal 3D Style with Soft Shadows Animation - 4K Seamless Loop Video Horizontal
00:08
HD
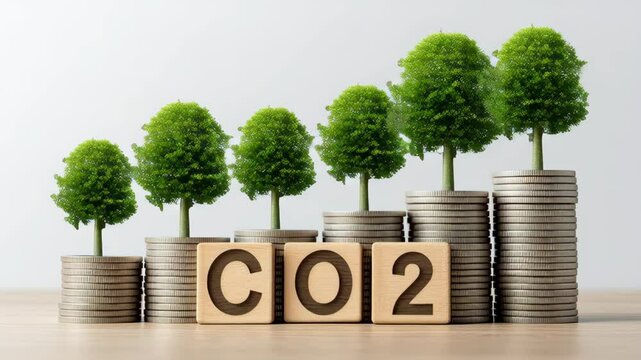
Business carbon credit. CO2 reduction and growth with wooden blocks and trees on stacked coins symbolizing environment, finance, sustainability, and green development
00:05
HD
Digital Screen Percent Arrows Lock Warning Icons Technology Interface Display
00:10
HD
With a solid business and technology background, the team accurately analyzes electronic market trends, aiming to achieve a double-digit growth figure as their target.
00:06
HD
Silver coins on stacks are decrease on white background stop motion animation
00:10
HD
Business monitor, financial report with charts and numbers. Financial figures, charts, graphs, lines, diagrams. Sales, earnings, statistics and revenues. 3D animation
00:30
HD
Financial trading graph with candlestick chart on dark red digital background ,downtrend dollar price decrease investment background animation portrait
00:10
HD
Economic recession downward graph with red arrow isolated on white background animation
00:10
HD
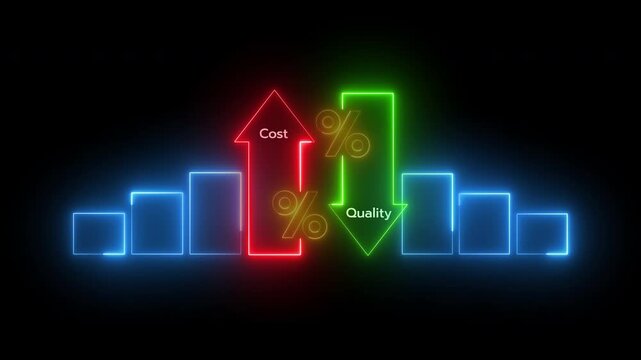
An animated neon diagram showing a business trade-off. "Cost" is linked to a red upward arrow, and "Quality" is linked to a green downward arrow.
00:12
HD
Neon line icon decrease business investment moving. Graph with arrow down. Alpha Channel.
00:10
HD
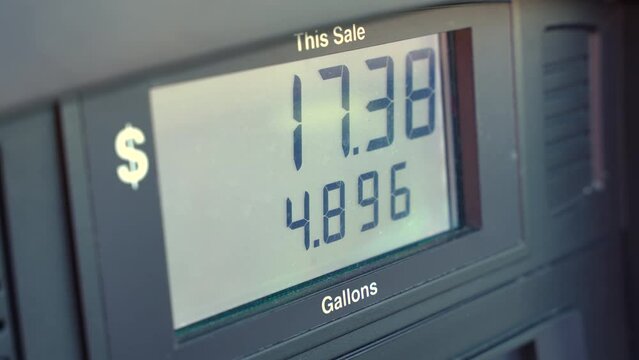
Fuel pump screen showing rising price of gasoline at gas station
00:24
HD
infographic red bar graph with different values, loop
00:30
HD
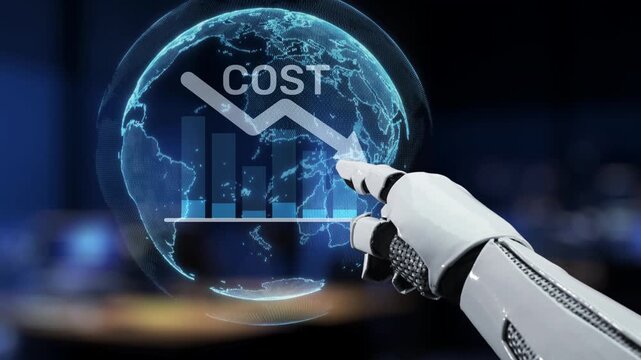
A robotic hand points at a graphic indicating cost reduction alongside financial data visualization, symbolizing advanced technology in modern business and analytics. Synapse
00:13
HD
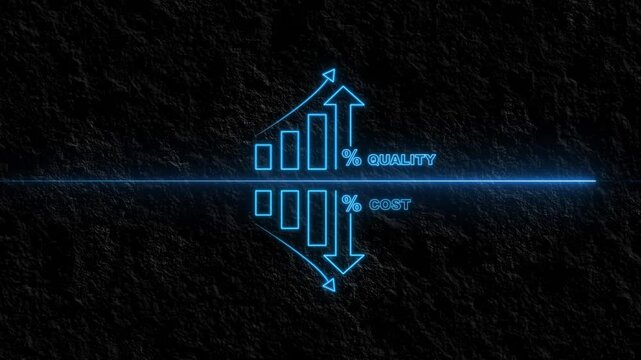
AI powered business optimization, Cost reduction and Quality control, Artificial Intelligence driven automation optimizes workflows, Improves quality, ai graph cost and quality. glowing animation
00:10
HD
Up and down arrow graph animation. Green growth and red decline arrows showing market trend on black background
00:05
HD
Circular economy concept for future business growth and environmental sustainability and reduce pollution.Net zero and carbon neutral concept.Concept day earth Save the world save environment.
00:15
HD
Neon glowing medical thermometer icon animation. That's indicates weather temperature 29  degree increase or decline. Thermometer equipment showing hot or cold weather.
00:10
HD
A sign saying Save Now stands in a busy shopping mall. Shoppers walk past various stores. The promotions aim to attract customers and increase sales during the season
00:10
HD
The text "GDP" and a chart showing increase or decrease. Gross domestic product concept. An index indicating inflation and economic growth.
00:05
HD
Modern bar chart tracks positive corporate growth trends. Commercial bar chart displays rising stock market analytics data. Financial success with digital bar chart.
00:12
HD
Woman Receiving Vacuum Cupping Device, Butt Skin Lifting Therapy Pump Lifting Enhancer Cup Machine Massager, Beauty Tool, Salon SPA, Hip Shaping. Wellness Body, Skin Care, Treatment, Rejuvenation
00:09
HD
A pattern of red hearts is depicted on a transparent background, which rotate around their axis, increase and decrease, imitating a heartbeat and fall down.
00:06
HD
Co2 reduction concept ,Vibrant Green Plant Growth in Glass Jar with Soil, Embracing Nature and Sunlight in Bright Indoor Setting
00:05
HD
A timelapse showing the gradual decrease in synapses as a brain matures.
00:08
HD
Zoom in and out animation the zoom out symbol. Large black symbol in the center and four small symbols around. Seamless looped 4k animation on white background
00:12
HD
Hand drawing business diagram concept about increasing efficiency, quality and speed but decreasing cost arrow. Performance concept of increase quality, speed, efficiency and reduce cost.
00:10
HD
Animated Line Graph: Growth and Decline Visualizations
00:08
HD
Business growth graph with dollar icon, progress, Sales Chart, decrease , economics.
00:08
HD
Business efficiency concept, how much a company or organization can produce as it relates to time, cost and quality. Glowing neon line of efficiency icon isolated on transparent background.
00:15
HD
Businessmen lead by a businesswoman, hd Alpha Channel
00:30
HD
White bar chart animation shows a declining financial loss trend line. Negative economic market performance marks the bar chart. Downward business trade tracks across the bar chart.
00:06
HD
Business graph chart with growing business concept. Abstract decreasing business graph chart animation background. business or finance concept icon animation. 4k video
00:10
HD
A businessman holds a digital tablet showcasing glowing arrows indicating increased quality and reduced cost, representing effective strategies for business improvement. Qubit
00:12
HD
Tech grid overlay appearing over city dusk starting animated bar chart pie chart growth decline
00:12
HD
Graph and numbers in stock market. Business Success and growth concept. Monochrome. Abstract financial chart on screen display. Loop animation.
00:15
HD
Canadian flag on a digital screen with stock market charts, representing the global environment for Canada's financial landscape.
00:10
HD
Neon glowing medical thermometer icon animation. That's indicates weather temperature 40 degree increase or decline. Thermometer equipment showing hot or cold weather.
00:10
HD
Real estate investment abstract business growth and graph chart icon animation background. Business graph chart with growing business concept. percentage symbol symbolizing rising interest rate.
00:10
HD
Green energy zero emission carbon co2 reduction graph charts,business virtual touch screen to show alternative energy growth.Net zero 2050.Corporate 4k video
00:12
HD
Digital trend line chart tracks positive corporate growth paths. Technical trend line chart monitors stock market trading performance. Business data analytics with a trend line chart.
00:08
HD
Business growth concept in graph chart showing marketing sales profit increasing to future target . growing business concept. Clean Hi-tech style technology chart
00:10
HD
Digital financial stock market line graph showing growth and decline trends
00:07
HD
Housing price falling down
00:06
HD
Business graph chart arrow line down white color animation on black background. growth concept white moving.
00:15
HD
Abstract 3D Bar Chart on White Background.
00:05
HD
Business Professional Analyzing Financial Stock Market Data on Laptop with Growth Charts and Coins
00:05
HD
Falling Chart with Arrow Animation, Animated Financial Crisis Chart with Trend Line Graph, Down business graph icon animation on black background.footage of Graph showing fluctuate downward trend.4k
00:10
HD
Smooth motion graphics of economic loss and decrease for data visualization and business use. Animated bar graph chart decline recession financial market stock business economy loop.
00:06
HD
Springtime smart farm showcases natures beauty and cuttingedge agricultural technology. Concept Springtime, Smart Farm, Nature's Beauty, Agricultural Technology, Farming Innovation
00:04
HD
digital, economy, finance, management  graphic Arrow growth down animation.
00:10
HD
Quality control growth graph ,Successful organization strategy and management ,
00:10
HD
Economic crisis with Stock market tickers collapsing, with digital animation of the evolution of stock market prices. Financial chart of stock exchange data - 4K animation
00:15
HD
Cost reduction and cost saving through digital transformation, business cost optimization, operational cost reduction, financial savings, and resource efficiency strategies for business success. Spire
00:20
HD
Circular economy concept for future business growth and environmental sustainability and reduce pollution for future business and environmental growth.4k Net zero emission concept 2050..Place for logo
00:15
HD
Animated Weekly Data Chart: Visualizing Business Trends with Dynamic Bar Graph
00:05
HD
Dynamic Monochrome Visualization of Market Dynamics: Animated Graphs Depicting Financial Growth and Decline in Stark Black and White Contrasts
00:16
HD
business finance concept on black background . Businessman icon with up arrow for budget management.
00:10
HD
Zoom in and out animation the semicircle symbol. Large black symbol in the center and four small symbols around. Seamless looped 4k animation on white background
00:12
HD
A pattern of white hearts is depicted on a transparent background, which rotate around their axis, increase and decrease, falling down. Animated background for Valentine's Day.
00:06
HD
Learn effective budgeting techniques that can help improve financial health. Discover how to manage expenses and increase savings in easy steps
00:05
HD
Screen showing of Stock market quotes
00:22
HD
arrow rising transparent channel, business growth arrow and graph chart. neon line business graph growth chart animation.
00:10
HD
Minimalist solid style action to full screen solid icon animation on white background. Increasing and decreasing screen size graphic animation. Zoom icon expand for screen scaling and full screen mode
00:08
HD
video showing the impact of CO2 emissions on the environment through a CO2 icon in a green forest
00:09
HD
Stock exchange, chart and lines. Screen with candle stick chart and moving averages. Business and finance, stock market trading and investment research concept.
00:14
HD
Tiles in the form of rounded squares impulsively increase and decrease, as if a mechanism is working.
00:07
HD
abstract purple background increasing and decreasing rectangular tiles 3d render looped animation
00:09
HD
An abstract digital chart with glowing particles and a rising trend line. Financial data, business, technology.
00:10
HD
Animated financial dashboard showing rising inflation rates and CPI data with alert indicators. The video presents increasing cost of living metrics, including categories such as energy, food, and hou
00:14
HD
Green Bar Chart Showing Growth and Decline Over Time.
00:11
HD
Dynamic stock market graph with upward and downward trends visualized on a futuristic dashboard
00:08
HD