ระบบได้ส่งลิงก์สำหรับตั้งรหัสผ่านของคุณไปที่: ต่อไปนี้คุณจะต้องใช้รหัสผ่านในการเข้าถึงสินค้าที่คุณได้ซื้อ
รับภาพประกอบ 25 ภาพหรือวิดีโอ 3 รายการเมื่อทดลองใช้ฟรี
เพิ่มตัวกรองใหม่แล้ว
เรียงลำดับตาม

1,488 ผลลัพธ์สำหรับ deviation ใน วิดีโอ

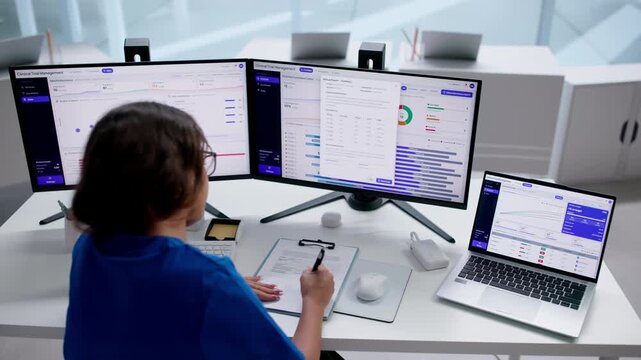
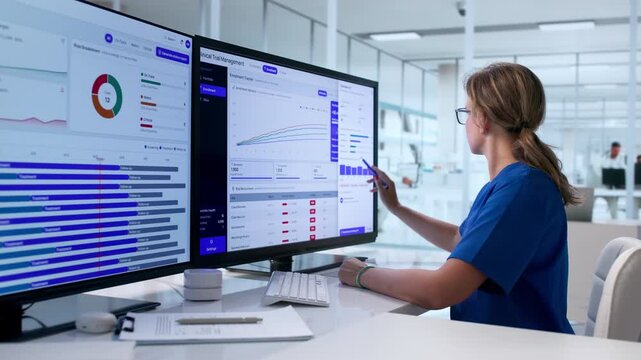
Clinical Trial Manager Analyzing Patient Enrollment Data
00:24
HD
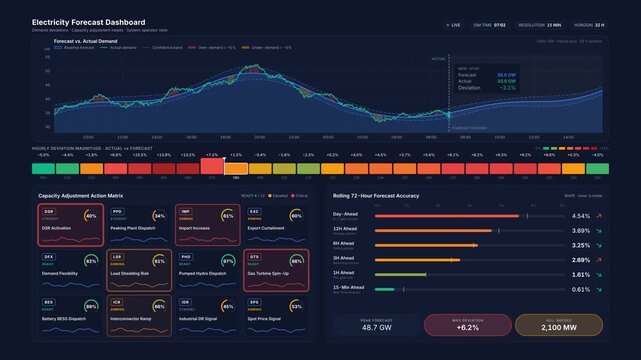
4K Electricity Forecast Dashboard Animation Displaying Demand Deviations, Capacity Adjustment Matrix, and Real-Time Grid Load Data for Energy Management.
00:15
HD
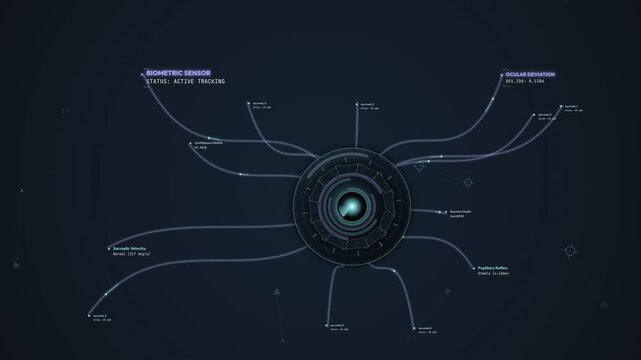
Futuristic biometric sensor interface for an online proctoring system tracking ocular deviation and saccadic velocity to detect attention deviation anomalies during a remote exam
00:59
HD
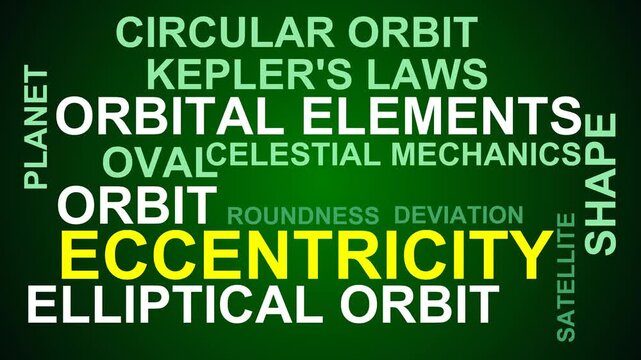
Eccentricity Word Cloud
00:11
HD
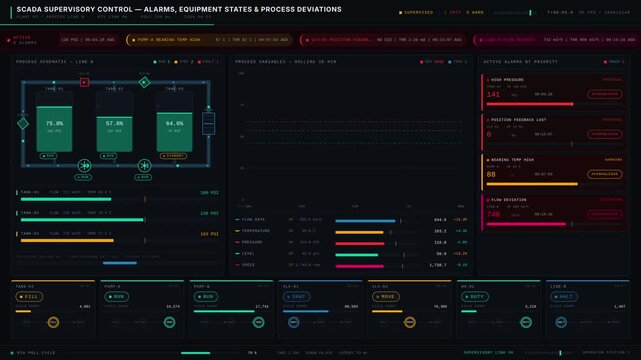
A detailed SCADA dashboard featuring alarms, equipment states, and process deviations in dark mode with colorful indicators and animated charts for monitoring system performance.
00:15
HD
Flexible Workflow Redirect Arrows Motion icon. Animated curved line with two directional arrows representing flexible workflow process change path deviation and dynamic system redirection.
00:10
HD
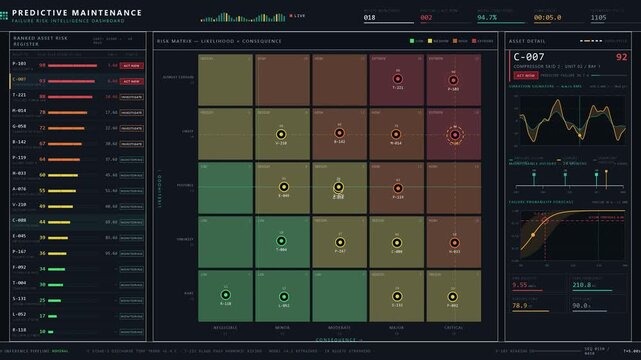
Explore a sophisticated predictive maintenance dashboard with a risk matrix, asset list, and detailed analytics, designed for effective failure risk management in dark mode.
00:15
HD
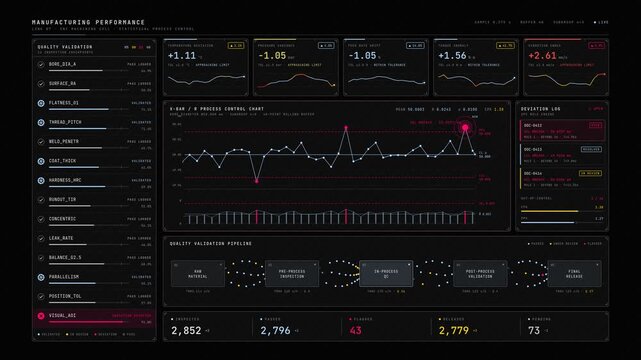
Ultra-premium 4K manufacturing performance dashboard with SPC charts, quality validation status, and deviation alerts on black frosted glass interface.
00:15
HD
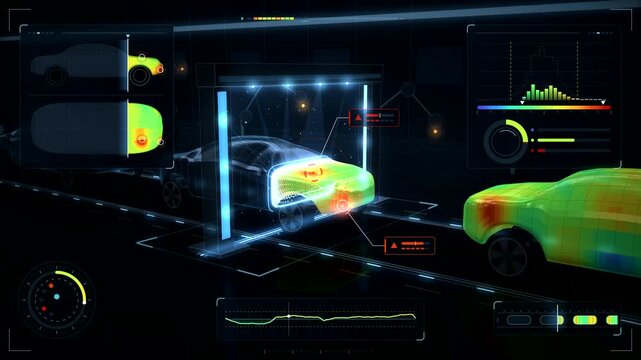
Automotive assembly line gantry sweeping laser lines over a car body and showing a deviation heatmap on a quality control HUD
00:15
HD
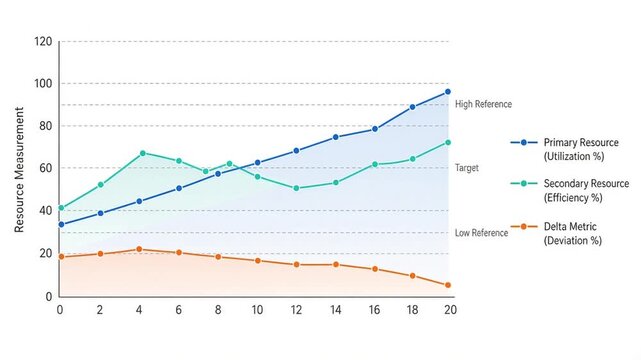
Detailed Line Chart and Multi-Metric Trend Analysis Graph Illustrating Resource Utilization Efficiency and Performance Deviations
00:10
HD
Seamless 4K looping oscilloscope animation: fm deviation changing on screen. Glowing vector signal trace in teal and cyan on a dark graticule screen, with blank readout panels for your own labels. Hor
00:07
HD
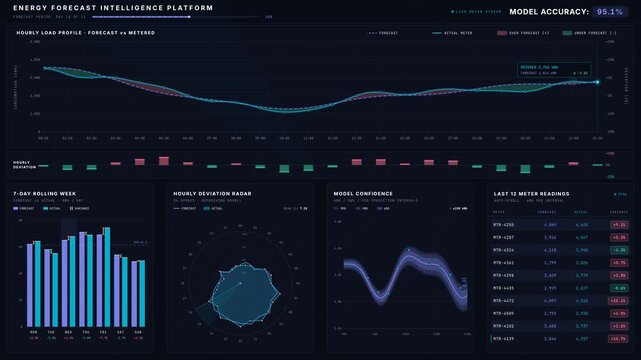
Futuristic 4K energy forecast dashboard animation comparing expected consumption with recorded meter readings. Dark mode interface features dual-line charts, deviation bars, radar polygons.
00:15
HD
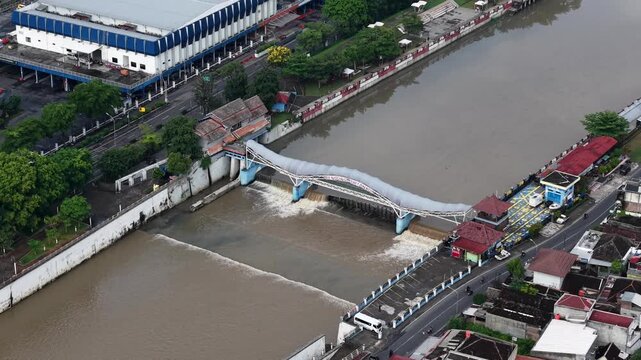
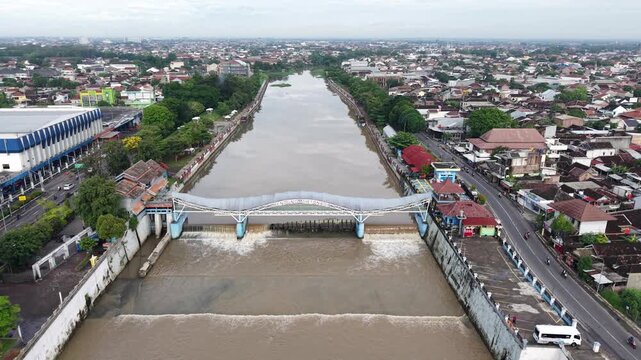
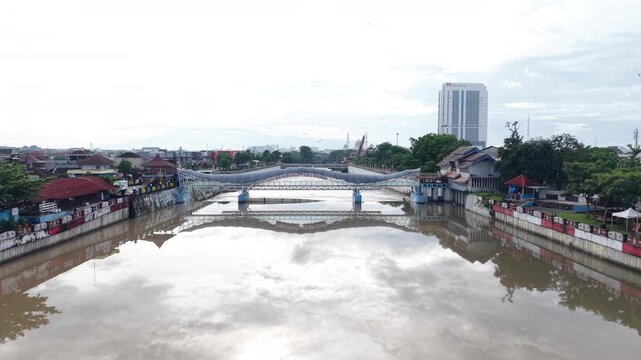
Aerial footage of the Tirtonadi Rubber Dam in Solo, Central Java, Indonesia, functions to regulate water deviation and prevent flooding of the Bewangan Solo River. High quality 4k footage
00:14
HD
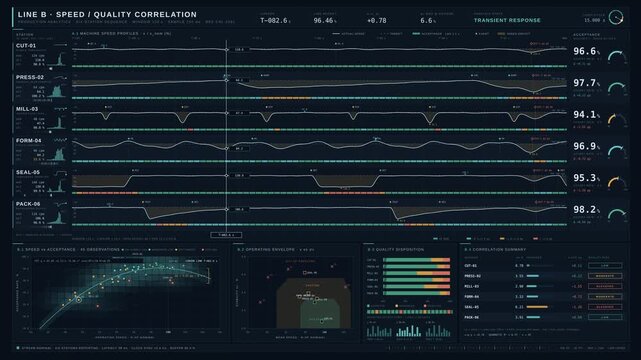
4K production line dashboard comparing machine speeds and quality acceptance rates with waveforms and scatter plots in dark blue interface for commercial creative technology and business use.
00:15
HD
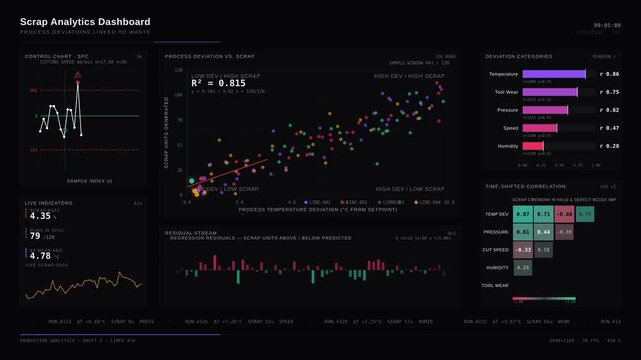
An advanced scrap analytics dashboard visualizing process deviations linked to waste through detailed scatter plots, control charts, and correlation matrices in vibrant colors.
00:15
HD
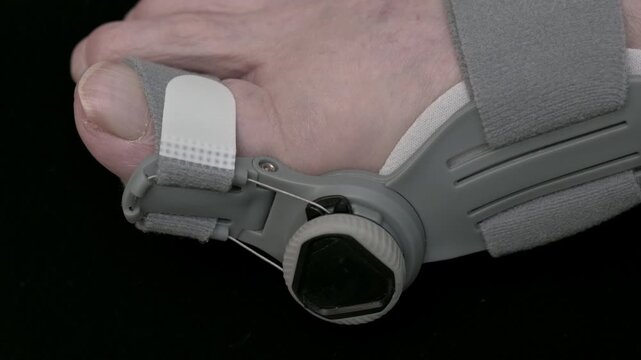
4K macro close-up of a hallux valgus correction brace supporting big toe alignment and foot positioning. Shows an orthopedic device for bunion and Hallux valgus care.
00:18
HD
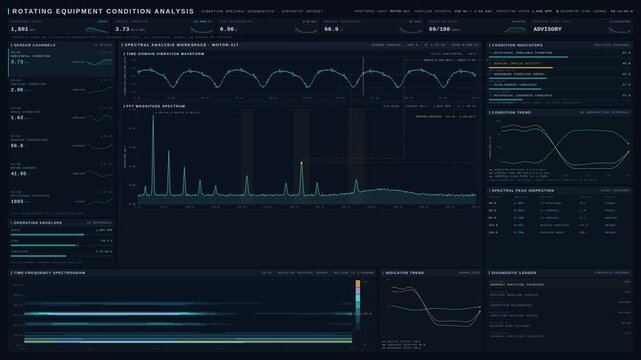
Sophisticated industrial machine condition dashboard featuring spectral analysis, vibration waveforms, FFT frequency domain monitoring, early fault indicators.
00:15
HD
Climate change. Temperature for the years 1896 to 2025 added as climate stripes for the USA colored according to the deviation from the average of 1950 to 1980. Blue colder, red warmer. Global warming
00:36
HD
Vertebrae curve examine: scoliosis condition, spinal curvature, body anatomy, posture improve, human skeleton, medical visualization, health wellness, bone structure.
00:08
HD
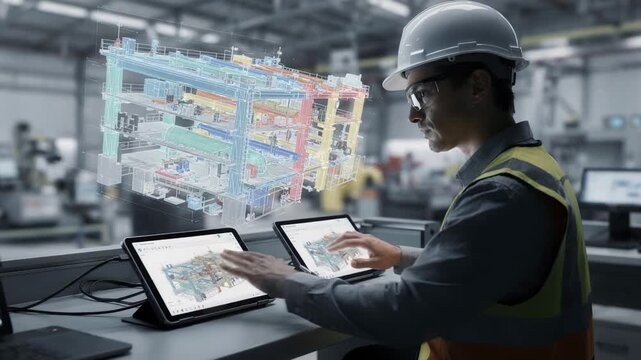
Medium shot showing an engineer reviewing sensor data on tablets connected to a 3D digital twin model to track fabrication progress and detect deviations
00:05
HD
Clinical Trial Manager Monitors Patient Enrollment Using Dashboard
00:20
HD
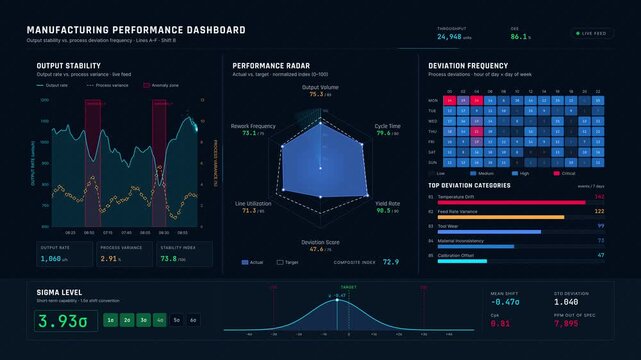
Premium 4K animated manufacturing dashboard displaying output stability charts, radar metrics, and deviation heatmaps on a dark gradient background with teal and blue accents.
00:15
HD
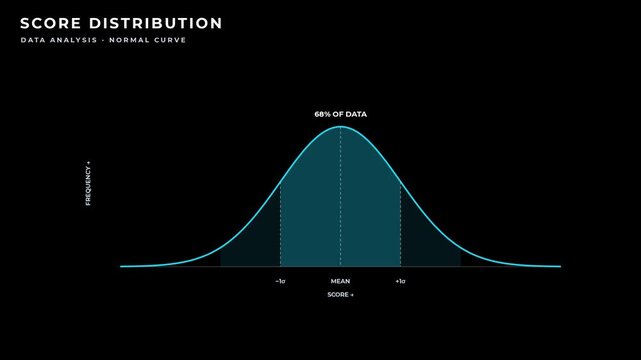
Animated normal distribution bell curve showing score frequency and standard deviation on black background
00:08
HD
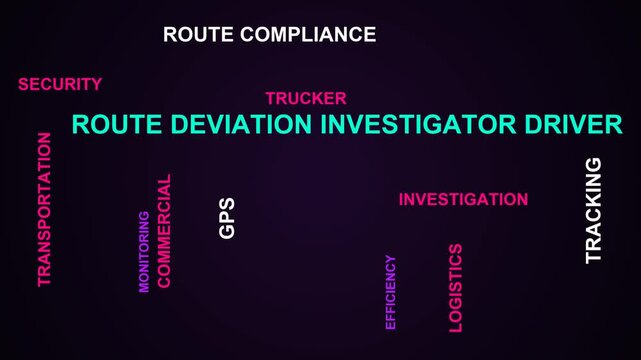
Route Deviation Investigator Driver Word Cloud
00:11
HD
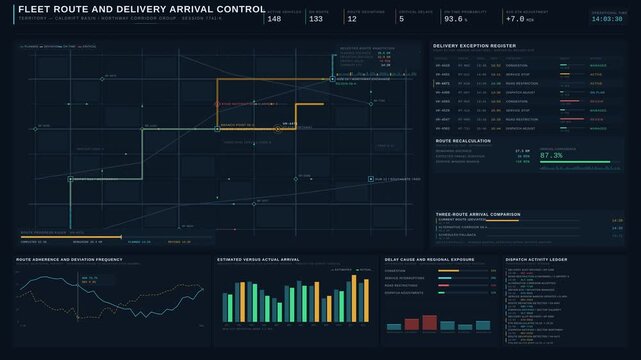
4K enterprise fleet delivery dashboard showing live route deviations, ETA recalculations, and vehicle tracking on a dark logistics map with detailed analytics.
00:15
HD
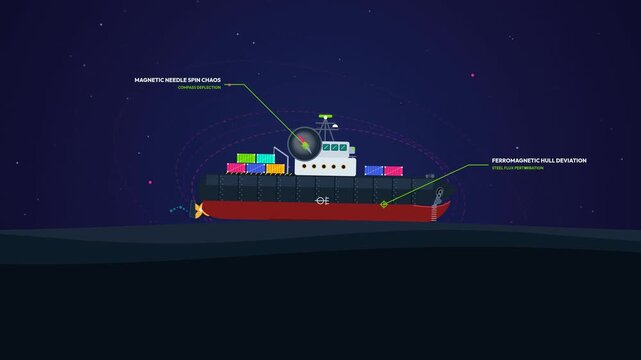
2D animation explaining mechanics of a marine gyrocompass showing magnetic deviation on ships, cardan suspension, brass rotor angular momentum, earth rotation, ballistic precession and true north
00:59
HD
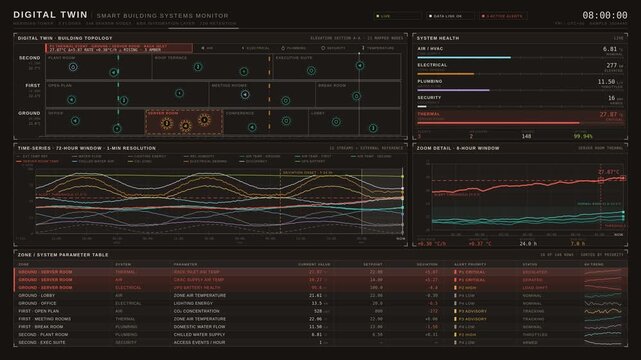
Explore the digital twin dashboard for smart building systems monitoring with detailed architectural schematics and real-time data visualizations for facilities management.
00:15
HD
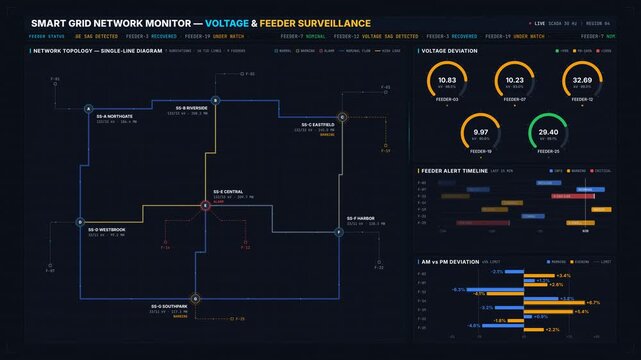
Smart grid monitoring dashboard tracking voltage deviations and feeder alerts with dark mode network topology and telemetry panels for commercial creative technology and business use.
00:15
HD
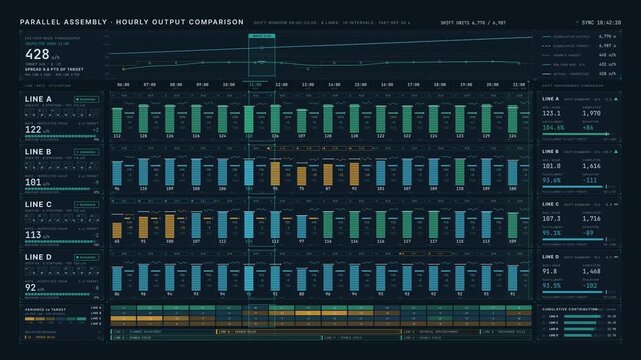
Premium factory production dashboard comparing hourly output across four parallel assembly lines with dark steel-blue industrial analytics interface and teal accents.
00:15
HD
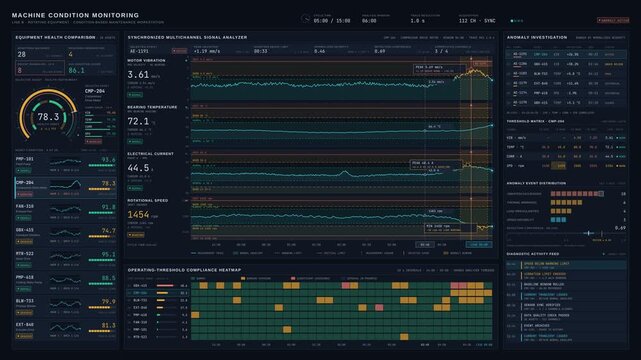
Premium industrial machine health dashboard in 4K showing multivariable sensor traces, operating thresholds, and anomaly detection events with deep navy and cyan accents for predictive maintenance.
00:15
HD
Abstract animated standard deviation bands diverging sigma drawn as violet and blue lines and shapes on a deep dark background. Seamless looping 4K motion graphics video with free space for text, idea
00:07
HD
Sci-fi HUD interface cyan warning screen for POLAR SHIFT DETECTED and freq deviation
00:10
HD
AI Model Monitoring With Drift Detection and Review Routing Animation
00:15
HD
Dark mode energy audit dashboard UI animation showing multi-site consumption anomalies with maps, charts, and live alerts in 4K for commercial creative technology and business use.
00:15
HD
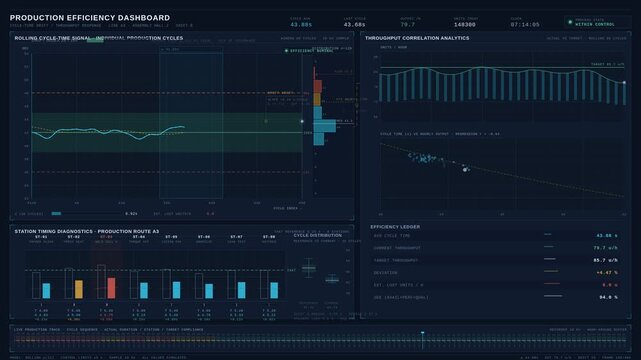
Dark mode industrial dashboard animation monitoring production efficiency, cycle time drift, and throughput changes with detailed signal plots and station diagnostics for manufacturing analytics.
00:15
HD
4K macro rotating view of Hallux valgus, showing big toe deviation and forefoot deformity. Also known as bunion, involving Hallux and Os metatarsale I.
00:11
HD
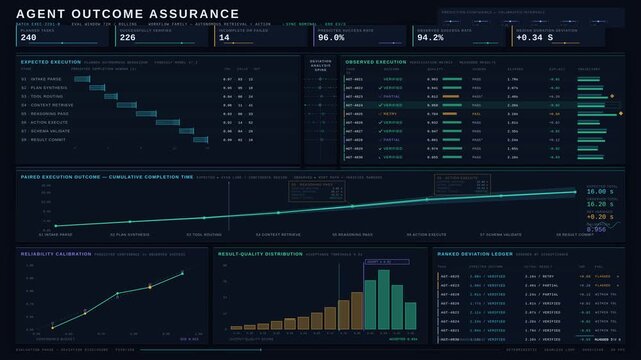
Visualize sophisticated enterprise agent performance dashboard comparing expected outcomes with actual execution results through detailed analytics and rich data visualizations.
00:15
HD
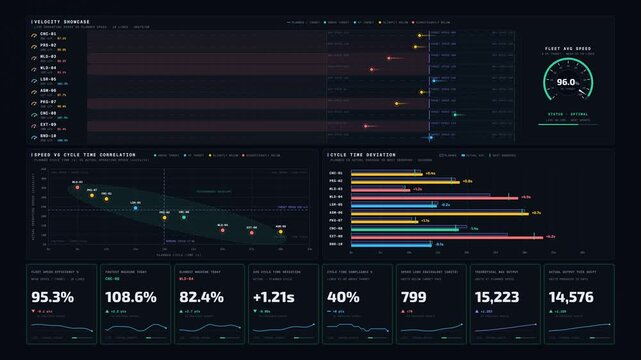
4K manufacturing efficiency dashboard visualizing operating speeds and planned cycle times with animated data visualization for commercial creative technology and business use.
00:15
HD
Business process analyzing performance variance breakdown using data, metrics, and team collaboration for improved management and identifying deviations
00:17
HD
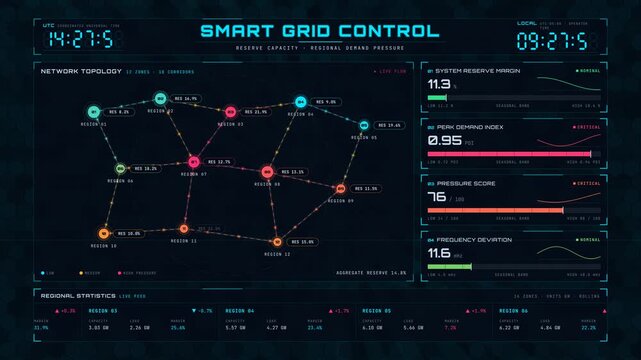
4K animated smart grid dashboard visualizing regional electricity network reserve capacity and demand pressure with glowing nodes and data metrics for commercial creative technology and business use.
00:15
HD
Clinical Trial Manager Reviews Patient Enrollment Data
00:24
HD
Downhole Fiber Optic Gyroscope Borehole Survey Tool Cutaway for Scientific Research Laboratory and Advanced Machinery Operation
00:05
HD
A white curved arrow pointing upwards to the right on a black background
00:10
HD
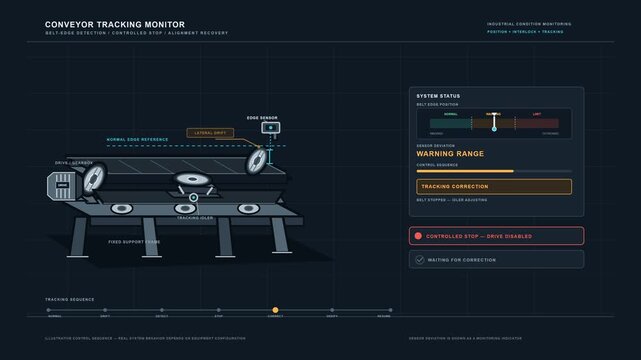
Semi-realistic technical animation showing an industrial conveyor belt drifting out of alignment, a belt-edge sensor detecting the deviation, a controlled conveyor stop, and a tracking mechanism corre
00:08
HD
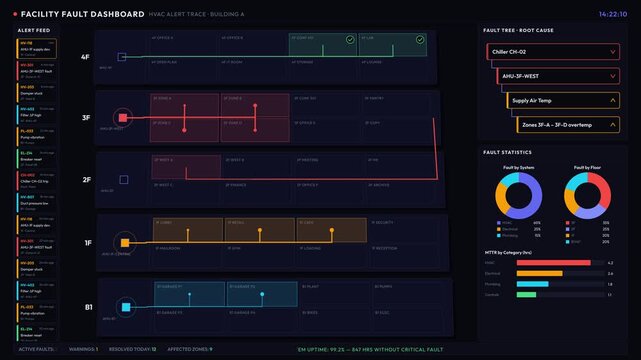
4K animated facility dashboard tracing HVAC alerts to building zones with isometric floor plans, fault trees, and real-time status indicators for industrial monitoring.
00:15
HD
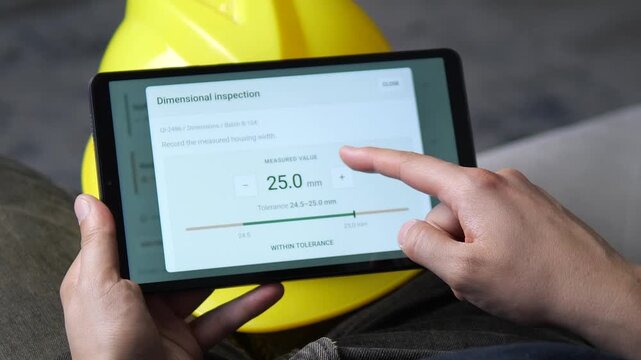
Technician records an out-of-tolerance measurement on a tablet during digital manufacturing inspection, documenting a dimensional defect in a precision component.
00:10
HD
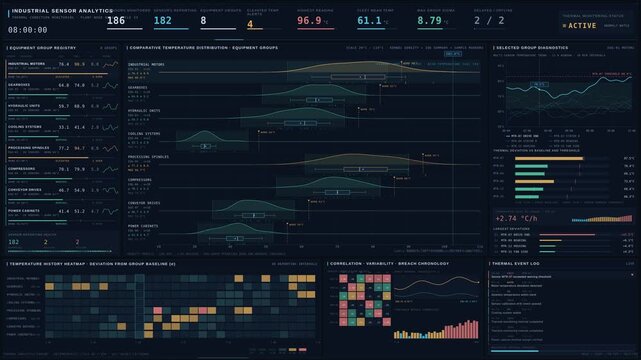
Premium 4K industrial sensor analytics dashboard comparing temperature patterns across equipment groups with detailed thermal telemetry and condition monitoring visualizations.
00:15
HD
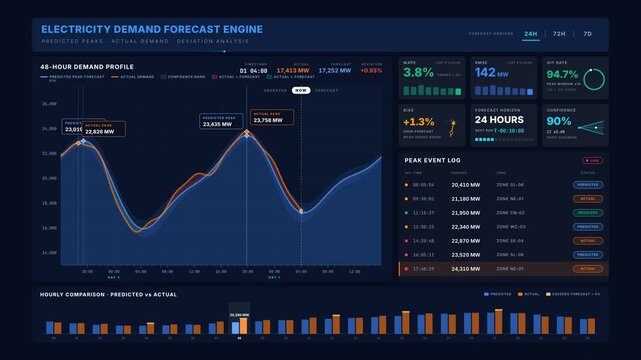
Cinematic 4K electricity forecast dashboard comparing predicted peaks and actual demand events with dual-line charts, KPI metrics, and live data logs on a dark background.
00:15
HD
Clean 4K textless data science growth graph animation featuring dynamic regression curve, scatter data points with confidence deviation lines, progressive clip-path suspense reveal, glowing circle mar
00:12
HD
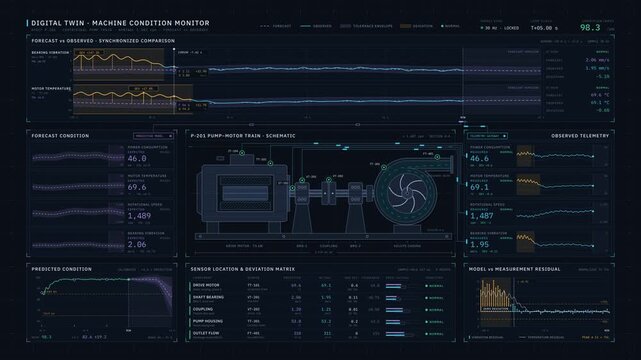
UHD industrial digital twin dashboard comparing forecast conditions and actual telemetry with vector machine schematic for commercial creative technology and business use.
00:15
HD
Animated anomaly baseline deviation concept in a modern dark mode style, crossing corridor in a smooth 4K seamless loop. Neon blue and azure accents, flowing dots and placeholder interface cards on a
00:07
HD
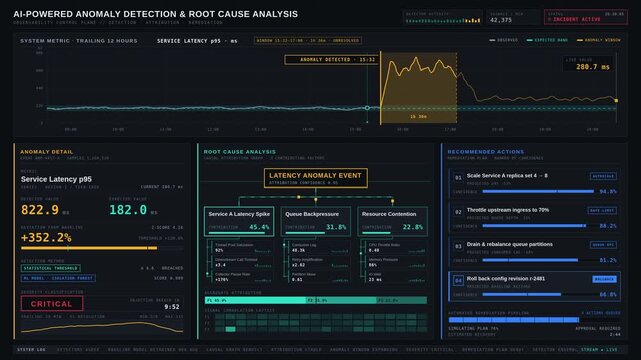
A dark mode monitoring dashboard illustration showcasing AI-powered anomaly detection and root cause analysis with detailed metrics and action recommendations.
00:15
HD
Sci-fi HUD interface cyan warning screen for GLOBAL NAVIGATION ERROR and freq deviation
00:10
HD
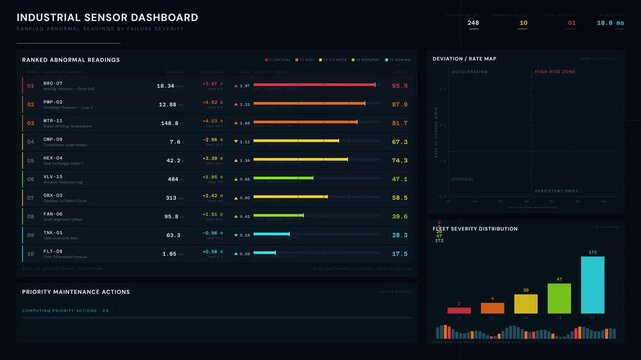
An industrial sensor dashboard displays abnormal readings ranked by failure severity, featuring color-coded severity bars and an animated bubble chart for data visualization.
00:15
HD
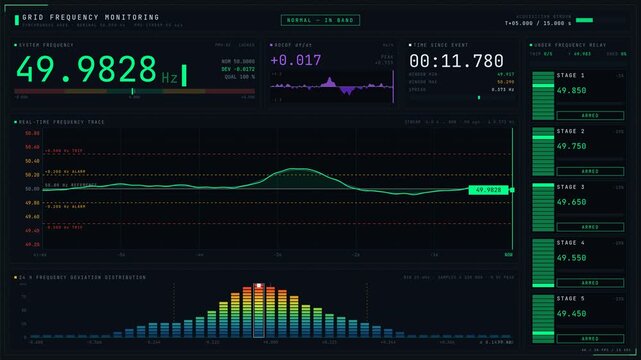
A visually striking 4K grid frequency monitoring dashboard featuring real-time frequency trace charts and dynamic color-coded alerts on a dark obsidian background.
00:15
HD
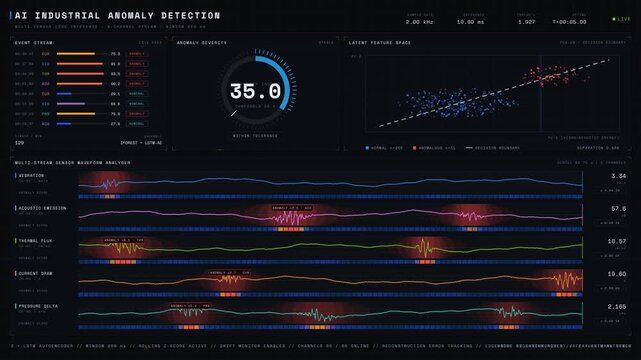
Visualize AI-driven industrial anomaly detection with sleek dark interface and vibrant sensor waveform streams showcasing critical data in a dynamic 4K environment.
00:15
HD
Aerial footage of the Tirtonadi Rubber Dam in Solo, Central Java, Indonesia, functions to regulate water deviation and prevent flooding of the Bewangan Solo River. High quality 4k footage
00:21
HD
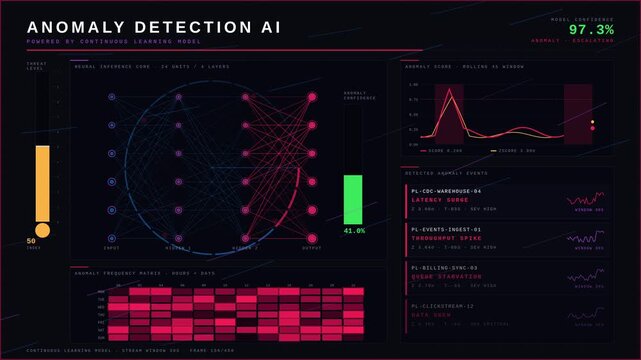
Cinematic 4K AI anomaly detection dashboard with neural network visualization, real-time data pipeline monitoring, and glowing red threat indicators on a dark background.
00:15
HD
A robot vacuum cleans the kitchen floor while the kitchen lights are
00:06
HD
Climate change. Temperature for the years 1896-2025 added as climate stripes for the USA colored according to the deviation from the average of 1950-1980. Blue colder, red warmer. Year dates overlay
00:36
HD
Clinical Trial Manager Reviews Patient Enrollment Data
00:25
HD
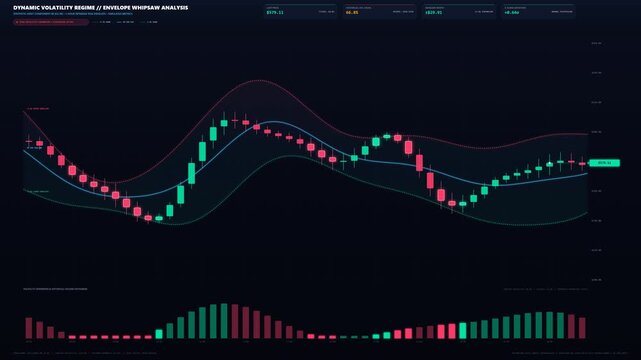
Stock Market High Volatility Price Whipsaw and Volatility Bands Animation in 4K UHD 60FPS Seamless Loop
00:10
HD
Dynamic Green Streaks and a Singular Red Dot in Abstract Space
00:10
HD
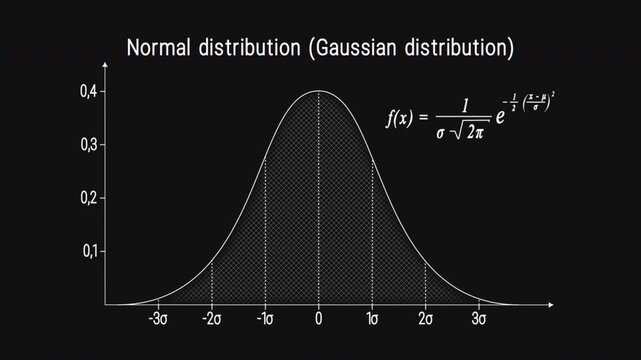
Animations of graphs and formulas for the normal distribution (or Gaussian distribution). Probability theory. Probability density function. Game theory. Mathematical expectation. Standard deviation.
00:21
HD
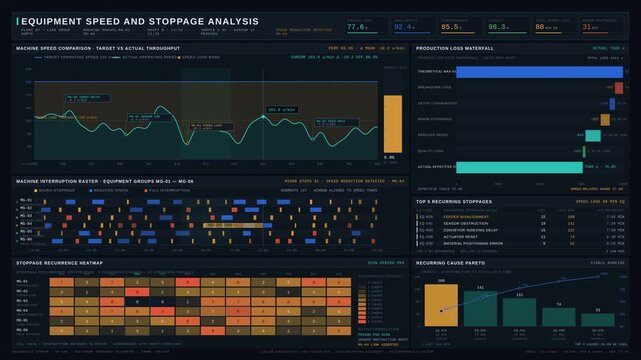
Dark industrial factory OEE dashboard animation highlighting equipment speed losses, recurring machine stoppages, and production efficiency metrics with detailed analytics.
00:15
HD
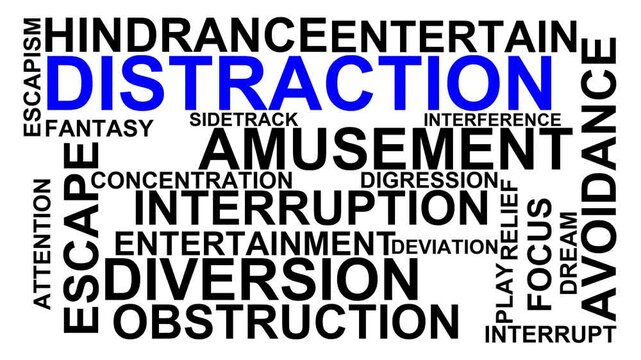
Distraction Word Cloud
00:11
HD
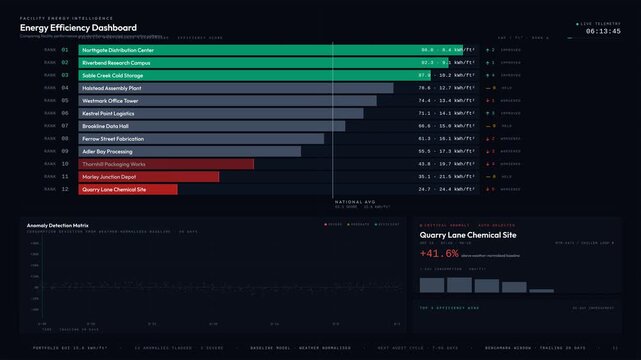
Energy efficiency dashboard visually comparing facility performance and highlighting abnormal consumption patterns with vibrant colors and modern design elements.
00:15
HD
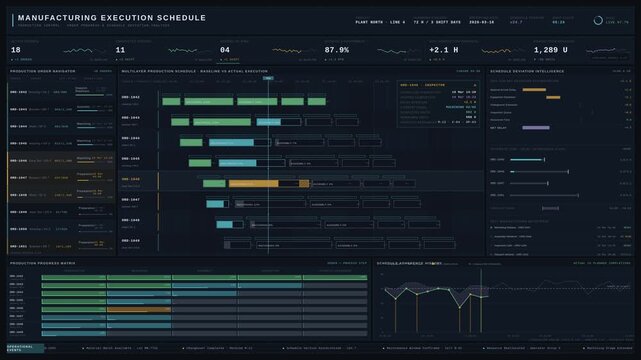
Experience a sophisticated production control dashboard showcasing order progress and manufacturing schedule deviations within an advanced factory operations environment.
00:15
HD
Clean 4K textless data science growth graph animation featuring dynamic regression curve, scatter data points with confidence deviation lines, progressive clip-path suspense reveal, glowing circle mar
00:12
HD
Medical back assessment: physician examine, young woman, scoliosis detect, spinal curvature, health care, posture analyze, physical check, body structure.
00:08
HD
Abstract animated deviations flagged against a learned baseline drawn as cool blue-white lines and shapes on a bright, clean light background. Seamless looping 4K motion graphics video with free space
00:07
HD
Thermal deviation map reveals uneven heat pattern
00:09
HD
Sci-fi HUD interface cyan warning screen for MAGNETIC FIELD WEAKENING and freq deviation
00:10
HD
A comprehensive pharmaceutical manufacturing quality dashboard showcasing GMP compliance with detailed metrics, batch statuses, and deviation tracking in a sleek design.
00:15
HD
A cinematic view of a dark Electricity Grid Control Center dashboard featuring real-time metrics, alerts, and generator dispatch information in a high-tech environment.
00:15
HD
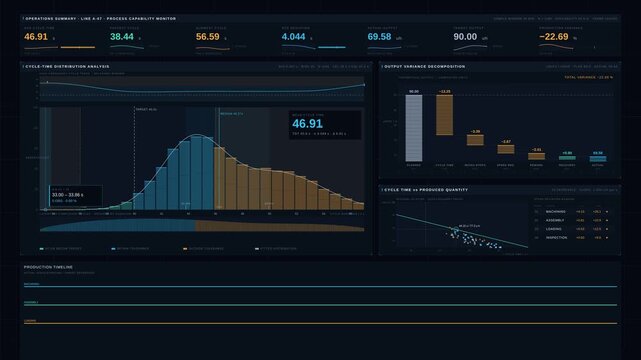
Cinematic smart factory performance dashboard visualizing cycle times and output variance with animated histograms, waterfall charts, and process timing diagrams in a premium midnight blue.
00:15
HD
Aerial footage of the Tirtonadi Rubber Dam in Solo, Central Java, Indonesia, functions to regulate water deviation and prevent flooding of the Bewangan Solo River. High quality 4k footage
00:24
HD
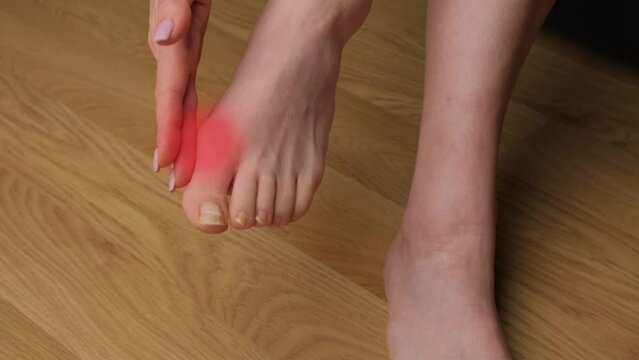
Close-up of a woman's feet with hallux valgus. Leg pain with red light.
00:06
HD
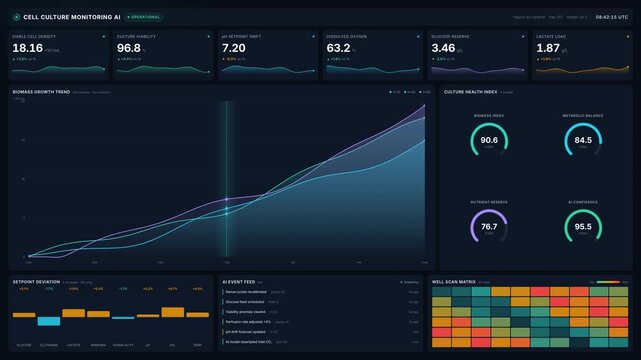
Cell culture monitoring ai dashboard in 4k with live biomass growth curves, viability gauges, setpoint deviation, for biotech analytics lab quality control
00:20
HD
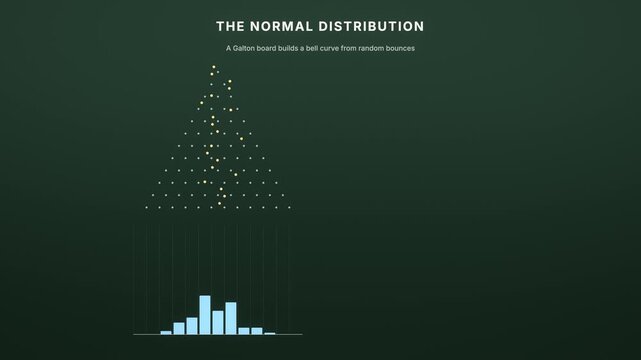
Galton board balls building a normal distribution bell curve on a chalkboard, seamless loop
00:15
HD
Clinical Trial Manager Reviews Patient Enrollment Data
00:18
HD
ANOMALY neon sign animation with a vibrant reflection on a black background, representing a deviation from the norm, a unique event and channel, or an unusual data point
00:12
HD
Stock Market Price Fluctuation Volatility Display Animation
00:15
HD
AI runaway
00:09
HD
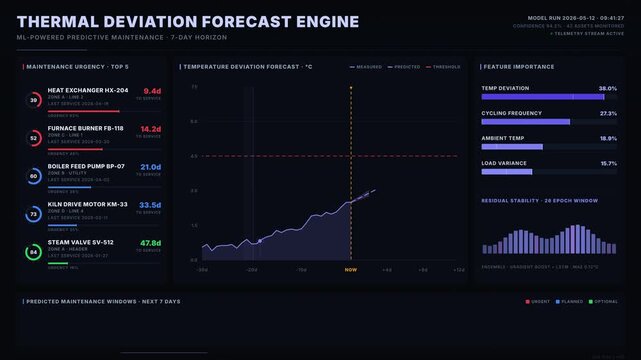
A cinematic dark dashboard for thermal equipment predictive maintenance featuring temperature deviation forecasting with vibrant indigo and violet analytics theme.
00:15
HD
System detecting and analyzing network vulnerabilities using advanced data analytics, ensuring cybersecurity protection and identifying potential threats or deviations from performance
00:17
HD
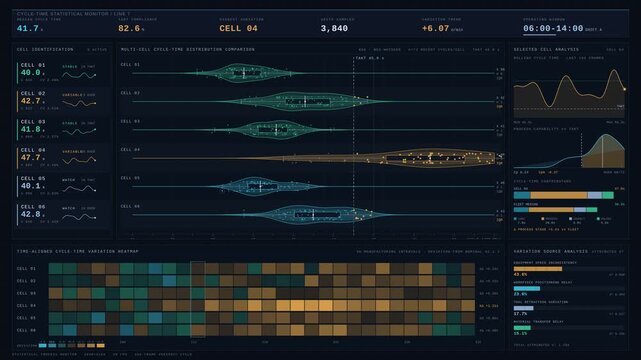
4K industrial dashboard analyzing manufacturing cycle time variations with violin plots, box-whisker summaries, and takt-time compliance metrics across six production cells in a dark interface.
00:15
HD
Lone black sheep among white sheep, clear background,
00:05
HD
woman's foot with bunion
00:09
HD
Yellow balance ruler. Bubble level ruler leveling of vertical deviation of metal construction.
00:10
HD
Abstract animated temperature excursion flagged along a route drawn as blue and cyan lines and shapes on a deep dark background. Seamless looping 4K motion graphics video with free space for text, ide
00:07
HD
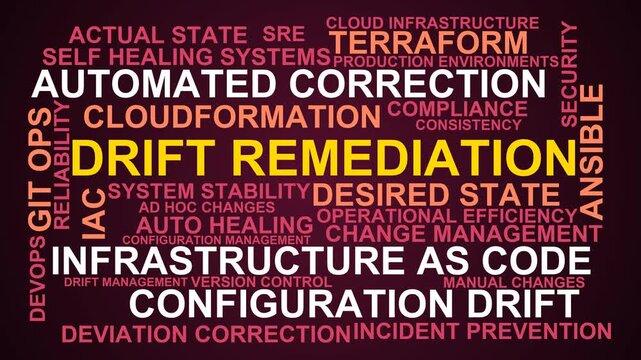
Drift Remediation Word Cloud
00:11
HD
A man builder measures of the vertical deviation of plasterboard wall. Bubble level ruler close up view, measuring and leveling concept
00:16
HD
measurement horizontal deviation of construction. Balance Bubble level ruler, Tools equipment building and engineering. Civil engineer Asian man in safety hard hat helmet working at construction site
00:10
HD
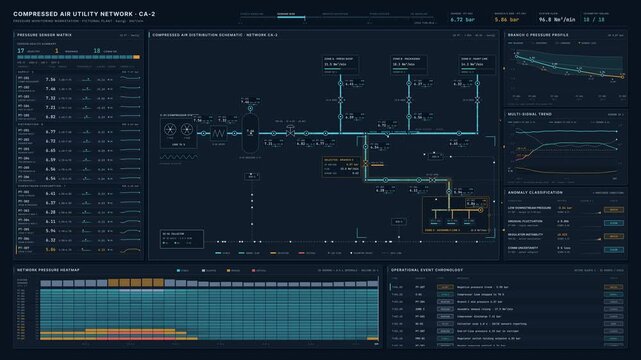
Cinematic industrial dashboard visualizing factory utility network pressure variations, sensor telemetry, and pipeline flow diagnostics in navy and cyan.
00:15
HD
Visualize AI-powered fraud detection with dark enterprise analytics showcasing anomalous transaction behavior in a sophisticated animated network of data pathways and nodes.
00:15
HD
Aerial footage of the Tirtonadi Rubber Dam in Solo, Central Java, Indonesia, functions to regulate water deviation and prevent flooding of the Bewangan Solo River. High quality 4k footage
00:18
HD
Woman suffering from bunions and hammer toes at her feet moving her to tose to show her limited movement ability
00:14
HD
Doctor radiologically analyzing the spinal column with x-ray.
Hand of a doctor analyzing and pointing with a pen to the affected area.
00:16
HD
CV Coefficient of Variation acronym. CV acronym Ratio of standard deviation to the mean, indicating relative variability. Modern technology. digital interface on cyan color background
00:10
HD